HNT Bull Trap… or the Start of a Massive Move?Yello Paradisers, did you notice what just happened with HNT? While most crypto traders were panicking due to the lower lows, we spotted a hidden bullish divergence forming, and it appears the market is now waking up to it.
💎 After weeks of trending inside a clean descending channel, #HNTUSDT just gave us the first real sign of a potential reversal. The move began with a sharp liquidity sweep below the descending support, trapping late sellers and triggering fresh demand exactly inside the major support zone between $1.307 and $1.363.
💎Zooming in, the MACD is showing a clear bullish divergence, price making lower lows while the MACD formed higher lows. Right after that, we got a bullish crossover, confirming momentum is shifting back in favor of the bulls. These are the exact kind of high-probability signals we wait for, and they’re not common.
💎Now that the price has broken above the descending structure, all eyes are on the next key levels. If HNT can maintain this momentum, we expect a test of the $1.445 area as minor resistance, where a temporary pullback could happen. However, if that level is claimed with strength, the next zone to watch is $1.539, followed by the strong resistance range between $1.730 and $1.74. This is where we'll reassess everything and prepare for either a continuation or rejection.
💎On the flip side, if #HNT breaks down and closes below $1.258, this whole bullish scenario will be invalidated. At that point, we’ll consider this a failed breakout and prepare for downside continuation. Until then, the structure looks strong and healthy.
Discipline, patience, and strategy always win.
MyCryptoParadise
iFeel the success🌴
HNTUSDT

Helium looking for bottoms. HNT is showing early signs of bearish exhaustion, with a swing failure and clear bullish divergence appearing at a major horizontal support zone. This area has historically acted as an accumulation region, making it a point of interest — but the mid-term trend is still down, so risk management remains essential.
Volume is still weak, meaning buyers haven’t stepped in with conviction yet. A shift in market structure would be the confirmation needed for a broader reversal.

HNT Ready for a Massive Move or Total Collapse?Yello Paradisers, are you paying attention? Because #HNTUSDT is now at a critical make-or-break level and the next few candles could decide everything.
💎After weeks of downward drift inside a clean descending channel, #HNT has just shown its first real signs of strength. The bounce from the strong demand zone between $1.70 and $1.90 is not random it’s a key zone we’ve been watching since early October. The structure has now shifted from passive to active accumulation, and the market is hinting at a potential breakout.
💎We’re currently trading above $2.25, right inside a mid-range demand zone. If price holds this area and manages to build momentum above $2.40, the door opens for an explosive move towards the minor resistance at $3.15. A successful breakout from this descending channel structure would likely extend the rally even further, with $3.95 standing as the next major resistance and potential profit-taking area.
💎Momentum indicators are flipping. MACD histogram has turned green, and volume is starting to show life again. All eyes are now on how price reacts over the next few days.
💎However, if the market fails to sustain this breakout attempt and slides back below the $2.00 mark, the bullish thesis gets weaker. A breakdown below $1.90 re-exposes the strong demand zone, and if $1.70 fails, invalidation sits at $1.47. Below that, the setup is dead, and we’d be looking at a reset of the entire structure.
This is the exact type of environment where inexperienced traders blow up chasing green candles or panic-selling strong demand. Don’t be that trader.
MyCryptoParadise
iFeel the success🌴

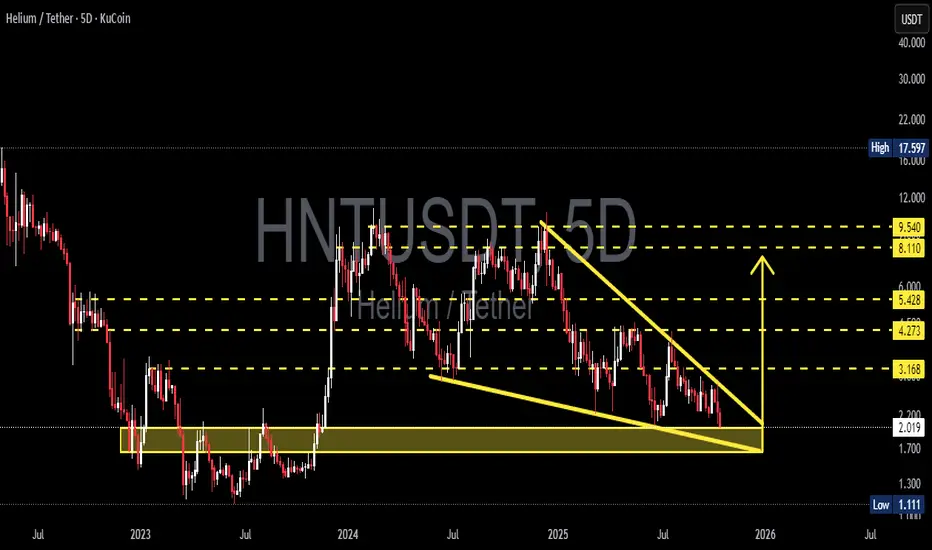
HNT/USDT — Compression Explosion: Accumulation or Capitulation?HNT is once again testing its major historical support zone between 1.70–2.02 USDT, a critical demand area that has acted as a price fortress since 2023. The chart is currently forming a Falling Wedge pattern, a classic structure that signals trend exhaustion and potential reversal.
As the wedge tightens near a key support base, volatility compression suggests that a massive move is approaching — either a strong bullish breakout or a capitulation breakdown.
---
🔹 Pattern Explanation
The chart reveals a Falling Wedge pattern — a series of lower highs and lower lows that converge, often preceding a bullish reversal when price breaks upward with strong volume.
HNT is now hovering right above its historical demand zone, signaling potential smart money accumulation before a larger trend shift.
Key Resistance Levels to Watch:
3.168
4.273
5.428
8.110
9.540 USDT
Major Support Zone: 1.70 – 2.02 USDT (yellow box)
---
🟢 Bullish Scenario — Reversal Loading
If HNT can break and close above the upper trendline of the wedge on the 5D timeframe with strong volume confirmation, it would mark the end of the extended downtrend.
Such a breakout could trigger a multi-month recovery rally, with potential upside targets at:
3.16 → 4.27 → 5.42 → 8.11 → 9.54 USDT
Given its proximity to the accumulation zone, the risk-to-reward ratio is highly favorable for swing or position traders anticipating a reversal.
---
🔴 Bearish Scenario — Breakdown to Historical Lows
However, if the 1.70–2.02 USDT support zone fails, bearish momentum could accelerate.
A confirmed 5D close below this level would expose the next potential target near:
1.11 USDT (historical low)
Failure to defend this demand zone could trigger another leg of capitulation, likely marking the final phase of the bearish cycle before true bottom formation.
---
⚖️ Conclusion
HNT is currently standing at a critical inflection point — a zone that will likely determine the next major trend.
The Falling Wedge structure favors a bullish breakout if volume confirms,
but a breakdown below 1.70 would shift the structure into a final bearish continuation phase.
This is a compression-before-explosion setup — and whichever direction breaks first could define the next several months of HNT’s market structure.
#HNT #Helium #HNTUSDT #CryptoAnalysis #TechnicalAnalysis #FallingWedge #SupportZone #Breakout #AltcoinSetup #ChartPattern #BullishSetup #CryptoTrader
HNTUSDT 5D AnalysisHNT ~ 5D Analysis
#HNT Buy back on retest of this support block with short term target of at least 20%+ from here.

TradeCityPro | HNT: Testing Resistance in DePIN Uptrend Structur👋 Welcome to TradeCity Pro!
In this analysis, I’ll review the HNT coin. The Helium project is a U.S.-based Web3 and DePIN initiative.
✔️ This coin has a market cap of $9.26 million and is ranked 97th on CoinMarketCap.
⏳ 4-Hour Timeframe
On the 4-hour chart, HNT has an ascending trendline with a resistance zone near 4.372.
💥 If this resistance is broken, the main upward move may begin, and a breakout above this level confirms a bullish trend for HNT.
📈 So for a long position, you can enter on the breakout or a pullback to this zone. The next resistance level is 5.333.
🔽 For a bearish scenario, the ascending trendline must be broken first to signal a potential reversal. A break below 3.971 would be the first confirmation of that trendline break and can be used as a short trigger.
⚡️ The main short trigger would be a break of 3.642, which could push the price down toward 3.245.
🧩 The RSI oscillator is currently sitting on the 42.91 support; a breakdown here would confirm bearish momentum for a short setup.
📝 Final Thoughts
This analysis reflects our opinions and is not financial advice.
Share your thoughts in the comments, and don’t forget to share this analysis with your friends! ❤️

HNTUSDT Setting Up for a Breakout? Don’t Miss This MoveYello, Paradisers! what if one of the quietest altcoins on the board right now is actually setting up for a move that could catch most retail traders off guard? While the market’s been focused on noisy large caps, #HNTUSDT has been silently showing strength, forming a healthy bullish structure, and reclaiming key technical levels. We've been closely tracking its behavior across multiple timeframes—and the signs are becoming too strong to ignore.
💎#HNT has recently flipped a lower timeframe resistance into clean support, a classic early probable indicator that bulls are gaining control. What adds more credibility to the setup is the formation of a bullish market structure, marked clearly by consistent higher highs and higher lows. This is not just a short-term bounce. The pair has also broken out of a long-standing descending resistance trendline, a breakout that many likely underestimated. What's even more important is how the price has been respecting this broken trendline ever since, turning previous resistance into dynamic support—which is a textbook sign of a trend reversal gaining traction.
💎Zooming out slightly, the pair has also reclaimed a critical medium-term resistance zone, now acting as solid support. This is another strong bullish probability because it shows that buyers are stepping in with confidence at levels where they previously struggled.
💎The 1H chart further confirms the momentum, with clear market structure continuing to form, and the price now respecting multi-timeframe EMA-12. Historically, this EMA has acted as a pivot point for HNTUSDT whenever price has maintained above it, impulsive upside movements followed. So the fact that it’s currently being respected again adds confluence to the bullish probability building here.
💎To strengthen the case even further, the RSI is flashing a hidden bullish divergence, which tends to appear during retracements in strong uptrends and often precedes continuation moves. This subtle yet powerful signal is often ignored by inexperienced traders, but when spotted at the right time like now it can greatly enhance the probability of catching the next leg up.
💎From a resistance perspective, we’re watching two zones closely. The first significant area of supply sits between $3.85 and $4.02—a potential short-term barrier where some profit-taking might occur. However, if the bulls continue to defend the current structure and push through this level, the next major resistance lies between $4.40 and $4.55, which could offer a stronger reaction and potential rejection point
💎As always, we need to remain strategic. The invalidation of this bullish outlook would occur with a candle close below the key trendline and support region at $2.708. That’s where structure breaks down, and the probability flips against us. Until then, this is a high-probability setup that aligns well with both technical structure and momentum indicators.
Strive for consistency, not quick profits. Treat the market as a businessman, not as a gambler. Be patient, stay alert, and follow the setup with discipline—because this is how we win long-term, Paradisers.
MyCryptoParadise
iFeel the success🌴

Helium HNT bullish moveWhat Is Helium (HNT)?
Helium (HNT) is a decentralized blockchain-powered network for Internet of Things (IoT) devices.
Launched in July 2019, the Helium mainnet allows low-powered wireless devices to communicate with each other and send data across its network of nodes. Nodes come in the form of so-called Hotspots, which are a combination of a wireless gateway and a blockchain mining device. Users who operate nodes thus mine and earn rewards in Helium’s native cryptocurrency token, HNT.
I think helium will soon rise to a value 19 usdt. Good entry now or less. Value 3 and 2.3 are possible.
Total supply: 177.39M HNT
Max. supply: 223M HNT
Circulating supply: 177.39M HNT
This is only my idea guys.
This is not financial advice !
Please do your analysis and consider investing !! Thanks for supp.

HNTUSDT 5DHNT ~ 5D Analysis
#HNT So far it still continues to maintain this support block. Buy from here if you still have a Conviction on this coin.

HNT/USDT Trading ScenarioThe price chart of the asset shows a significant increase in trading volumes within a broad range from $2.875 to $11.153. From a volume analysis perspective, despite pronounced volatility, market participants continue to accumulate the asset within the current price corridor. At the moment, the asset's price is below the POC (Point of Control) level and has bounced off the support level at $2.875, which marks the lower boundary of the active range.
Given the current dynamics, a gradual price movement toward the upper boundary of the range can be expected, which may lead to a breakout of this level and further development of the upward trend. Such scenarios are supported by the fact that increasing trading volumes in the direction of the current trend typically signal its stability and the likelihood of continuation.

TradeCityPro | HNT: Key Support & Potential Breakout Levels👋 Welcome to TradeCity Pro!
In this analysis, I will review the HNT coin. This project is part of the Web & IoT sector and operates within the Solana ecosystem.
📅 Weekly Timeframe
In the weekly timeframe, we can see a consolidation box that formed after a strong upward leg. The bottom of this box is at $3.007, while the top is at $9.696.
🔍 A curved trendline is also visible, which previously supported the price from $1.226 to $9.696. However, this trendline was broken, triggering a downward move. As a result, selling pressure increased, leading to a decline towards the bottom of the consolidation box.
🔽 Currently, the price is at a critical support level that could determine the trend for the coming months. If RSI stabilizes below 36.52, it would indicate strong bearish momentum, increasing the likelihood of a break below $3.007.
⚡️ If this support level is broken, the market structure will change, and the price could drop further to the $1.226 support level.
📈 If the price rebounds from this support and starts forming a bullish structure, the most important breakout trigger will be at $9.696. If this level is broken, the next upward leg could begin, with a target of $30.787.
📅 Daily Timeframe
In the daily timeframe, we can observe the latest price movement in greater detail.
💥 After reaching the $9.210 resistance and facing rejection, bearish momentum intensified, causing the price to decline sharply in a waterfall pattern, dropping to $3.177.
🔑 In waterfall declines, a trendline usually forms, and breaking this trendline typically ends the move, leading to a range-bound phase. Therefore, if the price breaks this trendline, I expect the downward leg to end. Confirmation could also come from RSI breaking above 43.18.
📉 For short positions, an entry can be considered if the $3.177 support breaks. If this happens, stronger bearish momentum could push the price toward the $2.104 support level. However, I believe that if the price ranges and consolidates above $3.177 before breaking down, the short setup would be more reliable.
🔼 For long positions, no clear structure has formed yet. We need to wait for price action to develop and provide valid entry triggers.The first potential trigger is at $4.220, followed by $5.474.However, these levels could shift if a new price structure forms, so I recommend waiting for updated triggers before entering a long position.
📊 Market volume analysis shows that selling volume dominates, with large red candles exceeding the size of green candles during corrections. This suggests that sellers currently control the market momentum.
📝 Final Thoughts
This analysis reflects our opinions and is not financial advice.
Share your thoughts in the comments, and don’t forget to share this analysis with your friends! ❤️

Trading opportunity for HNTUSDTBased on technical factors there is a Buy position in :
📊 HNTUSDT
🔵 Buy Now
🪫Stop loss 2.970
🔋Target 4.250
📏 R/R 2
💸RISK : 1%
We hope it is profitable for you ❤️
Please support our activity with your likes👍 and comments📝

Helium ($HNT) Mobile Launches Free 5G PlanHelium Mobile has just unveiled its revolutionary "Zero Plan," offering users free 5G wireless service with 3GB of data, 300 texts, and 100 minutes of calls per month. This marks a significant shift in the mobile industry, as Helium Mobile operates on a decentralized, community-powered network. With a waitlist now open, demand is expected to soar. But how does this impact Helium’s native token, FWB:HNT , and what does technical analysis suggest about its price trajectory?
The Power of Decentralized Wireless
Unlike traditional telecom providers, Helium Mobile leverages a user-operated 5G network, where individuals set up and maintain nodes in exchange for crypto rewards. This decentralized model allows the company to redistribute value to users rather than corporate giants.
Technical Analysis
While the announcement is a fundamental breakthrough, the price of FWB:HNT has been trading in a falling wedge pattern, indicating a potential bullish reversal.
- Current Price Action: At the time of writing, FWB:HNT is down 3.54%, reflecting market hesitation despite the bullish fundamentals.
- RSI (Relative Strength Index): The RSI is currently 33.52, signaling an oversold condition—historically, this level has preceded strong price rebounds.
- Volume Analysis: Volume remains relatively flat, suggesting an impending spike as traders position themselves for a move.
- Moving Averages (MA): FWB:HNT is trading below its moving average, typically a strong bullish signal when combined with oversold RSI levels.
Key Levels to Watch:
- Support: The current support level sits near the **$3.50 mark**, aligning with the base of the falling wedge.
- Resistance: A breakout above $5.20 could trigger a move toward $6.50–$7.00, as it coincides with previous resistance levels.
Final Thoughts
Helium Mobile’s free 5G plan is a disruptive force in the wireless industry, empowering individuals through decentralized technology and tokenized incentives. While FWB:HNT 's price has dipped, technical indicators suggest a potential bullish breakout in the near future.
As adoption of Helium’s network increases, demand for FWB:HNT and SEED_DONKEYDAN_MARKET_CAP:MOBILE tokens could surge, making this a critical time for investors to keep an eye on Helium’s ecosystem. The fusion of crypto and telecom has never looked more promising.

HNTUSDT 3DHNT ~ 3D
#HNT In 3D Time Frame, Retest this support block,. Buy from here if you still have Conviction on this coin with a minimum target of 20%+

Trading opportunity for HNTUSDTBased on technical factors there is a Buy position in :
📊 HNTUSDT
🔵 Buy Now
🪫Stop loss 4.500
🔋Target 6.950
📏 R/R 3
💸RISK : 1%
We hope it is profitable for you ❤️
Please support our activity with your likes👍 and comments📝

Where is the good shopping area?hello friends
This currency has been able to attract the attention of buyers with its good growth.
Now that it is in the correction phase, it is a good opportunity to buy a step.
We have defined the purchase steps for you and we have also defined its goals.
*Trade safely with us*

TradeCityPro | HNTUSDT Don’t Miss the New Move!👋 Welcome to TradeCityPro Channel!
Let’s get ready for the upcoming week! We’ll either see a strong movement or some consolidation, so let’s prepare our triggers in advance and analyze all scenarios before the market moves.
🌍 Bitcoin Overview
As always, let’s start by checking Bitcoin to complement our altcoin analysis. Today, BTC broke its 102,135 trigger but faces a significant resistance at 103,504. With increased volume, a breakout above this level could finally help BTC clear the critical $100K barrier.
For the upcoming week, if Bitcoin’s dominance rises and BTC follows suit, prioritize Bitcoin trades or coins that perform well against BTC. If BTC dominance drops, focus on altcoins. However, the first bullish move will likely coincide with rising BTC dominance.
⏰ Weekly Time Frame
Helium (HNT) shows relatively strong performance compared to other altcoins and is a good candidate to add to your portfolio this week!
HNT started its upward movement before the current bull run, maintaining a positive trend since 2023. This year, it recorded a higher low compared to 2023 and is now approaching its main resistance, attempting to break through.
The coin follows a parabolic trajectory, which is inherently bullish. Each time it hits the lower boundary of this parabola, it rebounds strongly, and this trend could continue.
This week’s candle closing above the SMA7 signals buyer strength despite seller presence. Buyers have emerged victorious with significant volume. After this candle closes, you can consider a spot buy with a risky stop loss below the shadow or a safer stop loss at 5.437. If RSI enters the overbought zone, expect a sharp upward move.
📅 Daily Time Frame
On the daily chart, HNT has outperformed other altcoins during its recovery and is currently testing a daily resistance level. A breakout here could trigger a sharp upward move.
Volume analysis shows reduced activity during the correction phase and increased volume during upward movements, confirming buyer strength in the market.
After breaking the trendline and finding support at 5.524, the coin moved upward. A potential buy entry lies at the breakout of 9.244. Follow this closely for spot or futures long positions, especially if RSI enters the overbought zone, which would provide excellent confirmation.
🔍 4-Hour Timeframe Analysis
HNT is currently facing a critical resistance at 9.393. Buyers have been active, attempting to break this level, which could lead to further bullish continuation after a successful breakout.
Before discussing triggers, let’s briefly cover the Fake Breakout strategy. This occurs when a support or resistance is initially broken but quickly reversed in the next candle, potentially signaling a trend change. Identifying this on lower timeframes can guide you to a solid entry after the first breakout.
📈 Long Position Trigger
breakout above 9.393 is a great trigger. Personally, I’ll be looking for a long entry above this level and will continue to hunt for long triggers as long as HNT stays above 8.004.
📉 Short Position Trigger
I’m not considering any short positions for now. If the market enters a bearish phase, I’ll look for lower long triggers instead.
💡 BTC Pair Insight
Against Bitcoin, HNT is in a ranging box with less volatility compared to BTC and hasn’t experienced severe drops like other altcoins. Its absence from Binance and limited volume data make it less prominent, but these factors have helped it avoid extreme sell-offs.
HNT has risen from a higher low within its range. With Bitcoin dominance closing green on the weekly chart, HNT’s weekly candle also closing green is a positive sign. After breaking the box’s upper boundary, I’ll consider holding it longer.

HNT IOT breakout is about to happen ,,,,11$ is very near HNT is about to breakout from the 4 H downtrend
take a position and DCA from here and let's see 11 $ sooner than later

#HNT Price Update & Analysis in a 2-Day TimeframeIn our previous HNT update, we anticipated a potential rejection at the $3.80 support, followed by a rebound towards $11.
Well, it happened! HNT dropped as low as $3.46 before making a sharp recovery, surging up to $8.67—a remarkable 150% rally.
Currently, it's holding strong at the 21 EMA and aiming for $11 again. However, if it fails to hold this support, we could see a correction down to the $5 level.
Key levels:
- Crucial Support: $7 21 EMA.
- Lower Support: $5.
- Target: $11.
DYOR, NFA.
Like, share, and follow for more.
Thank you.
#HNT #Crypto

HNT HELIUM / DCA / TP & REFILLAfter a nice DCA on this token and a good profit taking, I am starting to re-accumulate as the correction progresses.
Patience always pays off in the end. HNT should go much higher later on, this is just a very successful first bullish move.
Helium is an incredible project in any case, with real use cases, I really like this project (like ANKR & FLUX).

HNT (Helium): Pullback in UptrendTrade setup : Price is in an Uptrend. Price rallied over +100% since breakout from Channel Down (we highlighted it as HOT trade setup). It's also broken through 200-day MA and $5.50 stiff resistance, which renews the long-term uptrend. After reaching our target of $8.00 resistance, we look for the right entry opportunity in Uptrend. We wait for price to pull back near $5.50 key level for another swing trade entry in Uptrend with +40% upside potential back to $8.00.
Pattern : Pullback in Uptrend. Price remains in an Uptrend but has pulled back, which could present a 'buying dip' opportunity. Traders should look for the nearest support level where price could stabilize and resume its Uptrend. This support level could be a level where price bounced off of in the past, or a level that was previously resistance. (concept known as polarity).Learn to trade key levels in Lesson 3.
Trend : Short-term trend is Up, Medium-term trend is Strong Up and Long-term trend is Up.
Momentum : Price is neither overbought nor oversold currently, based on RSI-14 levels (RSI > 30 and RSI < 70).
Support and Resistance : Nearest Support Zone is $4.00, then $3.00. Nearest Resistance Zone is $8.00, then $9.60.

HNT Technical Analysis In 2-Day TimeframeHello everyone, I’m Cryptorphic.
For the past seven years, I’ve been sharing insightful charts and analysis.
Follow me for:
~ Unbiased analyses on trending altcoins.
~ Identifying altcoins with 10x-50x potential.
~ Futures trade setups.
~ Daily updates on Bitcoin and Ethereum.
~ High time frame (HTF) market bottom and top calls.
~ Short-term market movements.
~ Charts supported by critical fundamentals.
Now, let’s dive into this chart analysis:
HNT showed a decent breakout and rally, but due to the recent market correction, it is experiencing rejection as well.
If the market rejects further, HNT will also face further rejection, potentially reaching as low as $3.8, where there is good support.
A rebound can be expected from the support level, potentially rallying toward the local high of $11.
Key levels:
- Primary Support/Entry: $3.83
- Lower Support: $2.88
- Target: $8-$11.
DYOR. NFA.
Please hit the like button to support my content and share your thoughts in the comment section. Feel free to request any chart analysis you’d like to see!
Thank you!

HNT HNT / USDT
Helium is showing great bounce after breaking out from falling wedge which setting on previous support zone
The current bullish wave is the potential 5th wave or the 3rd wave of macro impulse Elliot waves
Do u agree ?
Best of wishes
