HOLOUSDT UPDATEHOLO
UPDATE
HOLO Technical Setup
Pattern: Falling Wedge Pattern
Current Price: 0.0745 USDT
Target Price: 0.1331 USDT
Target % Gain: 69.80%
Technical Analysis: HOLO is breaking out of a falling wedge pattern on the 1D chart, signaling bullish potential. Price has successfully pushed above the wedge resistance after prolonged consolidation, with strong bullish candles confirming the breakout. The projected move targets the upper resistance zone near 0.1331 USDT, aligning with the measured move from the wedge structure.
Time Frame: 1D
Risk Management Tip: Always use proper risk management.
Holousdt

HOLOUSDT UPDATE#HOLO
UPDATE
HOLO Technical Setup
Pattern: Falling Wedge Pattern
Current Price: $0.0947
Target Price: $0.1610
Target % Gain: 70.59%
Technical Analysis: HOLO has broken out of a falling wedge pattern on the 4H chart, signaling a potential bullish reversal. Price reclaimed the breakout zone highlighted in the purple support block, showing buyers stepping in. The recent wick spikes and recovery back above the breakout level strengthen the bullish case as the chart pushes toward key resistance levels.
Time Frame: 4H
Risk Management Tip: Always use proper risk management.

HOLOUSDT UPDATE#HOLO
UPDATE
HOLO Technical Setup
Pattern: Bullish Falling Wedge
Current Price: $0.1607
Target Price: $0.2993
Target % Gain: 86.20%
NASDAQ:HOLO is breaking out of a bullish falling wedge pattern on the 1D timeframe. Current price is $0.1607 with a target near $0.2993, indicating about 86% potential upside. The breakout shows renewed bullish strength, suggesting possible continuation toward higher levels.
Time Frame: 1D
Risk Management Tip: Always use proper risk management.

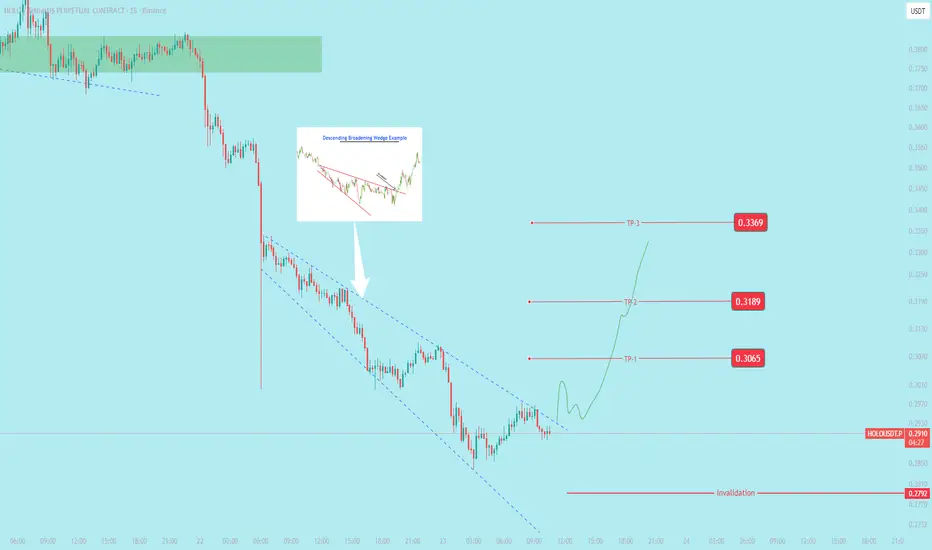
$holoworld forming descending broadening wedge pattern; await bbullish chart pattern that signals a potential reversal of a downtrend. Unlike a normal wedge, where trendlines converge, the trendlines in a broadening wedge diverge, showing increased volatility
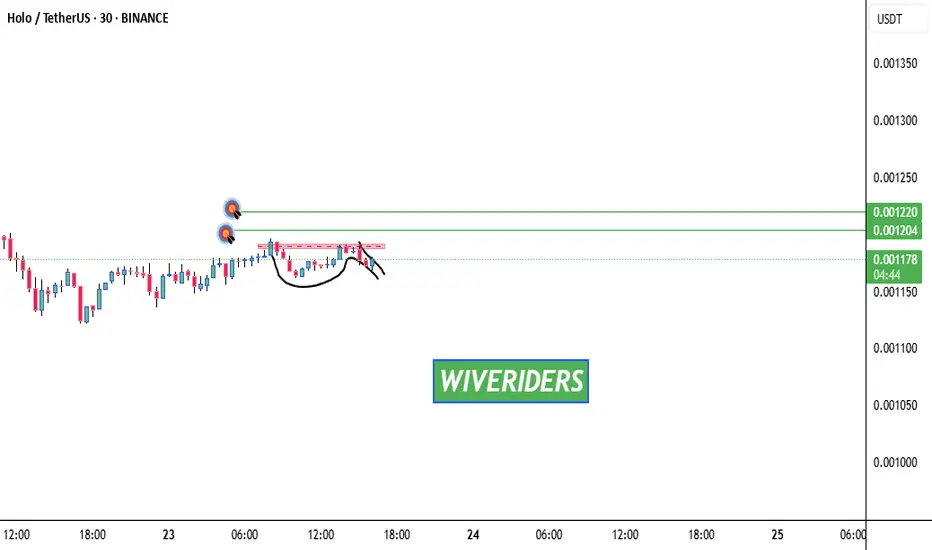
Cup & Handle Formation 🚨 XETR:HOT Testing Red Resistance – Cup & Handle Formation 📈
XETR:HOT is currently testing the red resistance zone and has formed a bullish Cup & Handle pattern on the chart — a classic continuation setup.
If breakout is confirmed, potential upside:
✅ First Target: Green line level
✅ Second Target: Green line level
🕵️♂️ Wait for clear breakout confirmation before entering long.
This pattern often signals strong momentum if buyers step in.
Trade smart. Let’s monitor for the perfect entry! 💹💼
HOLO (HOT) paired with USDT, focusing on a 4h tmeframeTechnical Analysis by Blaž Fabjan
Ascending Channel:
The price is moving inside an ascending channel with clear resistance and support lines. This channel is characterized by higher highs and higher lows, indicating an upward trend.
The price has previously bounced off the support line multiple times, confirming the validity of the ascending channel.
The price action is approaching the upper resistance line of the channel, which could act as a barrier for further upward movement unless broken.
Potential Scenario:
The chart suggests a pullback after testing the resistance, with the potential for the price to drop back to the support line of the ascending channel before resuming its upward momentum.
The upward arrow drawn on the chart indicates an expectation of a bullish continuation after the pullback.
RSI (Relative Strength Index):
The RSI indicator currently sits around 58, which is in the neutral zone, not showing overbought or oversold conditions. This suggests that there is still room for the price to move in either direction.
A possible future rise in the RSI towards overbought levels (above 70) would align with the forecasted bullish move.
Stochastic RSI:
The Stochastic RSI is above 80, indicating that the asset is in overbought territory. This supports the idea of a short-term pullback before another upward move.
Once the Stochastic RSI cools down and approaches oversold levels, it could signal a better entry point for a long position.
MACD (Moving Average Convergence Divergence):
The MACD is slightly bullish with some divergence, showing that momentum is in favor of buyers, but it's not very strong.
A potential bullish cross of the MACD signal lines could confirm further upside momentum.
Volume:
The volume seems relatively stable, although not significantly high. Higher volume on a breakout above the resistance line would confirm a stronger bullish trend.
Trading Plan:
Entry Point:
Wait for a pullback towards the support line of the ascending channel (around $0.00165 - $0.00160), which could provide a better entry point for a long position.
Confirm entry with a bounce off the support line, or when indicators such as the RSI or Stochastic RSI reach oversold conditions.
Stop Loss:
Place a stop loss below the support line of the channel, at approximately $0.00155, to limit losses in case of a breakdown below the channel.
Target:
First target: Resistance of the ascending channel (around $0.00180 - $0.00185). This aligns with the previous highs, offering a solid take-profit level.
Second target: If the price breaks above the resistance line with strong volume, the next target would be around $0.0020 or higher, following the bullish projection shown by the arrow in the chart.
Risk Management:
Ensure the risk-to-reward ratio is favorable, aiming for at least 1:2. For example, if risking 5% (stop loss at $0.00155), the first target should yield at least a 10% gain.
Confirmation:
Before taking any position, look for confirmation through price action, such as bullish candlestick patterns (e.g., bullish engulfing) or strong buy volume when the price touches the support line.
This trading plan outlines a potential setup based on the chart. However, always remember to adapt based on real-time market conditions and further confirmations from your indicators.

Technical Analysis of Holo (HOT) 4H TIMEFRAME ON BINANCEHOT/USDT TECHNICAL ANALYSIS BY BLAŽ FABJAN:
Bullish Falling Wedge Pattern:
The price action indicates the formation of a falling wedge, which is a bullish reversal pattern. The wedge is marked by converging trendlines (resistance line and support line), with the price gradually tightening within the pattern.
The breakout from this wedge has occurred with a slight increase in price and volume, suggesting the start of an upward movement.
Momentum Indicators:
RSI (Relative Strength Index): The RSI is currently around 47.17, indicating neutral momentum. However, there is a slight upward slope, which suggests that momentum is shifting towards the bulls.
Stochastic RSI: The Stochastic RSI is at 78.15, near the overbought region, but not yet fully overbought. This could indicate a short-term pullback or consolidation before another upward move.
VMC Cipher Indicator: The VMC Cipher B divergences indicator shows bullish divergence, further confirming the potential for upward movement. The histogram is turning positive, which is a bullish sign.
Trading Plan:
Intraday Trading:
Entry: Consider entering a long position around the current price levels or upon a slight pullback, ideally around the 0.001580 - 0.001600 support zone.
Target: Target short-term resistance levels around 0.001750 - 0.001800.
Stop-Loss: Place a stop-loss just below the recent low or support level, around 0.001550.
Strategy: Focus on quick scalps and close positions if there is a lack of momentum.
Scalping:
Entry: Enter on minor dips or consolidation phases, particularly around the 0.001600 - 0.001610 range.
Target: Target small profit levels within 0.001630 - 0.001650 range.
Stop-Loss: Keep a tight stop-loss below the 0.001580 level.
Strategy: Utilize tight risk management and be prepared to exit quickly if the price does not move as expected.
Swing Trading:
Entry: Consider entering a long position on the breakout confirmation or upon a retracement back to the breakout zone (around 0.001600).
Target: Aim for higher resistance levels around 0.001900 - 0.002000 based on the measured move of the wedge pattern.
Stop-Loss: Place a stop-loss below the lower boundary of the wedge, ideally around 0.001500.
Strategy: Hold the position over a few days to weeks, depending on the price action and momentum.
Conclusion and Trading Advice for Long Position:
Bullish Outlook: The breakout from the falling wedge pattern suggests a bullish reversal. However, the RSI and Stochastic RSI indicators are neutral to slightly overbought, suggesting caution for overextension in the short term.
Trading Advice:
For Intraday and Scalping: Be prepared for quick trades and potential pullbacks. Ensure tight risk management due to the current levels of momentum indicators.
For Swing Trading: The breakout is promising for a larger upward move. It is advisable to enter on a pullback to minimize risk and target higher resistance levels.
This analysis suggests a cautiously optimistic outlook for HOT/USDT, with the potential for further gains, especially in a swing trading strategy. Always use proper risk management and adjust your strategy according to market conditions.

HOTUSD 1WHOT ~ 1W
#HOT Retesting this Support Line has been successful.
Make purchases gradually starting from here. The bulls will start to push the price to continue rising.

HOT Long Term TargetsThis is just a trial. Nobody knows anything in this market.
But these are my targets for HOT

#HOLO/USDT#HOLO/USDT
The price has been moving in a horizontal rectangle since July 2022
This rectangle was penetrated upward
Which gives us momentum to rise
Current price is 0.002289
The first target is 0.002835
The second goal is 0.003561
Which represents 180% of the current price

#Hot#Hot/usdt
The price has been trading in a large bearish channel since July 2022
Recently, it broke a small bearish channel at the price of 0.001100.
It heads to the upper border of the large channel at 0.001900. First target
In the event that the large channel is broken, the price will head to the 0.002500 level.
as a second target at a rate of 120% of the current price.
All of this is supported by oversold conditions on the MACD indicator.

#HOT #holo is very well accumulated#holonetwork is sitting on a strong, historical support and looks very well...
If market decides to move #holo here, the pump will be insane. Otherwise, I highlighted the another strong support on the chart.
NOT FINANCIAL ADVICE.
#holonetwork güçlü, tarihi bir destek üzerinde oturuyor ve çok iyi görünüyor...
Piyasa #holo'yu buraya taşımaya karar verirse pompa çılgına döner. Aksi takdirde grafikte başka bir güçlü desteğin altını çizdim.
FİNANSAL TAVSİYE DEĞİLDİR.

Holochain Diamond Bottom Formation?Holochain has been lurking in the depths of its 2019 all time high prices for many weeks now. Is it time that traders decide this is the bottom and is that why the price action looks to be creating a diamond bottom? Maybe...

Holo usdt forecast / hot signalPlease write any advice or suggestions.
Dear friends, request any cryptocurrency pair, currencies pair for forex, and any index that you want to be analyzed and ask any questions.
Thanks for your attention

HOT descending triangle bullish breakoutWe can see that holo is breaking out of a diagonal resistance, if it closes above the line it is very bullish for this coin.

HOLO CHART BULLISH SCENARIO (update)Creating a strong bullish sructure on the 4hourly chart.
- Stay safe everybody
- Feel free to share, like and suscribe


Holochain to $1?Well, technically yes, Holochain could become one of the hottest cryptocurrency assets on the planets! It is currently forming a bull flag and very possibly targeting $1+ for its next impulsive move IF the way is UP

HOT ChannelHOT may be moving in a channel in the log scale. It needled 0.002500 which is around %90 below from its ATH. It may retest that area again but after that point in my opinion, next move will be the in the upward direction.
This is my trial. Not a financial advice.

Holo usdtOne of mine favourite coin. Once it enter into trend channel take loong. With tight sl. Then market will decide.

Holo; can break the parallel channel it created.Gaining massive support with its Web 3.0 project, Holochain draws attention with the graphic structure it creates in trade processes.
There is a parallel channel formation and the test phases of the lower-middle-upper bands of this channel seem to have been completed. If bitcoin continues to move horizontally or upwards and there is no problem in the markets, it may reach the targets in the short term.
If the upper band is broken and the test is successful, the targets are:
TP1: 0.014
TP2: 0.017
TP3: 0.019
It is not investment advice. Cryptocurrency trading is quite risky. Please use stop-loss.

💡Don't miss the great buy opportunity in HOTUSD @Holo
Trading suggestion:
". There is a possibility of temporary retracement to the suggested support line (0.01058).
. if so, traders can set orders based on Price Action and expect to reach short-term targets."
Technical analysis:
. HOTUSDT is in a range bound, and the beginning of an uptrend is expected.
. The price is above the 21-Day WEMA, which acts as a dynamic support.
. The RSI is at 56
Take Profits:
TP1= @ 0.01143
TP2= @ 0.01206
TP3= @ 0.01262
TP4= @ 0.01341
TP5= @ 0.01429
SL= Break below S2
❤️ If you find this helpful and want more FREE forecasts in TradingView
. . . . . Please show your support back,
. . . . . . . . Hit the 👍 LIKE button,
. . . . . . . . . . Drop some feedback below in the comment!
❤️ Your support is very much 🙏 appreciated! ❤️
💎 Want us to help you become a better Forex / Crypto trader ?
Now, It's your turn !
Be sure to leave a comment; let us know how you see this opportunity and forecast.
Trade well, ❤️
ForecastCity English Support Team ❤️
