Home Depot: More Room on the UpsideHome Depot has been able to achieve further gains as planned, thus making progress within the magenta wave , which still has a little more room on the upside to reach its top. After that, we expect strong sell-offs into our green Long Target Zone between $313.69 and $287.01, to the low of the larger magenta wave (X). A premature descent into the green zone is 34% likely and would result in an earlier low of the magenta wave alt.(X) .
Homedepot

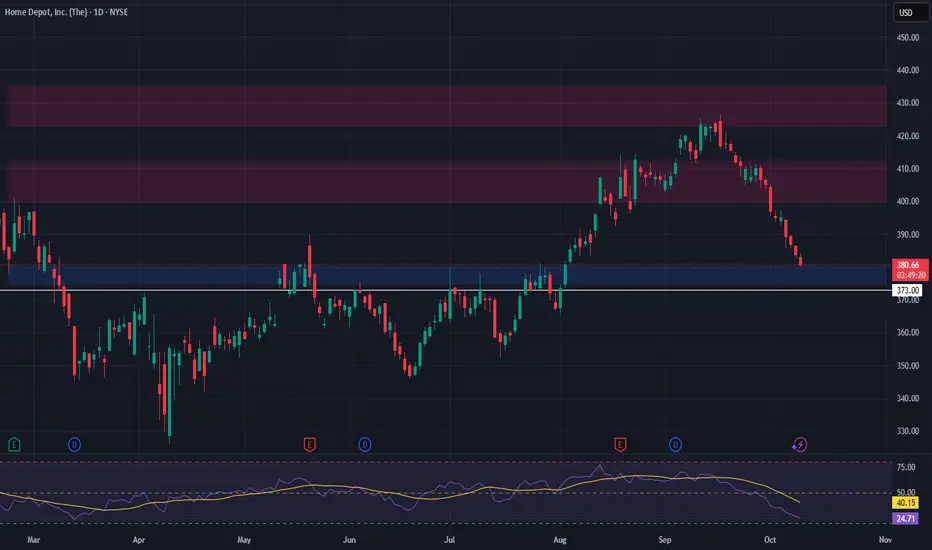
HOME DEPOT About to break its 2-year Support.Home Depot (HD) is on its 1W MA200 (orange trend-line), having arrived here after a violent 2-month sell-off that tested that trend-line for the first time since the April 07 2025 Low.
In fact, this has been the stock's Support since the November 13 2023 break-out (more than 2 years) as it never closed a 1W candle below it. Now, it has completed almost 2 months of trading on it without a major move, but looks ready to break below it, as it appears to be repeating the 2022 Bear Cycle, based also on the 1W CCI.
That Cycle has basically been the Bearish Leg of the stock's long-term Channel Up pattern. Technically this new sell-off should seek the next level of long-term Support, the 1M MA100 (red trend-line), which was last approached during the March 2020 COVID flash crash.
As a result, we expect the price to hit at least $295.00 before the possibility of a new long-term bottom formation.
---
** Please LIKE 👍, FOLLOW ✅, SHARE 🙌 and COMMENT ✍ if you enjoy this idea! Also share your ideas and charts in the comments section below! This is best way to keep it relevant, support us, keep the content here free and allow the idea to reach as many people as possible. **
---
💸💸💸💸💸💸
👇 👇 👇 👇 👇 👇

Home Depot (HD) - Bullish Setup FormingLast week, HD tested a major support zone and swiftly reversed, signaling strong buying interest at lower levels. This bounce confirms the support's validity and opens the door for a potential continuation to the upside. The structure looks clean, with the bulls stepping back in after a healthy correction.
🔄 We're now watching for a minor pullback into the $347–$350 zone — a key area where price may base before its next leg higher. This would offer a favorable risk-reward opportunity for a long spot trade setup.
🎯 Trade Plan:
Entry: $347 – $350
Take Profits:
1️⃣ $365 – $375
2️⃣ $390 – $405
Stop Loss: Just below $331
This setup targets layered exits, managing risk while allowing room for extended gains if momentum continues.

HD Trade Setup – Retesting Support After 5% SurgeHome Depot NYSE:HD has bounced nearly 5% since our last post and is now retesting a major support zone between $375 – $380. This zone has consistently acted as a base, and the current price action suggests buyers may be stepping back in — potentially setting up for another bullish move.
📈 Trade Idea
Entry Zone: $375 – $380
Take Profit Targets:
TP1: $400 – $412
TP2: $423 – $435
Stop Loss: Just below $370
The setup offers a clean risk-to-reward structure with the broader market still holding a bullish bias. Watch for volume confirmation or bullish candlestick signals to strengthen the case.

HD: If this is just a pullback, up again.For NYSE:HD (Home Depot) if this just a pullback, we will be going back up to break the top and reach 450 level.
Always remember WTW 4 Golder Rules:
1) Do not jump in
2) Do not over risk/trade
3) Do not trade without Stop Loss
4) Never ever add to a losing position!
Trade with care
We Trade Waves
WTW Team
Disclosure: We are part of Trade Nation's Influencer program and receive a monthly fee for using their TradingView charts in our analysis.
Home Depot (HD) – Long Setup at Key Support | Spot Trade IdeaHome Depot NYSE:HD has retraced into a crucial support zone between $375 – $380, offering a potential long entry opportunity. This level aligns with prior consolidation and buying interest, and while broader US indices hint at a possible correction, HD is holding this support relatively well.
🔹 Entry Zone: $375 – $380
🔹 Stop Loss: Below $373 (tight, risk-defined)
🔹 Take Profit Levels:
• TP1: $400 – $412
• TP2: $423 – $435
We’re approaching this trade with tight risk management, as market sentiment remains mixed. The setup favors a quick bounce or potential continuation if HD finds strength relative to the S&P 500. Watch volume and price action around the entry zone for confirmation.
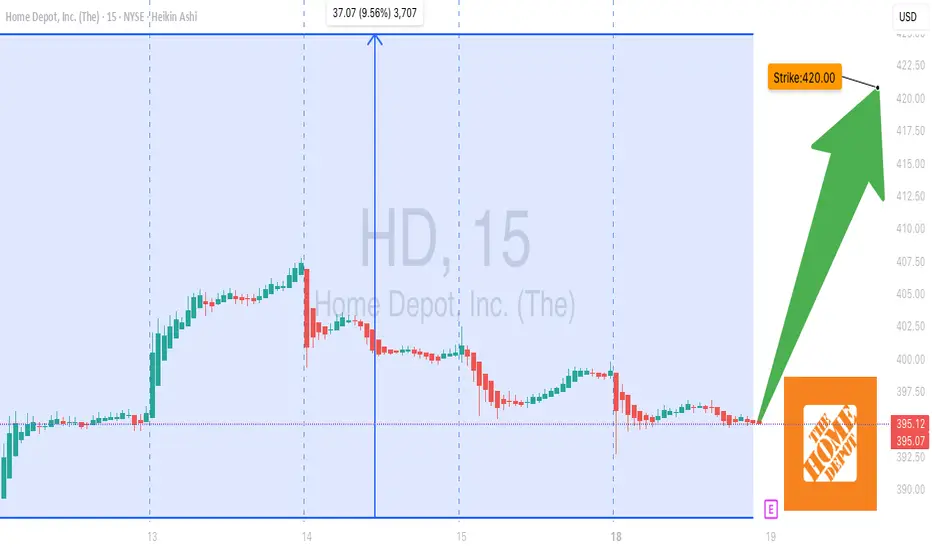
Home Depot 420C Call Setup– Big Move Expected on Earnings
# 🛠️ HD Earnings Options Play – 8/22 BMO
📊 **Market Context**
* Revenue Growth: +9.4% TTM 📈
* Gross Margin: 33.3%, Operating Margin: 12.9%, Profit Margin: 9%
* Forward EPS: \$15.60, Consensus Buy Rating
* Technical Momentum: +7.7% price drift past 2 weeks, key support \$380 / resistance \$420
* Options Flow: Call-heavy volume at \$420 strike, moderate bullish skew
* IV Rank: 65%, priced for \~3.5% post-earnings move
---
## 🎯 Trade Setup (Pre-Earnings Call)
* **Instrument**: HD
* **Direction**: CALL (LONG)
* **Strike**: \$420.00
* **Expiry**: 2025-08-22
* **Entry Price**: \$0.83
* **Profit Target**: \$3.32 (\~300% potential)
* **Stop Loss**: \$0.42 (50% of premium)
* **Size**: 2 contracts
* **Confidence**: 75%
* **Entry Timing**: Pre-earnings close
* **Earnings Date/Time**: 8/22 BMO
* **Expected Move**: \$5.00
---
## 🧠 Key Notes & Risk Management
* **Position Sizing**: Limit exposure to manageable portfolio risk
* **Exit Scenarios**:
* Profit Target → \$1.66 or \$3.32
* Stop Loss → \$0.42
* Time Exit → Close within 2 hours post-earnings if neither triggered
* **Gamma & Volatility Risk**: Moderate due to pre-earnings timing
---
# ⚡ HD 420C EARNINGS PLAY ⚡
🎯 Entry: \$0.83 → Target: \$3.32
🛑 Stop: \$0.42
📅 Exp: 8/22 BMO
📈 Bias: Moderate Bullish (75%) 🐂
---
📊 **TRADE DETAILS JSON**
```json
{
"instrument": "HD",
"direction": "call",
"strike": 420.00,
"expiry": "2025-08-22",
"confidence": 75,
"profit_target": 3.32,
"stop_loss": 0.42,
"size": 2,
"entry_price": 0.83,
"entry_timing": "pre_earnings_close",
"earnings_date": "2025-08-22",
"earnings_time": "BMO",
"expected_move": 5.0,
"iv_rank": 0.65,
"signal_publish_time": "2025-08-18 14:00:30 UTC-04:00"
}
```
Check 350.47 support (HA-MS indicator interpretation method)
Hello, traders.
If you "Follow", you can always get new information quickly.
Have a nice day today.
-------------------------------------
(HD 1D chart)
Can the HA-MS indicator be applied to stock charts?!!!
The conclusion is that it can be applied to all charts.
However, since the stock market is traded one week at a time, you cannot collect stocks corresponding to the profit of the coin market.
Since the coin market can be traded in decimals, you can create a medium- to long-term trading strategy by selling the purchase amount when realizing profit and collecting the number of coins (tokens) corresponding to profit.
The basic trading strategy is to buy near the HA-Low indicator and sell near the HA-High indicator.
However, when conducting short-term trading, you need to be careful to check whether the price is above or below the M-Signal indicator on the 1M chart.
If the price is below the M-Signal indicator on the 1M chart, you need to respond quickly and quickly in the form of day trading.
Therefore, it is important to find stocks that maintain their price above the M-Signal indicator on the 1M chart if possible.
If you are familiar with day trading, you can conduct trading according to the basic trading strategy regardless of the location of the M-Signal indicator on the 1M chart.
However, since the HA-Low or HA-High indicators are intermediate values, they may proceed in the opposite direction to the basic trading strategy depending on whether there is support.
In other words, if the HA-Low indicator is resisted and falls, there is a possibility of a stepwise downtrend, and if the HA-High indicator is supported and rises, there is a possibility of a stepwise uptrend.
To confirm this, you need to check the movement of the auxiliary indicator PVT-MACD oscillator indicator and the OBV indicator consisting of the Low Line ~ High Line channel.
One thing to keep in mind here is that there are differences depending on the situation, whether it is a decline or an increase.
In other words, if the HA-Low indicator declines, there is a possibility of a stepwise decline, but the end is an increase.
This means that if the HA-Low indicator shows a stepwise decline, you should focus on finding the right time to buy.
On the other hand, if the HA-High indicator rises, there is a possibility of a stepwise rise, but the end is a decline.
Therefore, if the HA-HIgh indicator shows a stepwise rise, you should focus on finding the right time to sell.
----------------------------------------------
Looking at the current price position based on the above, the price is located near the HA-Low indicator.
However, since the price is located below the M-Signal indicator on the 1M chart, it is recommended to approach the transaction in a short and fast short-term trading (day trading) manner.
The PVT-MACD oscillator indicator is showing a downward trend below the 0 point.
In other words, it should be interpreted that the selling force is dominant.
The OBV indicator is showing signs of breaking through the Low Line upward.
However, since the Low LIne ~ High Line channel is not showing an upward trend, caution is required when trading even if the price is rising until it turns into an upward trend.
Therefore, the key is whether there is support near 350.47, which is the HA-Low indicator point.
If it receives support and rises above the M-Signal indicator of the 1M chart and maintains the price, it is highly likely to turn into an upward trend.
At this time, since the HA-High indicator of the 1M chart is formed at the 363.37 point, there is a high possibility that it will act as resistance near this point.
Therefore, if you are going to make a mid- to long-term investment in this stock, it is recommended to check for support near 363.37 or near the M-Signal indicator on the 1M chart.
Otherwise, if you are thinking of buying in installments, you can buy whenever it shows support on the HA-Low indicator regardless of the M-Signal indicator on the 1M chart.
This is because the end of the stepwise downtrend on the HA-Low indicator is ultimately an uptrend.
-
Thank you for reading to the end.
I hope you have a successful transaction.
--------------------------------------------------

$HD Tradespoon - Long Entry $381.87Tradespoon model generated long signal for Home Depot NYSE:HD . Predicted range: $381.87–$396.53. Trend: -0.73%. NYSE:HD

HOME DEPOT ($HD) Q4—HOME FIXES SPARK A SURGEHOME DEPOT ( NYSE:HD ) Q4—HOME FIXES SPARK A SURGE
(1/9)
Good afternoon, TradingView! Home Depot ( NYSE:HD ) is buzzing—$ 39.7B Q4 sales, up 14.1% 📈🔥. Extra week and SRS deal fuel zing—let’s unpack this retail giant! 🚀
(2/9) – REVENUE RUSH
• Q4 Sales: $ 39.7B—14.1% up from $ 34.8B 💥
• Full ‘24: $ 159.5B—4.5% rise from $ 152.7B 📊
• Boost: $ 4.9B from 14th week
NYSE:HD ’s humming—fixer-uppers unite!
(3/9) – EARNINGS GLOW
• Q4 EPS: $ 3.13—beats $ 3.03 est. 🌍
• Net: $ 3.0B—up from $ 2.8B 🚗
• Dividend: $ 2.30—up 2.2%, juicy 🌟
NYSE:HD ’s profit shines—steady cash!
(4/9) – BIG PLAYS
• SRS Buy: Pro segment zaps growth 📈
• Comp Sales: +0.8%—first up in 2 yrs 🌍
• Stores: 12 newbies—expansion zip 🚗
NYSE:HD ’s flexing—home king reigns!
(5/9) – RISKS IN VIEW
• Housing: Rates, $ 396.9K homes—yikes ⚠️
• Inflation: Wallets tighten—sting 🏛️
• Comp: Lowe’s nips—tight race 📉
Hot run—can it dodge the bumps?
(6/9) – SWOT: STRENGTHS
• Lead: $ 159.5B—top dog 🌟
• Comp: +0.8%, 7.6% trans. jump 🔍
• SRS: Pro cash flows—steady juice 🚦
NYSE:HD ’s a retail beast—rock solid!
(7/9) – SWOT: WEAKNESSES & OPPORTUNITIES
• Weaknesses: Housing drag—boo 💸
• Opportunities: Rate cuts, SRS lift—zing 🌍
Can NYSE:HD zap past the risks?
(8/9) – NYSE:HD ’s Q4 surge—what’s your vibe?
1️⃣ Bullish—Growth shines bright.
2️⃣ Neutral—Solid, risks hover.
3️⃣ Bearish—Housing stalls it out.
Vote below! 🗳️👇
(9/9) – FINAL TAKEAWAY
NYSE:HD ’s $ 39.7B Q4 and SRS spark zing—$ 159.5B year hums 🌍🪙. Premium P/E, but grit rules—gem or pause?

Home Depot Faces Uncertain 2025: Dips 2.20% in Premarket Home Depot (NYSE: NYSE:HD ) has set a cautious tone for 2025, forecasting a decline in annual profit and lower-than-expected same-store sales growth. The home improvement giant is grappling with weakened demand for big-ticket renovations as high borrowing costs and economic uncertainty weigh on consumer spending. Despite a strong holiday quarter, the company’s outlook has spooked investors, leading to a 2.20% drop in premarket trading on Tuesday.
Headwinds for Home Depot
Home Depot’s recent earnings report highlights shifting consumer behavior. While discount-driven promotions boosted holiday sales, the broader trend reflects a pullback in large-scale remodeling projects. Customers are opting for smaller repair and maintenance activities instead of major renovations due to persistent inflation and high financing costs.
The company expects fiscal 2025 adjusted earnings-per-share to decline by about 2%, starkly contrasting analysts' projection of a 4.6% growth. Annual comparable sales growth is forecasted at 1%, below the 1.7% analyst estimate. This weak outlook is further compounded by ongoing inflationary pressures and a volatile macroeconomic environment, with tariffs and federal spending cuts adding to consumer hesitancy.
Despite these concerns, Home Depot reported a surprise rise in same-store sales of 0.8% in Q4, breaking an eight-quarter losing streak. Customer transactions jumped 7.6%, suggesting continued engagement, albeit at a lower spending level. However, customer visits declined by 3% during the quarter, signaling potential weakness ahead.
Technical Analysis
From a technical standpoint, NYSE:HD is struggling to hold support levels. The stock was already oversold at Monday’s close, with a Relative Strength Index (RSI) of 32, indicating selling pressure. Tuesday’s 2.20% premarket dip has pushed the stock below its one-month low support level, raising concerns about further downside.
If bearish momentum persists, the next significant support level could be around $370. A break below this range may trigger additional selling pressure, leading to deeper corrections. On the upside, any recovery would need to push past resistance levels formed at the recent highs to signal a potential reversal.
Conclusion
Home Depot’s weaker-than-expected 2025 forecast underscores the broader economic slowdown and shifts in consumer spending habits. While the company saw a holiday sales boost, macroeconomic headwinds, inflation, and high borrowing costs continue to dampen demand for major home improvement projects.
From a technical perspective, the stock is at a critical juncture. With oversold conditions and broken support levels, investors should monitor the $370 range closely. Any further weakness could lead to a prolonged downtrend, while a recovery above key resistance levels would indicate renewed bullish sentiment.
As Home Depot navigates an uncertain economic landscape, the coming months will be crucial in determining whether it can stabilize and reclaim investor confidence.

Home Depot - time to build - 5% upside anyone?This one came in as a 60% probability of trade success and i see why.
Nothing is certain but here is the TA
Overview (HD 3H Chart)
Trend & Momentum:
Price is consolidating near 385, with recent lower highs suggesting a cautious bias. The 50/200 MAs hover above current levels (around 400–405), creating overhead resistance. Stoch RSI is in a lower region, hinting at a possible short-term bounce.
Key Levels:
• Immediate Support: 380–385
• First Resistance: 400–405
• Secondary Resistance: 417
Short-Term Trade (1–2 weeks)
• Bullish Setup: Buy on a break above 390, target 405. Stop ~385.
Success Probability: ~60% (assuming a bounce from current oversold conditions)
• Bearish Setup: Short on a close below 380, target 370. Stop ~385.
Success Probability: ~40%
Near-Term Outlook (2–4 weeks)
If price holds above 400, a push to 417 is plausible. Failure to reclaim 390 or a breakdown under 380 would likely extend downside pressure.
As always. This is not financial advice.

Home Depot sells CUPS with Handles Now?! 30%+ Move Inbound!When Did NYSE:HD Start Selling Cup w/ Handles? ☕️
Looks like NYSE:HD is introducing a new item for 2025 - the Cup with Handles! 🎉
I have a feeling this is going to be a BIG HIT! Just need to see XMAS RED➡️GREEN on the H5 Indicator before we go ahead and buy these new cups with handles.
I've added it to my watchlist and set an alert!
🎯$468
📏$532

Home Depot (HD) Analysis Company Overview:
Home Depot NYSE:HD , the largest home improvement retailer, leverages its extensive network of stores, robust e-commerce platform, and strategic acquisitions to maintain a dominant market position. The company continues to innovate and adapt to evolving consumer demands while capitalizing on macroeconomic trends.
Key Drivers of Growth:
Strategic Acquisition of SRS Distribution Inc.:
The acquisition enhances Home Depot’s market reach and diversifies its product offerings, particularly in specialty building materials.
This move is expected to drive revenue growth and profitability, strengthening its competitive position.
Projected Sales Growth:
Fiscal 2024 sales are projected to grow 3.8% year-over-year, showcasing Home Depot’s resilience and its ability to capitalize on consistent consumer demand for home improvement products.
Impact of Federal Reserve Rate Cuts:
Recent rate cuts are expected to stimulate housing activity, increasing demand for renovation and home improvement supplies, a key driver of Home Depot’s sales.
Strong Brand and Omni-Channel Presence:
Home Depot’s extensive store network and advanced e-commerce platform provide a seamless customer experience, offering resilience in both physical and digital retail markets.
The company’s reputation as a trusted supplier to both consumers and professionals enhances brand loyalty and repeat business.
Investment Outlook:
Bullish Stance: We are bullish on HD above $385.00-$390.00, supported by its strategic growth initiatives, favorable macroeconomic tailwinds, and robust operational performance.
Upside Target: Our price target is $570.00-$575.00, reflecting Home Depot’s strong growth potential and ability to navigate dynamic market conditions.
📈 Home Depot—Building the Future of Home Improvement! #HomeImprovement #GrowthStock #HD

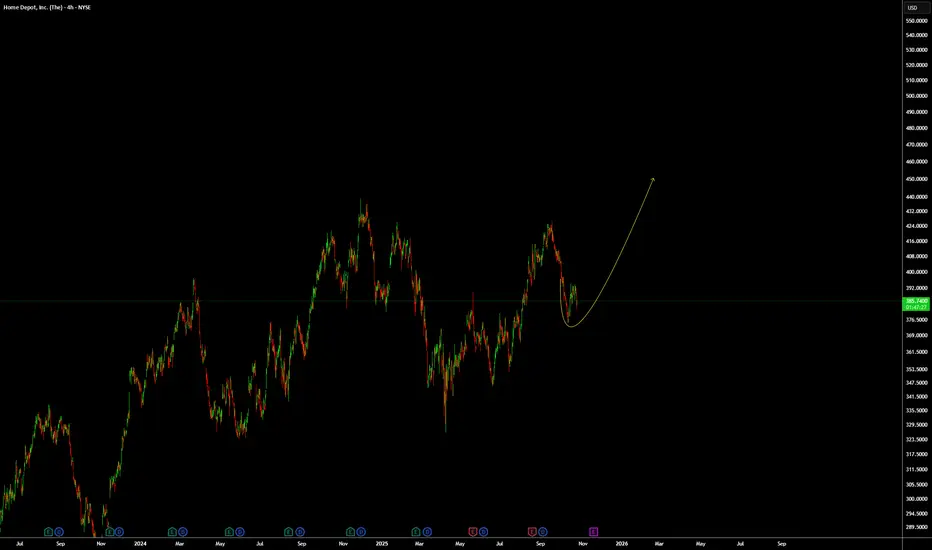
HOME DEPOT Consolidation then rally until end of the year.Home Depot (HD) hit our $415.00 long-term Target as called on our previous analysis 5 months ago (April 24, see chart below):
It doesn't show however any signs at all of stopping here as the Channel Up has still significant upside potential before it prices a Higher High on its top. Being on its 2nd Bullish Leg and approaching the 1.236 Fibonacci extension, it is possible to see a minor short-term pull-back and then a more structured rise until the end of the year.
This is at least the pattern that the 1st Bullish Leg of the Channel Up followed and is that helped us pursue the previous ($415) target in the first place. The 1W MACD also shows the strong similarities between the two Bullish Legs.
As a result, our new long-term Target is $460.00 (marginally below the 1.786 Fibonacci extension).
-------------------------------------------------------------------------------
** Please LIKE 👍, FOLLOW ✅, SHARE 🙌 and COMMENT ✍ if you enjoy this idea! Also share your ideas and charts in the comments section below! This is best way to keep it relevant, support us, keep the content here free and allow the idea to reach as many people as possible. **
-------------------------------------------------------------------------------
💸💸💸💸💸💸
👇 👇 👇 👇 👇 👇

NAIL: Entry, Volume, Target, StopEntry: above 177.44
Volume: above 566k
Target: 208.80 area (this is an area, no guarantees, you should be selling on the way up)
Stop: Depending on your risk tolerance; Based on an entry of 177.45, 167.00 gets you 3/1 Reward to Risk Ratio.
This LONG swing trade idea is not trade advice and is strictly based on my ideas and technical analysis. No due diligence or fundamental analysis was performed while evaluating this trade idea. Do not enter a trade based on my idea, do not follow anyone blindly, do your own analysis and due diligence. I am not a professional trader.

Home Depot (HD) potential Buy setupReasons for bullish bias:
- Price is at a strong support
- Safe Entry at LH breakout (DOW)
- Fib golden zone
- Bullish divergence
Here are the recommended trading levels:
Entry Level(Buy Stop): 351.00
Stop Loss Level: 319.53
Take Profit Level 1: 382.47
Take Profit Level 2: Open

Home Depot Set to Report Q2 Earnings Today: What to ExpectHome Depot (NYSE: NYSE:HD ), the largest home improvement retailer in the U.S., is set to report its Q2 2024 earnings on Tuesday, with analysts projecting slight declines in revenue and profit compared to the same period last year. With inflation impacting consumer spending, particularly on big-ticket home improvement projects, Home Depot (NYSE: NYSE:HD )is expected to see a modest dip in its financial performance. However, there are several key factors that investors should watch closely, which could influence the company's future outlook.
Earnings Expectations Amid Market Challenges
Analysts predict that Home Depot (NYSE: NYSE:HD ) will report $42.57 billion in revenue for the second quarter, a slight decrease from the $42.92 billion recorded in the same quarter of fiscal 2023. Similarly, net income is expected to fall to $4.48 billion, down from $4.66 billion a year ago. These declines reflect the broader economic environment, where inflation-weary consumers have cut back on discretionary spending, including home improvement projects.
Despite these challenges, Home Depot (NYSE: NYSE:HD ) has managed to maintain its position in the market. The company's ability to navigate a complex economic landscape, while still delivering solid financial results, underscores its resilience. However, the expected declines highlight the pressures that even industry giants face in the current environment.
SRS Distribution Acquisition
One of the most significant developments in Home Depot's recent history is its acquisition of SRS Distribution, a specialty distributor serving professional contractors in sectors such as roofing and pool markets. The $18.25 billion deal, which closed in June, is seen as a strategic move to bolster Home Depot's market share among professional contractors. This segment of the market is particularly important as big-ticket consumer spending slows.
By integrating SRS Distribution into its existing operations, Home Depot (NYSE: NYSE:HD ) aims to enhance its Pro sales ecosystem, providing a broader range of services to contractors. This acquisition not only increases Home Depot's market share but also positions the company to better weather the current economic challenges by focusing on a segment less affected by consumer spending fluctuations.
Technical Outlook
Home Depot stock (NYSE: NYSE:HD ) has exhibited mixed signals leading up to its Q2 earnings report. At the present time, it is trading at approximately $345.64 as of Monday, situating the stock below its five-, 20-, and 50-day exponential moving averages, indicating a strongly bearish trend. Nonetheless, indications of potential recovery have emerged. Notably, the stock price has exceeded both the 50-day SMA of $347.69 and the 200-day SMA of $344.19, signifying some underlying bullish potential. The stock has risen by 2.13% in Tuesday's premarket trading, marking a fresh start.
The Relative Strength Index (RSI) closed at 44.58 on Monday, signifying a sign of recovery.
Technical indicators, such as the Moving Average Convergence Divergence (MACD) and the Relative Strength Index (RSI), also suggest potential stabilization or recovery. The MACD indicator at 0.05 signals a buy, while the RSI of 44.53 indicates oversold stock. Additionally, the Bollinger Bands depict substantial buying pressure near the lower band, further reinforcing the potential for recovery.
Analysts' Outlook: Potential for Upside
Despite the current bearish trends, analysts remain cautiously optimistic about Home Depot's future. The consensus analyst rating on Home Depot stock stands at a Buy, with an average price target of $377.56, implying an 11.02% upside potential. Recent ratings from firms like Telsey Advisory Group, JP Morgan, and Truist Securities support this view, suggesting that Home Depot could see its stock price rise to around $385.33.
Conclusion
As Home Depot (NYSE: NYSE:HD ) prepares to release its Q2 2024 earnings, the company faces a challenging market environment characterized by inflation and reduced consumer spending. However, its strategic acquisition of SRS Distribution and focus on the professional contractor market provide a solid foundation for future growth. While the stock currently shows mixed signals, analysts believe there is potential for an upside, making Home Depot a company to watch closely in the coming months. Investors should pay attention to the earnings report and any guidance provided, as these will offer valuable insights into how Home Depot (NYSE: NYSE:HD ) plans to navigate the rest of the fiscal year.

The Home Depot Stock Embarks on Seasonal Bullish TrendThe Home Depot Inc. (HD) stock is entering a seasonal uptrend following the formation of a potential head and shoulders pattern at its recent bottom. This technical formation, often indicative of a reversal, has paved the way for a new bullish impulse, with the current price standing at $359.77.
Our analysis suggests a promising opportunity for a long position as the stock embarks on this upward trajectory. The bullish sentiment is further reinforced by the seasonal patterns historically observed in Home Depot's stock performance during this period. With this backdrop, we are closely monitoring the price action for a retest of the previous demand area at $354.13.
This demand area, which previously provided substantial support, is a critical level to watch. A successful retest and bounce from this zone would validate our bullish outlook and provide a favorable entry point for a long position. The target for this move extends through to September, aligning with the typical seasonal strength observed in Home Depot's stock.
The head and shoulders pattern observed at the bottom is a classic reversal signal, suggesting that the prior downtrend has likely concluded, and a new uptrend is underway. The recent bullish impulse from this pattern adds credence to the potential for continued upward movement.
Investors should consider the broader market environment and Home Depot’s fundamental strengths. As a leading retailer in the home improvement sector, Home Depot benefits from strong consumer demand, especially during the summer months when home improvement projects typically increase. Additionally, any positive economic indicators or consumer confidence data could further bolster the stock’s performance.
In conclusion, with Home Depot stock currently priced at $359.77 and showing signs of a seasonal bullish trend, we are preparing to open a long position on a retest of the $354.13 demand area. This strategy aims to capitalize on the anticipated bullish momentum through September, supported by the head and shoulders reversal pattern and historical seasonal trends. Investors should remain vigilant, keeping an eye on key support and resistance levels to make informed trading decisions.
✅ Please share your thoughts about HD in the comments section below and HIT LIKE if you appreciate my analysis. Don't forget to FOLLOW ME; you will help us a lot with this small contribution.

ETF Developers Buying Ahead of Q2 Earnings Reports: HDThis Dow component was the highest gainer for the average with a modest 2.10% gain yesterday. NYSE:HD price action was very controlled. Volume was slightly below average indicating it was likely ETF developers buying ahead of the earnings report.
Accumulation/Distribution indicator confirms this price range is a buy zone.
This is a technical setup to watch for pre-earnings runs for swing trading.

HD - Double Top DropDouble top at the red top horizontal
Could drop down to the dotted white line
I dont know if the green trend line will persist any longer
Daily chart

Conservative Investment Trend Trade HD LongMonthly Trend Trade
" + long impulse
+ 1/2 correction"
Daily Conservative Trend trade
"+ long impulse
+ 1/2 correction
+ ICE level
+ support level
+ biggest volume Sp"
Calculated affordable virtual stop loss
1 to 2 R/R take profit
Broker set up:
May-20-2024
Buy HD at Market (Day)
May-20-2024
OCO 3A: Sell HD Stop at $332.37 Limit at $337.86 (Good 'til Canceled)
May-20-2024
OCO 3B: Sell HD Limit at $348.84 (Good 'til Canceled)

HD, New long term base created, expect NEW PRICE GROWTH!NEW BASE created for new GROWTH.
With a company like HD with solid fundamentals -- this should be a no brainer be part of your portfolio.
KEY NOTES: MONTHLY DATA
HIGHER Lows on monthly data:
Double bottom rebound.
78.6 FIB level touch (bargain), currently bouncing off with precision.
Monthly descending trendline BREAK. Huge hint.
Massive net buying volume at current range.
Spotted at 310.
-------------------------------------------------------
*Something to factor in as well
Last earning calls May 2023
EARNINGS: 3.82
REVENUE : 37.25
Upcoming earning calls (expected) August 2023
EARNINGS: 4.44
REVENUE : 42.2
-------------------------------------------------------
TAYOR.
Safeguard capital always.
