HOOK/USDT Major Downtrend Breakout — Reversal in Play🔍 Chart Overview
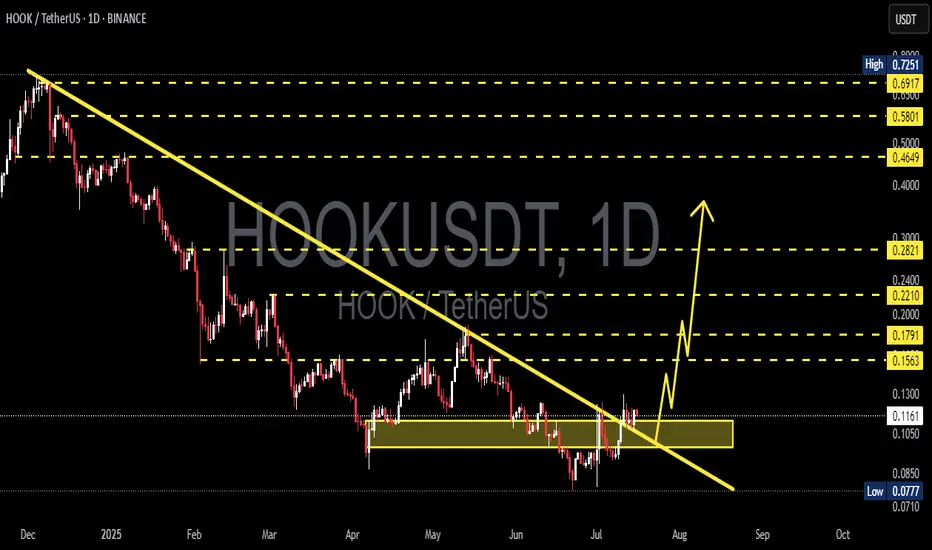
HOOK/USDT has finally broken out of its macro downtrend, which had been holding the price down since December 2024. This breakout is not just a technical move — it could mark the beginning of a mid- to long-term reversal. The price is now retesting the breakout area (yellow box), offering an ideal entry point before a potential rally.
📈 Pattern & Technical Structure
🟡 1. Breakout from Long-Term Downtrend
The yellow trendline shows a 7-month-long bearish trendline.
Price has now closed daily candles above this line, indicating a clear shift in market structure.
The breakout occurred after a sideways accumulation phase between $0.1050 – $0.1200, which also acts as a demand zone.
🟢 2. Inverse Head and Shoulders (IH&S) Pattern
Left and right shoulders formed around $0.1050
Head formed at the $0.0710 – $0.0777 zone
Price has broken above the neckline, validating the IH&S reversal pattern
📊 3. Volume & Momentum
Increased volume during the breakout confirms strong buying interest
If the retest holds, bullish momentum could accelerate toward key resistance levels
🟢 Bullish Scenario (Positive Outlook)
If price holds above the retest zone ($0.1167 – $0.1200) and confirms support:
Bullish Targets:
1. $0.1300 – Nearest minor resistance
2. $0.1563 – Breakout confirmation zone
3. $0.1791 – Psychological and fib confluence
4. $0.2210 – IH&S pattern target
5. $0.2821 – Key horizontal resistance
6. $0.4649 – $0.5801 – Golden pocket zone (Fibonacci retracement)
✅ Potential ROI: 100%+ from current levels
🔴 Bearish Scenario (Negative Outlook)
If HOOK fails to hold above $0.1050:
The breakout may become a false breakout (bull trap)
Price could fall back toward $0.0850
A deeper drop toward $0.0777 – $0.0710, the last major demand zone
🚫 Breakdown below this zone would re-enter a long consolidation phase
🎯 Conclusion & Strategy
HOOK is at a critical turning point. A confirmed breakout from the macro downtrend + IH&S pattern signals a high-probability bullish reversal. The current pullback serves as a textbook retest — a prime area for entries.
Aggressive traders can consider entering now with SL below $0.1050. Conservative traders may wait for confirmation candles above $0.1300.
✅ Quick Checklist:
✅ Confirmed breakout from macro downtrend
✅ Inverse Head and Shoulders pattern active
✅ Volume spike supports breakout
✅ Retest in progress at key demand zone
#HOOKUSDT #HookBreakout #CryptoReversal #AltcoinSeason #InverseHeadAndShoulders #TechnicalBreakout #CryptoAnalysis #ChartPattern #TradingSignals #HookAnalysis #BreakoutCrypto
Hookusdtanalysis
HOOKUSDT 1D AnalysisHOOK ~ 1D Analysis
#HOOK Buy gradually from here if you still have conviction in this coin, with a short-term target of at least 10%+ from this point.

HOOKUSDT Breakdown Incoming? Key Signals Point to Bearish Move!Yello, Paradisers! Is HOOKUSDT gearing up for a major drop? The current structure suggests a strong probability for further downside as the price follows a triple three-wave pattern within a descending channel.
💎HOOKUSDT recently faced strong resistance from multiple confluences: 50 EMA rejection, Key resistance zone, Descending channel’s trendline, Formation of an "M" pattern. These factors increase the likelihood of a wave Z move downward. However, for confirmation, we need a clear breakdown of the support level with a candle close below it and high volume.
💎The broader crypto market also leans bearish, but waiting for the actual breakdown will further strengthen our probability of a successful trade.
💎Invalidation? If the price bounces and closes candle above the resistance zone, the bearish outlook gets invalidated. In that case, it’s smarter to stay patient and wait for a stronger setup.
🎖 Discipline and patience are key, Paradisers! The market always rewards those who wait for the highest-probability trades. Stay sharp!
MyCryptoParadise
iFeel the success🌴

Is HOOK About to Bounce or Break? Critical Levels to watch!Yello, Paradisers! Are we on the verge of a bullish move with HOOKUSDT, or is a breakdown lurking around the corner? Let’s dive in!
💎HOOKUSDT is currently sitting at a key support zone, and the probability of a bullish bounce from this level is high. However, probabilities in trading are never guarantees, so here’s what you need to watch for to confirm the next move.
💎If we see a bullish I-CHoCH (Internal Change of Character) or classic bullish patterns like the W pattern or Inverse Head and Shoulders on lower timeframes, the chances of a bounce will increase significantly. These patterns indicate that buyers are stepping in at these critical levels.
💎We also need to watch TOTAL2 (the altcoin market cap excluding BTC) and TOTAL3 (altcoin market cap excluding BTC and ETH). These broader market indicators provide context for altcoin sentiment and help avoid making isolated decisions based solely on one chart. Remember, the crypto market moves as a system — you can’t ignore the bigger picture!
💎If the price breaks down and closes below this strong support zone, it will invalidate the entire bullish setup. In that case, waiting for more clear and confident price action before jumping in will be the smarter move. Chasing trades after a breakdown can lead to unnecessary losses, and patience is what separates professional traders from gamblers.
🎖 This is exactly why discipline and patience are your most powerful tools in this market. If the bounce comes, it could be highly profitable, but don’t let emotions drive your decisions if the price breaks down. Staying objective and waiting for confirmations is what makes long-term winners.
MyCryptoParadise
iFeel the success🌴

HOOKUSDT 6DHOOK ~ 6D
#HOOK This is the last support block for this coin. If you still have Conviction on this coin,. This support block would be a very good buying place for now,. Buy in stages with a minimum target of 20%+

Is HOOKUSDT Preparing for a Big Move? Don't Miss This Key MomentYello Paradisers! Have you noticed HOOKUSDT broken out of the resistance trendline recently? This could be the setup we've been waiting for 👀
💎HOOKUSDT has broken out of its resistance trendline, and after a consolidation, it's showing signs of a Cup & Handle pattern, with bullish divergence strengthening the case for a potential upward move.
💎If HOOKUSDT breaks out and closes a candle above the resistance zone, this will validate the pattern, significantly increasing the probability of a bullish reversal from here.
💎However, in case of a retracement, a bounce from the support zone is likely, but to increase our probability, we’d want to see a bullish I-CHoCH (Internal Change of Character).
💎If the price breaks down and closes candle below the support zone, it will invalidate our bullish setup. In that scenario, it’s better to wait for clearer, stronger price action before making any moves.
🎖Patience is key here. Whether we see a breakout or breakdown, it’s important to follow the strategy and wait for high-probability setups. Consistency, not impulse, is how you succeed in this game.
MyCryptoParadise
iFeel the success🌴
