#HOT/USDT is about to blast off! Study internet bubble stocks.#HOT
The price is moving in a descending channel on the 1-hour timeframe. It has reached the upper limit and is heading towards breaking downwards, with a retest of the upper limit expected.
We have an upward trend on the RSI indicator, which has reached near the upper limit, and a downward reversal is expected.
There is a major resistance zone in green at 0.000587. The price has bounced from this zone multiple times and is expected to bounce again.
We have a trend of consolidation above the 100-period moving average, as we are moving close to it, which supports a downward move towards touching it.
Entry price: 0.000540
First target: 0.000532
Second target: 0.000520
Third target: 0.000507
Stop loss: Above the resistance zone in green.
Don't forget a simple thing: capital management.
For inquiries, please leave a comment.
Thank you.
HOT

#HOT/USDT Ready to go up#HOT
The price is moving in a descending channel on the 1-hour timeframe. It has reached the lower boundary and is heading towards a breakout, with a retest of the upper boundary expected.
We are seeing a bearish trend in the Relative Strength Index (RSI), which has reached near the lower boundary, and an upward bounce is expected.
There is a key support zone in green at 0.000443, and the price has bounced from this level several times. Another bounce is expected.
We are seeing a trend towards stabilizing above the 100-period moving average, which we are approaching, supporting the upward trend.
Entry Price: 0.000478
First Target: 0.000492
Second Target: 0.000510
Third Target: 0.000534
Remember a simple principle: Money Management.
Place your stop-loss order below the green support zone.
For any questions, please leave a comment.
Thank you.

#HOT/USDT — Testing Demand Zone: Major Accumulation or Breakdo#HOT
The price is moving in a descending channel on the 1-hour timeframe. It has reached the lower boundary and is heading towards breaking above it, with a retest of the upper boundary expected.
We have a downtrend on the RSI indicator, which has reached near the lower boundary, and an upward rebound is expected.
There is a key support zone in green at 0.000490. The price has bounced from this zone multiple times and is expected to bounce again.
We have a trend towards consolidation above the 100-period moving average, as we are moving close to it, which supports the upward movement.
Entry price: 0.000517
First target: 0.000529
Second target: 0.000545
Third target: 0.000567
Don't forget a simple principle: money management.
Place your stop-loss below the support zone in green.
For any questions, please leave a comment.
Thank you.

VKTX Viking Therapeutics Exploding Higher TodayVKTX surges higher today after pulling back again near 200-day EMA. Not sure what the news is that's driving the big move higher. The news I did find talks about the following:
1) Viking Therapeutics completed a drug clinical trial stage earlier than expected last week
2) VKTX is on lists of hot stocks to buy for 2026 and could be a takeover, acquisition target
3) VKTX is recommended by 15 Wall Street Ranked analysis who give stock 12-month consensus average price target of $92
4) VKTX is on lists of stocks with high short interest (over 20% short interest) TO BUY because they are vulnerable to getting short-squeezed
Let's talk about the 4th item above. Just imagine VKTX continues to move higher on good news about clinical trials or possibly getting acquired by a larger company. This would push the stock even higher and will force traders who have big short positions on the stock to quickly cover, creating a snowball effect that frantically drives VKTX even higher and completely surges! This is reminiscent of what happened to Game Stop (GME) a few years back. I hope that this happens because I am long on several rather large call option positions on VKTX!
Whatever you all decide to do..... Good Luck!

#HOT/USDT — Testing Demand Zone: Major Accumulation or Breakdo#HOT
The price is moving in a descending channel on the 1-hour timeframe and is expected to break out and continue upwards.
We have a trend to stabilize above the 100-period moving average again.
We have a downtrend on the RSI indicator, which supports an upward move if it breaks above it.
We have a key support zone in green that pushed the price higher at 0.000561.
Entry price: 0.000592
First target: 0.000614
Second target: 0.000647
Third target: 0.000682
For risk management, don't forget stop-loss orders and capital management.
The stop-loss is below the support zone in green.
Upon reaching the first target, take some profits and then change the stop-loss order to an entry order.
For any questions, please comment.
Thank you.

HOT/USDT — Testing Demand Zone: Major Accumulation or Breakdown?📊 Overview
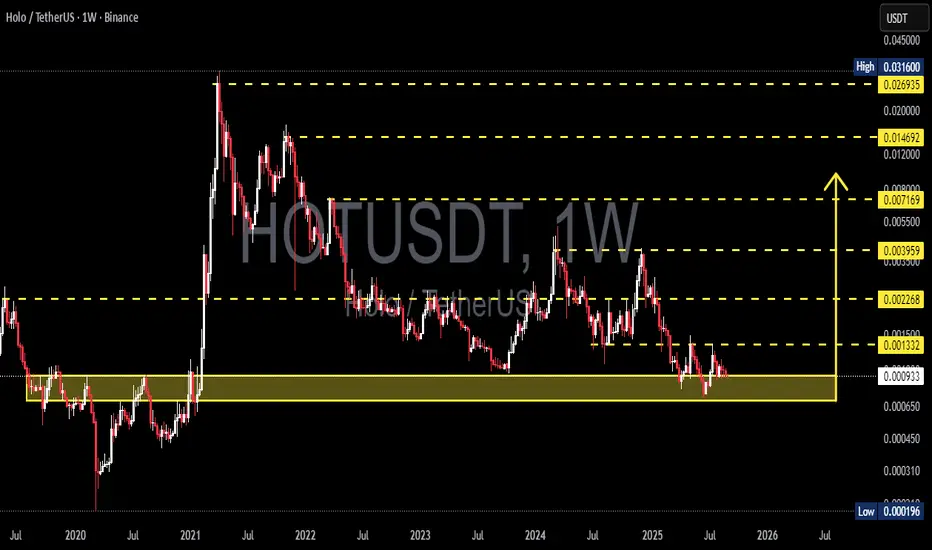
HOT (Holochain) is now trading at a multi-year demand zone that has been significant since 2019–2020. This zone is critical because:
1. It served as the launchpad for the massive 2021 rally.
2. It has been retested multiple times during extreme market downturns.
3. Price has returned to this area after more than 4 years — making it one of the most important levels in HOT’s price history.
In other words, the market is at a crossroads: will this demand zone trigger another rally, or finally break down and lead to new lows?
---
📌 Key Technical Levels
Current Price: ≈ 0.000932 USDT
Demand Zone (Historical Support): 0.00065 – 0.00120
Historical Low: 0.000196
Key Resistances:
R1: 0.001332
R2: 0.002268
R3: 0.003959
R4: 0.007169
R5: 0.014692
R6: 0.026935
R7 (ATH): 0.031600
---
📈 Bullish Scenario
1. A weekly close above the demand zone signals that buyers are still defending this key area.
2. A confirmed breakout and hold above 0.001332 would mark the first step of reversal.
3. Medium-term targets: 0.002268 → 0.003959.
4. Stronger breakouts could open the path toward 0.007169 and even 0.014+ in a broader bull cycle.
➡️ In this case, the current zone may represent a long-term accumulation opportunity with significant upside potential.
---
📉 Bearish Scenario
1. If HOT closes weekly below 0.00065, the demand zone collapses.
2. This breakdown could trigger capitulation with the next target around the historical low of 0.000196.
3. Such a move would confirm long-term distribution, with sellers fully in control.
➡️ Traders must be cautious, as the downside risk remains large if this critical support fails.
---
🌀 Structure & Patterns
Macro Trend: Bearish since the 2021 peak with consistent lower highs.
Current Setup: Range accumulation within the demand zone; potential triple bottom or re-accumulation if strong rejection occurs.
Confirmation Needed: Weekly close and volume reaction will determine whether this is accumulation or a breakdown.
---
📌 Conclusion
HOT is at one of its most crucial levels in 5 years.
Bullish case: demand zone holds → possible rebound with upside targets up to 0.003959 and beyond.
Bearish case: breakdown below 0.00065 → risk of capitulation toward 0.000196.
Key focus for traders/investors right now: Watch the weekly close + volume confirmation to validate the next move.
---
#HOT #HOTUSDT #Holo #Crypto #Altcoin #CryptoTrading #Accumulation #SupportResistance #TechnicalAnalysis
#HOT/USDT#HOT
The price is moving within an ascending channel on the 1-hour frame, adhering well to it, and is poised to break it strongly upwards and retest it.
We have support from the lower boundary of the ascending channel, at 0.00975.
We have a downtrend on the RSI indicator that is about to break and retest, supporting the upward move.
There is a key support area in green at 0.000965, which represents a strong basis for the upward move.
Don't forget one simple thing: ease and capital.
When you reach the first target, save some money and then change your stop-loss order to an entry order.
For inquiries, please leave a comment.
We have a trend of stability above the Moving Average 100.
Entry price: 0.001032
First target: 0.001086
Second target: 0.001140
Third target: 0.001205
Don't forget one simple thing: ease and capital.
When you reach the first target, save some money and then change your stop-loss order to an entry order.
For inquiries, please leave a comment.
Thank you.

#HOT/USDT#HOT
The price is moving within a descending channel on the 1-hour frame, adhering well to it, and is heading for a strong breakout and retest.
We are experiencing a rebound from the lower boundary of the descending channel. This support is at 000873.
We are experiencing a downtrend on the RSI indicator, which is about to break and retest, supporting the upward trend.
We are in a trend of consolidation above the 100 moving average.
Entry price: 0.000888
First target: 0.000910
Second target: 0.000933
Third target: 0.000958

HOT/USDT Breakout Confirmation or Bull Trap? Critical Retest!🧠 In-Depth Technical Breakdown (Daily Timeframe):
HOT/USDT (Holo vs Tether) is currently at a crucial inflection point, following a confirmed breakout from a long-standing downtrend. The price is now retesting a major demand zone, and how it reacts here will determine its next big move.
Let’s dive deeper into the technical structure, chart patterns, and the possible bullish and bearish scenarios:
---
🔻 1. Trend Structure & Major Breakout
Since peaking in late December 2024, HOT/USDT was trapped in a descending trendline (yellow diagonal line).
In mid-July 2025, price successfully broke above this downtrend, signaling a potential trend reversal.
This breakout suggests a shift in market sentiment from bearish to neutral-to-bullish.
---
🟨 2. Retesting the Key Demand Zone (Support Flip)
Price is currently testing a critical demand/support zone between 0.00090 – 0.00110 USDT (highlighted in the yellow box).
This area served as a major consolidation base in the past and is now being tested as support after the breakout.
A successful retest will validate the breakout and could spark a continuation to the upside.
---
📐 3. Chart Pattern: Falling Wedge Breakout
Price action clearly formed a Falling Wedge pattern, typically a bullish reversal setup.
The breakout from the wedge confirms bullish momentum and the potential start of a new trend.
---
🔮 4. Price Scenarios Moving Forward
✅ Bullish Scenario:
If the price holds above the 0.00090–0.00100 zone:
1. Potential upside targets:
TP1: 0.00134 (minor resistance)
TP2: 0.00147 (key structural level)
TP3: 0.00159 (breakout continuation zone)
TP4: 0.00229 – 0.00246 (historical range highs)
TP5: 0.00380 – 0.00407 (major highs from previous cycle)
2. This structure could mark the beginning of a higher low + higher high uptrend, if confirmed.
❌ Bearish Scenario:
If the price breaks below 0.00090 with strong volume:
1. Likely a return to previous support at:
0.00072 USDT (historical low and major support level).
2. This would invalidate the breakout and possibly confirm a bull trap, resuming the downtrend.
---
🧩 Other Key Technical Notes (Not Shown in Chart but Useful):
Volume: Look for high volume on the breakout and retest to confirm validity.
RSI/Divergence: Check for hidden or bullish divergence on the last swing low.
EMA 50/200: If price crosses or holds above these EMAs, it adds further confirmation of trend reversal.
---
📊 Summary & Trading Strategy:
HOT/USDT is in a critical phase of retesting a major breakout, offering traders a great opportunity to either buy the dip or wait for confirmation.
Suggested Strategy:
Conservative Entry: Wait for a bullish candle close above 0.00100 with strong rejection from the support zone.
Aggressive Entry: Buy near 0.00090–0.00100 with a tight stop loss below 0.00087.
Use resistance levels for scaling out profits or setting targets.
#HOTUSDT #HoloToken #AltcoinAnalysis #CryptoBreakout #TechnicalAnalysis #ChartPattern #BullishReversal #FallingWedge #SupportZone #CryptoTA

#HOT/USDT#HOT
The price is moving within a descending channel on the 1-hour frame and is expected to break and continue upward.
We have a trend to stabilize above the 100 moving average once again.
We have a downtrend on the RSI indicator that supports the upward move with a breakout.
We have a support area at the lower boundary of the channel at 0.000945, acting as strong support from which the price can rebound.
Entry price: 0.000948
First target: 0.000984
Second target: 0.000998
Third target: 0.001020

HOTUSDT 1W AnalysisHOT ~ 1W Analysis
#HOT Buy gradually from here if you still have confidence in this coin with a short term target of at least 20%+ from this support block.

#HOT/USDT#HOT
The price is moving within a descending channel on the 1-hour frame, adhering well to it, and is heading for a strong breakout and retest.
We are seeing a bounce from the lower boundary of the descending channel, which is support at 0.001240.
We have a downtrend on the RSI indicator that is about to be broken and retested, supporting the upward trend.
We are looking for stability above the 100 moving average.
Entry price: 0.001346
First target: 0.001415
Second target: 0.001500
Third target: 0.001607

#HOT/USDT#HOT
The price is moving within a descending channel on the 1-hour frame, adhering well to it, and is on its way to breaking it strongly upwards and retesting it.
We are seeing a bounce from the lower boundary of the descending channel, this support at 0.01018.
We have a downtrend on the RSI indicator that is about to break and retest, supporting the upward trend.
We are looking for stability above the 100 moving average.
Entry price: 0.01086
First target: 0.001118
Second target: 0.001155
Third target: 0.001200

HOTUSDT Analysis D1HOTUSDT Horizontal Resistance Breakout & Retest Confirmed, Now Holochain Need To Break Descending Channel To Lead Solid Recovery, Expecting 150% Rally After Successful Breakout

HOTUSDT 1D AnalysisHOT ~ 1D Analysis
#HOT Buy after successfully penetrating this resistant line with a short -term target of at least 10%+ from here.

HOTUSDT 1WHOT ~ 1W Analysis
#HOT Buy gradually from here if you still have a Conviction on this coin with a short -term target of at least 20%+.

#HOT/USDT#HOT
The price is moving in a descending channel on the 1-hour frame and is adhering to it well and is heading to break it strongly upwards and retest it
We have a bounce from the lower limit of the descending channel, this support is at a price of 0.001065
We have a downtrend on the RSI indicator that is about to break and retest, which supports the rise
We have a trend to stabilize above the moving average 100
Entry price 0.001148
First target 0.001194
Second target 0.0001255
Third target 0.001320

HOTUSDT 1WHOT ~ 1W Analysis
#HOT This support has been maintained so far. Buy from here if you still have a Conviction on this coin with a minimum target of 20%+

#HOT/USDT#HOT
The price is moving in a descending channel on the 1-hour frame and is expected to continue upwards
We have a trend to stabilize above the moving average 100 again
We have a descending trend on the RSI indicator that supports the rise by breaking it upwards
We have a support area at the lower limit of the channel at a price of 0.001950
Entry price 0.002000
First target 0.002107
Second target 0.002210
Third target 0.002346

Trading opportunity for HOTUSDTBased on technical factors there is a Buy position in :
📊 HOTUSDT
🔵 Buy Now
🪫Stop loss 0.001800
🔋Target 0.002500
📏 R/R 3
💸RISK : 1%
We hope it is profitable for you ❤️
Please support our activity with your likes👍 and comments📝

HOTUSDT 1WHOT ~ 1W
#HOT If you still have Conviction on this coin,. This support block would be a very good buying place for now,. Buy in stages with a target of 20%+

HOT-4h - Ascending triangle in progresHOT-4h - Ascending triangle in progres
REMEMBER that a lot of investors sell stocks or crypto for fiscal conditions in 2024 to close the year.
For that, we have low buy liquidity , and even with that pressure on the price , HOT is trying to remain in the same range as 1 week ago, so a breakout can restart a new HH , so patience.
Im bullish on it if the 0.0027usd resistance its broken and became a support.

#HOT (SPOT) entry ( 0.0019- 0.0024) T.(0.0083) SL(0.001835)BINANCE:HOTUSDT
#HOT/ USDT
Entry ( 0.0019- 0.0024)
SL 1D close below 0.001835
T1 0.0036
T2 0.0061
T3 0.0083
1 Extra Targets(optional) in chart, if you like to continue in the trade with making stoploss very high.
______________________________________________________________
Golden Advices.
********************
* collect the coin slowly in the entry range.
* Please calculate your losses before the entry.
* Do not enter any trade you find it not suitable for you.
* No FOMO - No Rush , it is a long journey.
Useful Tags.
****************
My total posts
www.tradingview.com
1Million Journey
www.tradingview.com
www.tradingview.com
**********************************************************************************************
#Manta #OMNI #DYM #AI #IO #XAI #ACE #NFP #RAD #WLD #ORDI #BLUR #SUI #VOXEL #AEVO #VITE #APE #RDNT #FLUX #NMR #VANRY #TRB #HBAR #DGB #XEC #ERN #ALT #IO #ACA #HIVE #ASTR #ARDR #PIXEL #LTO #AERGO #SCRT #ATA #HOOK #FLOW #KSM #HFT #MINA #DATA #SC #JOE #RDNT #IQ #CFX #BICO #CTSI #KMD #FXS #DEGO #FORTH #AST #PORTAL #CYBER #RIF #ENJ #ZIL #APT #GALA #STEEM #ONE #LINK #NTRN #COTI #RENDER #ICX #IMX #ALICE #PYR #PORTAL #GRT #GMT #IDEX #NEAR #ICP #ETH #QTUM #VET #QNT #API3 #BURGER #MOVR #SKL #BAND #ETHFI #SAND #IOTX #T #GTC #PDA #GMX #REZ #DUSK #BNX #SPELL #POWR #JOE #TIA #TFUEL #HOT
