HOT/USDT – Descending Trendline, Breakdown or Reversal Ahead?The HOT/USDT pair on the 2D timeframe remains in a long-term downtrend since the late-2024 peak. Price continues to form lower highs and lower lows, confirming strong seller dominance. Currently, price is consolidating after a sharp decline, positioned just below the major descending trendline.
---
Pattern Explanation
The chart clearly shows a Descending Trendline (Bearish Market Structure) that has been tested multiple times since early 2025 and has not been broken with valid confirmation.
Pattern characteristics:
A downward-sloping trendline originating from the major distribution high.
Each rebound fails to create a higher high.
Consolidation occurs below the trendline, indicating a bearish continuation structure.
Additional structure:
A tight range formed between 0.000665 – 0.000805
This reflects price compression, which often precedes an impulsive move (breakout or breakdown).
---
Key Levels
Resistance (Supply Zone):
0.000665
0.000805
0.001035
0.001300
Support (Demand Zone):
0.000544 (current area)
0.000430
0.000339 (major low)
---
Bullish Scenario
The bullish scenario is counter-trend and only valid with strong confirmation.
Bullish requirements:
1. Price breaks and closes above the descending trendline
2. Follow-through candles hold above 0.000665
3. Ideally supported by increasing volume
Bullish targets:
0.000805
0.001035
0.001300
Note:
As long as price remains below the trendline, any upside move should be considered a relief rally, not a full trend reversal.
---
Bearish Scenario
This remains the primary high-probability scenario based on current structure.
Bearish confirmation:
1. Rejection from the descending trendline
2. Breakdown below 0.000544 support
3. Strong candle close beneath the consolidation range
Downside targets:
0.000430
0.000339 (previous low / strong demand zone)
If 0.000339 fails, HOT may enter an extended accumulation or capitulation phase.
---
Conclusion
HOT/USDT is still trading within a bearish market structure with dominant selling pressure. The current consolidation sits directly below the descending trendline, making this zone extremely critical.
Traders are advised to:
Wait for confirmation before considering bullish entries
Respect bearish continuation as long as price stays below key resistance
Discipline and confirmation remain essential.
#HOTUSDT #HOLO #CryptoAnalysis #TechnicalAnalysis #BearishTrend #DescendingTrendline #AltcoinMarket #SupportResistance #PriceAction
Hotusdtanalysis

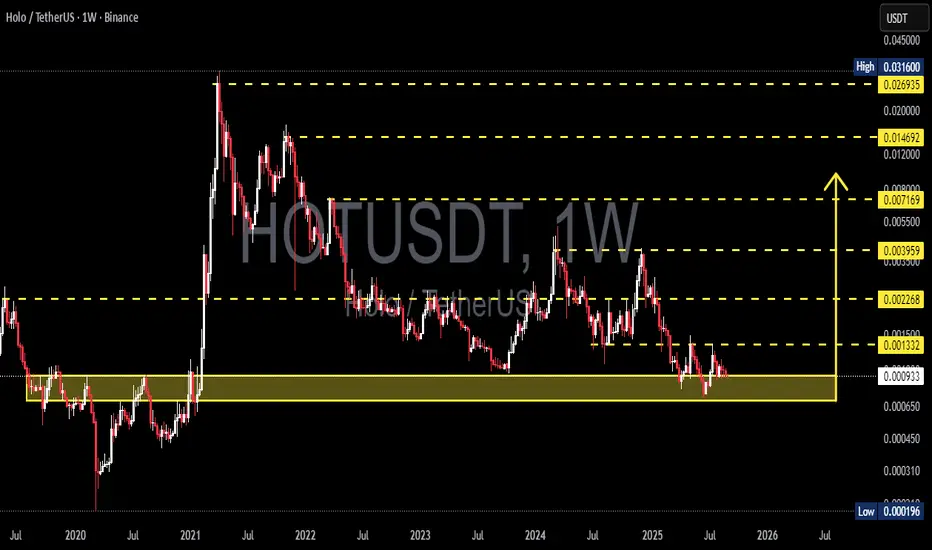
HOT/USDT — Testing Demand Zone: Major Accumulation or Breakdown?📊 Overview
HOT (Holochain) is now trading at a multi-year demand zone that has been significant since 2019–2020. This zone is critical because:
1. It served as the launchpad for the massive 2021 rally.
2. It has been retested multiple times during extreme market downturns.
3. Price has returned to this area after more than 4 years — making it one of the most important levels in HOT’s price history.
In other words, the market is at a crossroads: will this demand zone trigger another rally, or finally break down and lead to new lows?
---
📌 Key Technical Levels
Current Price: ≈ 0.000932 USDT
Demand Zone (Historical Support): 0.00065 – 0.00120
Historical Low: 0.000196
Key Resistances:
R1: 0.001332
R2: 0.002268
R3: 0.003959
R4: 0.007169
R5: 0.014692
R6: 0.026935
R7 (ATH): 0.031600
---
📈 Bullish Scenario
1. A weekly close above the demand zone signals that buyers are still defending this key area.
2. A confirmed breakout and hold above 0.001332 would mark the first step of reversal.
3. Medium-term targets: 0.002268 → 0.003959.
4. Stronger breakouts could open the path toward 0.007169 and even 0.014+ in a broader bull cycle.
➡️ In this case, the current zone may represent a long-term accumulation opportunity with significant upside potential.
---
📉 Bearish Scenario
1. If HOT closes weekly below 0.00065, the demand zone collapses.
2. This breakdown could trigger capitulation with the next target around the historical low of 0.000196.
3. Such a move would confirm long-term distribution, with sellers fully in control.
➡️ Traders must be cautious, as the downside risk remains large if this critical support fails.
---
🌀 Structure & Patterns
Macro Trend: Bearish since the 2021 peak with consistent lower highs.
Current Setup: Range accumulation within the demand zone; potential triple bottom or re-accumulation if strong rejection occurs.
Confirmation Needed: Weekly close and volume reaction will determine whether this is accumulation or a breakdown.
---
📌 Conclusion
HOT is at one of its most crucial levels in 5 years.
Bullish case: demand zone holds → possible rebound with upside targets up to 0.003959 and beyond.
Bearish case: breakdown below 0.00065 → risk of capitulation toward 0.000196.
Key focus for traders/investors right now: Watch the weekly close + volume confirmation to validate the next move.
---
#HOT #HOTUSDT #Holo #Crypto #Altcoin #CryptoTrading #Accumulation #SupportResistance #TechnicalAnalysis
HOT/USDT Breakout Confirmation or Bull Trap? Critical Retest!🧠 In-Depth Technical Breakdown (Daily Timeframe):
HOT/USDT (Holo vs Tether) is currently at a crucial inflection point, following a confirmed breakout from a long-standing downtrend. The price is now retesting a major demand zone, and how it reacts here will determine its next big move.
Let’s dive deeper into the technical structure, chart patterns, and the possible bullish and bearish scenarios:
---
🔻 1. Trend Structure & Major Breakout
Since peaking in late December 2024, HOT/USDT was trapped in a descending trendline (yellow diagonal line).
In mid-July 2025, price successfully broke above this downtrend, signaling a potential trend reversal.
This breakout suggests a shift in market sentiment from bearish to neutral-to-bullish.
---
🟨 2. Retesting the Key Demand Zone (Support Flip)
Price is currently testing a critical demand/support zone between 0.00090 – 0.00110 USDT (highlighted in the yellow box).
This area served as a major consolidation base in the past and is now being tested as support after the breakout.
A successful retest will validate the breakout and could spark a continuation to the upside.
---
📐 3. Chart Pattern: Falling Wedge Breakout
Price action clearly formed a Falling Wedge pattern, typically a bullish reversal setup.
The breakout from the wedge confirms bullish momentum and the potential start of a new trend.
---
🔮 4. Price Scenarios Moving Forward
✅ Bullish Scenario:
If the price holds above the 0.00090–0.00100 zone:
1. Potential upside targets:
TP1: 0.00134 (minor resistance)
TP2: 0.00147 (key structural level)
TP3: 0.00159 (breakout continuation zone)
TP4: 0.00229 – 0.00246 (historical range highs)
TP5: 0.00380 – 0.00407 (major highs from previous cycle)
2. This structure could mark the beginning of a higher low + higher high uptrend, if confirmed.
❌ Bearish Scenario:
If the price breaks below 0.00090 with strong volume:
1. Likely a return to previous support at:
0.00072 USDT (historical low and major support level).
2. This would invalidate the breakout and possibly confirm a bull trap, resuming the downtrend.
---
🧩 Other Key Technical Notes (Not Shown in Chart but Useful):
Volume: Look for high volume on the breakout and retest to confirm validity.
RSI/Divergence: Check for hidden or bullish divergence on the last swing low.
EMA 50/200: If price crosses or holds above these EMAs, it adds further confirmation of trend reversal.
---
📊 Summary & Trading Strategy:
HOT/USDT is in a critical phase of retesting a major breakout, offering traders a great opportunity to either buy the dip or wait for confirmation.
Suggested Strategy:
Conservative Entry: Wait for a bullish candle close above 0.00100 with strong rejection from the support zone.
Aggressive Entry: Buy near 0.00090–0.00100 with a tight stop loss below 0.00087.
Use resistance levels for scaling out profits or setting targets.
#HOTUSDT #HoloToken #AltcoinAnalysis #CryptoBreakout #TechnicalAnalysis #ChartPattern #BullishReversal #FallingWedge #SupportZone #CryptoTA

HOTUSDT 1W AnalysisHOT ~ 1W Analysis
#HOT Buy gradually from here if you still have confidence in this coin with a short term target of at least 20%+ from this support block.

HOTUSDT 1D AnalysisHOT ~ 1D Analysis
#HOT Buy after successfully penetrating this resistant line with a short -term target of at least 10%+ from here.

HOTUSDT 1WHOT ~ 1W Analysis
#HOT Buy gradually from here if you still have a Conviction on this coin with a short -term target of at least 20%+.

HOTUSDT 1WHOT ~ 1W Analysis
#HOT This support has been maintained so far. Buy from here if you still have a Conviction on this coin with a minimum target of 20%+

Holochain targets for this yearPossible Targets and explanation idea
➡️Cuz all noise and open Weekly chart. Trader over 330 days in sideways in -0.27 zone
➡️-0.27 zone always play out like accumulation zones. Higher timeframe more important zone
➡️Trade under fundamental price (real value) based on Take profit indicator.
➡️Take profit now at 0 level by fib 0.0082 where we will see rejection for the first time
➡️All lines are dynamic.
Hope you enjoyed the content I created, You can support with your likes and comments this idea so more people can watch!
✅Disclaimer: Please be aware of the risks involved in trading. This idea was made for educational purposes only not for financial Investment Purposes.
---
• Look at my ideas about interesting altcoins in the related section down below ↓
• For more ideas please hit "Like" and "Follow"!

HOTUSDT 1WHOT ~ 1W
#HOT If you still have Conviction on this coin,. This support block would be a very good buying place for now,. Buy in stages with a target of 20%+

HOTUSDT Idea | LongHOTUSDT Technical Analysis
The BINANCE:HOTUSDT HOTUSDT price has recently broken out bullishly from a descending trendline. Following this breakout, the price is experiencing a correction towards the $0.002350 support level.
It is anticipated that the price will find support at this level and resume its upward trajectory. The first target for this uptrend is projected to be around $0.002615. The final price target is in the vicinity of $0.002750.
Trading Recommendation:
It is recommended to enter a long position after the price surpasses the $0.002500 level, confirming the upward momentum after the correction and bounce back from the support.
Summary:
Breakout: Bullish breakout from downtrend
Correction: Currently correcting towards $0.002350
Support: $0.002350
Target 1: $0.002615
Target 2: $0.002750
Entry: Above $0.002500
Disclaimer: This analysis is for informational purposes only and should not be considered as financial advice. Trading cryptocurrencies involves significant risk, and it is crucial to conduct your own research and consult with a financial advisor before making any investment decisions.

HOTUSDTHOT ~ 1W
#HOT demand zone that you might need to pay attention to to start buying if you have Conviction on this NASDAQ:COIN

HOTUSD 1WHOT ~ 1W
#HOT Retesting this Support Line has been successful.
Make purchases gradually starting from here. The bulls will start to push the price to continue rising.

HOTUSD 1WLSE:HOT ~ 1W
#HOT Successfully Breaking this Resistance Line, Bulls Seem to be Taking Control, Buy Gradually from Here, Target at least 20%++

Trading opportunity for HOTUSDT HoloBased on technical factors there is a Long position in :
📊 HOTUSDT
🔵 Long Now 0.001557
🧯 Stop loss 0.001368
🏹 Target 1 0.001780
🏹 Target 2 0.002020
🏹 Target 3 0.002390
💸RISK : 1%
We hope it is profitable for you ❤️
Please support our activity with your likes👍 and comments📝

Hot usdt forecat/ideaPlease write any comments or suggestions.
Dear friends, request any cryptocurrency or forex indices that you want to be analyzed.
Thanks for your attention

$HOLO is Very Hot, Here's My Trade Idea,Buy Zone & Targets $HOT Hey Traders,
Here's my trade Idea for $HOT #Holochain
Buy Zone Between $0.00435~$0.00408
OR Buy with a stoplimit Order at $0.0049
StopLoss: 1 Day Close Below 0.003666
Targets Are:
$0.005656 ~ $0.005858
$0.006363 ~ $0.006565
I suggest using an OCO Buy order if you're using Binance.
NFA, DYOR, and Good luck.
Let Me know what do you think in the comment? press that like button to show support!
Remember, NEVER use more than 5% on any trade, and Always use a STOPLOSS.

HOTUSDT Analysis (LOCAL VISION)Hello friends.
Please support my work by clicking the LIKE button👍(If you liked). Also i will appreciate for ur activity. Thank you!
Everything on the chart.
Entry: market and lower
Target: 0.0055 - 0.0063 - 0.0072
Stop: ~0.0037 (depending of ur risk). ALWAYS follow ur RM .
after first target reached move ur stop to breakeven
Risk/Reward: 1 to 4
risk is justified
Good luck everyone!
Follow me on TRADINGView, if you don't want to miss my next analysis or signals.
It's not financial advice.
Dont Forget, always make your own research before to trade my ideas!
Open to any questions and suggestions.

HOTUSDT WAVE Analysis (GLOBAL VISION)Hello friends.
Please support my work by clicking the LIKE button👍 (If you liked).Thank you!
Everything on the chart.
Globally we're in double zigzag (wxy) wave of (IV).
Waiting for an upward movement either from the current price, or through a small update of the last low (will depend on #BTC).
Entry: market and lower
MAIN TARGET ZONE AT THE END OF BULL RUN: 0.035 - 0.045$
Stop: (depending of ur risk). ALWAYS follow ur RM .
cancellation of growth,consolidation below ~0.001$
Risk is justified.
Good luck everyone!
Follow me on TRADINGView, if you don't want to miss my next analysis or signals.
It's not financial advice.
Dont Forget, always make your own research before to trade my ideas!
Open to any questions and suggestions.

HOT about to MAKE A BIG MOVE!Hello, I am back with an idea on HOTUSDT pair, time frame 1 day. HOT for an entire year has been following a descending triangle for an entire year now that has held a strong support in the area between 0.004-0.0045. This pattern very soon can trigger a big movement, either a reversal or a follow up to the downtrend. But at the moment, to me it looks as a good entry either way following the trade with a SL in the area below 0.004.
1st Scenario - it is usually the scenario I think has more chances of happening. Looking at the daily RSI, the pattern feels ready for a small breakout of the falling wedge leading to a near 100% (dependable on the entire market movement) as generally I see a small bullish trend near March for most coins(likely altcoins). This move could be followed by a 300% move from where we are now if it break the triangle. Always look for breakout areas out of the pattern.
2nd scenario- BTC is following up with my analysis which I expect one last drop. Due to that drop, a fakeout can happen and a wick can be see formed lower than the support. However I see HOT not going lower than 0.003, and if we lose that no lower than 0.002 and from there a consolidation could take place. And then HOT can enter the triangle again.
A reminder, follow the breakout areas in either sides, but most likely we will see a huge breakout or wick very soon as the volume indicates that too. If you have any comment, you are welcome.
Trade safe, trade smart, and always use SL during this time. :)

HOTUSDT Analysis (HUGE BULLISH POTENTIAL)Hello friends.
Please support my work by clicking the LIKE button👍(If you liked). Also i will appreciate for ur activity. Thank you!
Everything on the chart.
Nothing has changed from my last idea.
Entry: market and lower
Target: 0.013 - 0.018 - 0.022
after first target reached move ur stop to breakeven
Stop: (depending of ur risk). ALWAYS follow ur RM .
cancellation of growth, consolidation below 0.0043
Risk/Reward: 1 to 10
risk is justified
Good luck everyone!
Follow me on TRADINGView, if you don't want to miss my next analysis or signals.
It's not financial advice.
Dont Forget, always make your own research before to trade my ideas!
Open to any questions and suggestions.

HOTUSDT Analysis (x2 potential from here)Hello friends.
Please support my work by clicking the LIKE button(If you liked).Thank you!
Everything on the chart.
open pos: market and lower
target: 0.013 - 0.018 - 0.022
after first target reached move ur stop to breakeven
cancellation of growth, consolidation below 0.005
stop: im w/o stop (depending of ur risk). ALWAYS follow ur RM .
risk is justified
Good luck everyone!
Follow me on TRADINGView, if you don't want to miss my next analysis or signals.
It's not financial advice.
Dont Forget, always make your own research before to trade my ideas!

HOTUSDT AnalysisHello friends.
Please support my work by clicking the LIKE button(If you liked).Thank you!
Everything on the chart.
open pos: market and lower
target: 0.015 - 0.018 - 0.02
after first target reached move ur stop to breakeven
stop: ~under 0.01(depending of ur risk). ALWAYS follow ur RM .
risk/reward 1 to 3
risk is justified
Good luck everyone!
Follow me on TRADINGView, if you don't want to miss my next analysis or signals.
It's not financial advice.
Dont Forget, always make your own research before to trade my ideas!
Open to your questions or suggestions.

Holochain (HOT) looking to explode soonAnalysis of HOT/USDT chart. MACD indicator is starting to show positive momentum being built. RSI indicator shows how we have broke a downtrend while being positioned at a good mid-level of about 53%, ready to take off. If we break the downtrend on the daily chart, big green candles would be printed really fast in my opinion. Let's see what time will tell us.
Take Profit Levels (TPs):
1st = $0.01650
2nd = $0.02825
3rd = $0.03160
