Learn the Significance of Psychological Levels and Round Numbers
When traders analyze the key levels, quite often then neglect the psychological levels in trading.
In this article, we will discuss what are the psychological levels and how to identify them.
What is Psychological Level?
Let's start with the definition.
Psychological level is a price level on a chart that has a strong significance for the market participants due to the round numbers.
By the round numbers, I imply the whole numbers that are multiples of 5, 10, 100, etc.
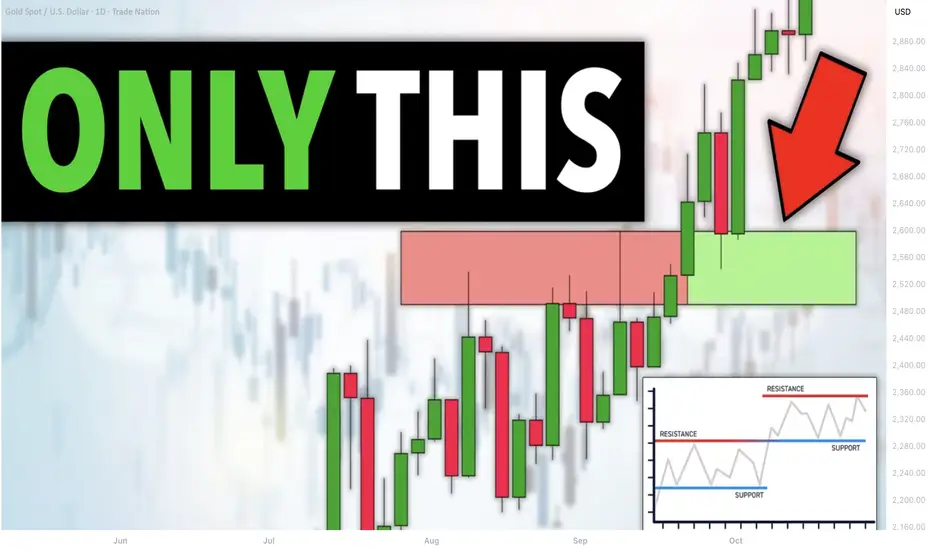
These levels act as strong supports and resistances and the points of interest of the market participants.
Take a look at 2 important psychological levels on EURGBP: 0.95 and 0.82. As the market approached these levels, we saw a strong reaction of the price to them.
Why Psychological Levels Work?
And here is why the psychological levels work:
Research in behavioral finance has shown that individuals exhibit a tendency to anchor their judgments and decisions to round numbers.
Such a decision-making can be attributed to the cognitive biases.
Quite typically, these levels act as reference points for the market participants for setting entry, exit points and placing stop-loss orders.
Bad Psychological Levels?
However, one should remember that not all price levels based on round numbers are significant.
When one is looking for an important psychological level, he should take into consideration the historical price action.
Here are the round number based levels that I identified on AUDUSD on a weekly time frame.
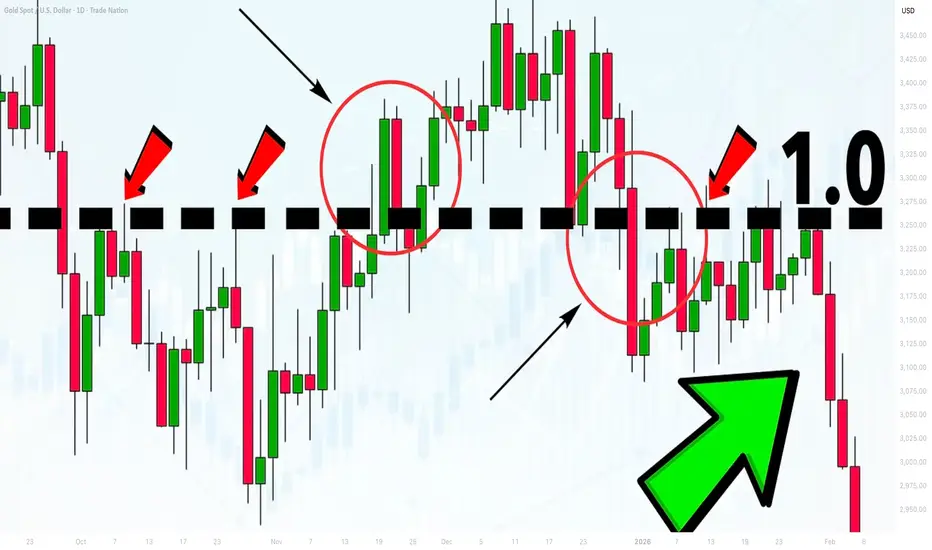
After all such levels are underlined, check the historical price action and make sure that the market reacted to that at least one time in the recent past.
With the circles, I highlighted the recent reaction to the underlined levels. Such ones we will keep on the chart, while others should be removed.
Here are the psychological levels and proved their significance with a recent historical price action.
From these levels, we will look for trading opportunities.
Market Reaction to Psychological Levels
Please, note that psychological levels may trigger various reactions of the market participants.
For instance, a price approaching a round number may trigger feelings of greed, leading to increased selling pressure as traders seek to lock in profits.
Alternatively, a breakout above/below a psychological level can trigger buying/selling activity as traders anticipate further price momentum.
For that reason, it is very important to monitor the price action around such levels and look for confirmations.
Learn to identify psychological levels. They are very powerful and for you, they can become a source of tremendous profits.
❤️Please, support my work with like, thank you!❤️
I am part of Trade Nation's Influencer program and receive a monthly fee for using their TradingView charts in my analysis.
Howtofindkeylevels
5 Elements of the Best Key Level in Forex, Gold Trading
What are the best key levels to trade?
This year I analyzed more than 1500 key structures on Forex, Gold, Crypto and Indexes.
In the today's article, I prepared for you a list of 5 elements of a perfect support and resistance for trading.
As always, remember that the best key levels are always on a daily time frame . So all the structures that we will discuss will be strictly on a daily .
Also, all the structures that I analyzed and traded are available on my TradingView page, so you can back test them by your own.
1. Clear historical significance
The structure that you spotted should act as a significant historical support or resistance.
Here are the important historical support and resistance that I spotted on USDCAD on a daily time frame.
2. Psychological significance
The structure that you identified should match with round numbers.
All the structures that we spotted on USDCAD match with psychological numbers.
3. Confluence with other technical tools
The best structure should align with other trading tools such as trend lines or Fibonacci levels , strengthening its significance.
After adding fibonacci levels and a significant falling trend line on the chart, the confluence was found in Resistance 6, Resistance 3, Resistance 2, Resistance 1, Support 2. Other structure does not match with technical tolls.
4. Volume
The level experiences high trading volumes, indicating strong participation and interest from market participants, especially smart money.
All the structures that we underlined show significant volume spikes. By volume spike, I mean a volume being higher than the average volume - a blue curve on volume.
5. Multiple touches
The more, the better. There are numerous instances where price has respected and reacted to the structure, confirming its strength (at least 2).
Only these 3 structures were confirmed by the multiple touches. These resistances will be considered the strongest ones.
That checklist will help you to identify the most significant structures from where you will be able to catch impulsive movement and make nice profits.
❤️Please, support my work with like, thank you!❤️
I am part of Trade Nation's Influencer program and receive a monthly fee for using their TradingView charts in my analysis.