How to Find Order Block on Any Forex Pair & Gold (SMC Basics)
Order block is easier to find than you think.
I am going to reveal 2 simple price models that will help you find strong bullish and bearish order block zones on any Forex pair.
Discover how to identify OB and how to draw it properly in Smart Money Concepts SMC trading.
To effectively spot Order Block, you will need to learn basic Structure Mapping.
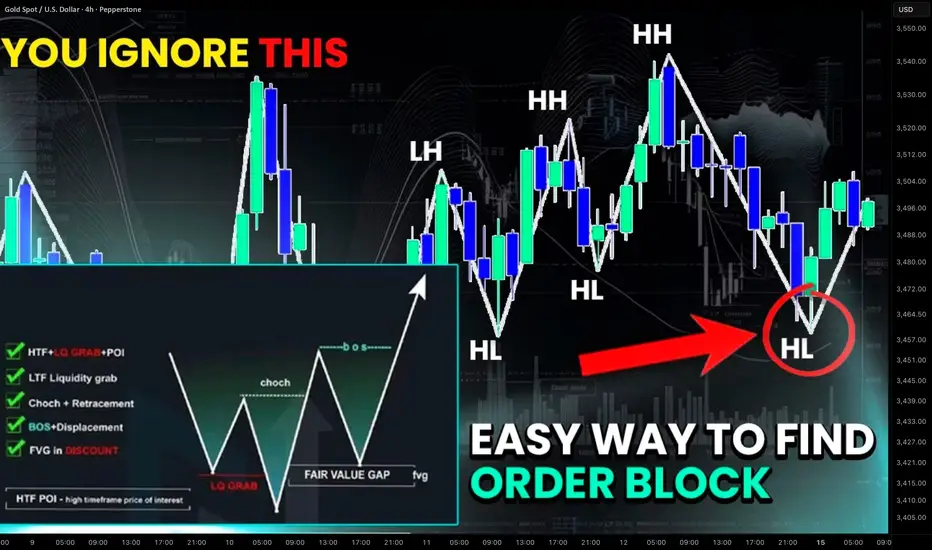
To find a bullish order block, you will need to learn by heart a classic bullish trend model.
According to the rules, that market is trading in a bullish trend if the price consistently updates Higher High HH and Higher Lows HL.
Such a price action confirms an uptrend .
The last higher low in that will be your Bullish Order Block.
Let me share with you a definition of a bullish order block so you could better understand its deep meaning.
Bullish order block is a significant price zone or a level where large market players (banks, institutions, hedge funds) have previously placed a high volume of buy orders, creating a strong imbalance in demand.
And what is a proof of this strong demand?
A consequent break of structure and a formation of a new higher high demonstrate a clear strength of a bullish wave that was initiated because of the activity of Smart Money.
As the market continues updating Higher Highs , remember to update Order Block. It will strictly be based on the LAST Higher Low.
Examine a price action on NZDUSD forex pair on a daily time frame.
The trend is bullish and our Order Block will be based on the last Higher Low.
To properly draw Order Block zone, its low should be based on the lowest low of a Higher Low. Its high should be based on the lowest daily candle close above a low of a Higher Low.
We will assume that huge volumes of buying orders will accumulate within that zone.
That area will provide a safe zone for us to buy the market from.
Alternatively, its violation will signify an important shift in a market sentiment.
To find a bearish order block, you will need to understand a classic bearish trend model.
According to the rules, that market is trading in a bearish trend if the price consistently updates Lower Lows LL and Lower Highs LH.
Such a price action confirms a downtrend .
The last lower high in that will be your Bearish Order Block.
And here is what exactly is a bearish order block.
Bearish order block is a significant price zone or a level where large market players - Smart Money have previously placed a high volume of sell orders, creating a strong imbalance in supply.
And what is a proof of this strong supply?
A consequent break of structure and a formation of a new lower low demonstrate a clear strength of a bearish wave that was initiated because of the activity of Smart Money.
As the market continues updating Lower Lows, remember to update Order Block. It will strictly be based on the LAST Lower High.
Please, check a price action on NZDCHF forex pair.
The market is trading in a downtrend.
Our bearish order block will be based on the last lower high .
The high of this zone will be the highest high of the last lower high.
Its low will be the highest daily candle close below the last lower high.
That zone will be a critical resistance.
Large selling volumes will be distributed within.
Once that area is tested, we can sell the market from that.
Alternatively, its bullish violation will signify a significant shift in the market sentiment.
Of course, these 2 models will not reveal all the order block on a price chart, BUT it will show you one of the most significant ones that you can rely on for safe entries for your trades.
Just learn a structure mapping in smart money concepts and use that you find powerful order block zones on any forex pair.
❤️Please, support my work with like, thank you!❤️
I am part of Trade Nation's Influencer program and receive a monthly fee for using their TradingView charts in my analysis.
Howtofindorderblock
Best Technical Indicator to Identify Order Block & Imbalance
Your ability to correctly identify Order Blocks on a price chart is essential for profitable trading Smart Money Concept.
In this article, I will show you a great technical indicator that will help you to spot Order Blocks on any financial market.
First, in brief, let me give you my definition of Order Block.
The problem is that in SMC trading there is no one single definition of that and many traders interpret it differently.
To me, an Order Block is a specific zone on a chart from where a strong price movement initiates and where a significant imbalance between supply and demand occurs .
This imbalance should strictly originate from a liquidity zone.
That definition implies that in order to identify an Order Block zone, one should learn to properly identify the imbalance and liquidity zones.
And again, there is no precise definition of an imbalance on a price chart. To me, a bullish imbalance is a formation of a bullish engulfing candle - the one that engulfs a range of previous bearish candle with its body.
Above is the example of a valid Order Block on GBPUSD.
A bearish imbalance is a formation of a bearish engulfing candle - the one that engulfs a range of a previous bullish candle with its body.
Above, you can see the example of an Order Block on USDCAD, based on a bearish imbalance.
There is one technical indicator that will help you to recognize such Order Blocks. It is called " All Candlestick Patterns" on TradingView.
Open settings of the indicator and make it show ONLY Engulfing Candles and choose "No Detection" in "Detect Trends Based on".
After that, hide the indicator and first, Identify the liquidity zones on a chart and wait for a test of one of these zones.
Here is a test of a liquidity zone on NZDUSD on an hourly time frame.
After that, turn on the indicator, and wait for its signal.
You can see that after some time, the price formed a bullish imbalance with a bullish engulfing candle. The indicator highlight that candle.
The Order Block zone will be based on the lowest low of 2 candles and the high of a bearish candle preceding the imbalance.
One more example. We see a test of a significant liquidity zone on EURAUD on a 4H time frame.
We turn on the indicator and look for a signal.
A bearish imbalance is formed and the indicator immediately notifies us.
An Order Block Zone in that case will be the area based on the highest high of 2 candles and the low of a bullish candle preceding the imbalance .
Of course, there will be the rare cases when the indicator will miss the imbalances. But while you are learning to recognize Order Blocks, this indicator will definitely help you a lot!
Thank you for reading!
❤️Please, support my work with like, thank you!❤️
I am part of Trade Nation's Influencer program and receive a monthly fee for using their TradingView charts in my analysis.
