EURCHF: Bullish Move After Trap 🇪🇺🇨🇭
It looks like we have a confirmed liquidity grab on EURCHF.
A bearish violation of the underlined support looks false
after a consequent formation of a bullish imbalance candle.
The price may rise now to 0.9262 level.
❤️Please, support my work with like, thank you!❤️
I am part of Trade Nation's Influencer program and receive a monthly fee for using their TradingView charts in my analysis.
Howtotradesmc

What is Equilibrium in SMC. Balance and Imbalance in Forex Gold
Equilibrium is one of the core elements for understanding market liquidity.
In this article, we will go through the essential basics of liquidity in Forex trading with Smart Money Concepts SMC.
You will learn the interconnections between supply and demand and I will explain how to easily identify balance and imbalance on any market.
Let's start our discussion with understanding how forex pairs move.
The price of an asset goes up if the market demand is stronger than the market supply. The excess of buying activity make the markets update the highs. In smart money concepts, such an event will also be called a buying imbalance.
Look at a strong bullish rally on Gold.
The price is going up because of a buying imbalance.
A strong buying activity creates a massive amount of buyers with unfilled orders.
To entice sellers to start selling, they must offer a higher-better price.
At the same time, if the price of an asset goes down , it means that the market supply is stronger than a demand. The excess of supply will make the markets update the lows. In smc, it will be called a selling imbalance.
That is exactly what is happening with GBPUSD forex pair.
A strong selling activity and the shortage of demand makes the price go down.
The excess of supply or demand on the market can not be eternal.
The lower the price becomes, the more buyers will start buying, and the more sellers will start closing their positions.
At some moment, the surplus of supply will be absorbed by the buyers.
That will be a moment when the market will find equilibrium , the balance between supply and demand.
A strong bearish imbalance on USDJPY made the price drop significantly.
The falling price made 3 things:
It attracted more buyers, because the lower the price the more profitable is buying USDJPY.
It discouraged some buyers from buying, considering that the price is already "too low".
It encouraged some buyers to close their positions in profit.
Because of that, USDJPY stopped falling and found a balance in supply and demand. That is what we call Equilibrium .
In a bull run, the higher the price will go, the more sellers will start selling.
At some moment, buying imbalance will be absorbed by the bears and supply & demand will eventually balance.
Such an event will be called the equilibrium .
EURGBP was rallying strongly.
The higher the price went, the more sellers started to sell, considering selling the pair more and more profitable.
And the same time, fewer buyers were buying and the more started to close their buy positions in profits.
At some moment, the entire excess of the market demand was absorbed by a supply. The market stopped growing and equilibrium was found.
One of the main characteristics of a market equilibrium is sideways price movement and a termination of a formation of new highs or new lows.
Usually, such a sideways price action will form a horizontal range.
That's a real example how a CAD JPY pair found an equilibrium after an extended bearish movement. A formation of a horizontal range confirmed a balance between a supply and a demand.
Please, note that these ranges will form on any time frame that you analyse.
The rule is that the higher is the time frame of the range, the stronger is the market equilibrium.
Above, I have 3 different charts:
USDJPY on a daily time frame, EURJPY on a 4H and GBPUSD on 15 minutes.
All the pairs found an equilibrium in horizontal ranges.
An equilibrium on USDJPY will signify intra week or even intra month balance,
while on EURJPY it will mean intraday/intra week balance.
On GBPUSD, it will signify intraday equilibrium.
Market equilibrium can not last forever.
Fundamentals news and changing market conditions, make the market participants constantly reassess a fair value of an asset.
A violation of the range and a breakout of one of its boundaries will be a trigger of an occurrence of an imbalance .
A bullish violation of the upper boundary of the range will signify a buying imbalance and a highly probable rise to the new highs.
While a bearish violation of the lower boundary of the range will mean a selling imbalance and a highly probable fall to the new lows.
Please, study how GBPCHF was moving for a week on an hourly time frame.
The periods of balance were changed by the periods of bullish or bearish imbalances, that found a new equilibrium on higher/lower price levels.
Understanding of basic principles of supply and demand in trading is essential for profitable trading smart money concepts.
Learn to recognize the periods of imbalance and equilibrium.
It will provide you the edge in understanding and trading any forex pair.
❤️Please, support my work with like, thank you!❤️
I am part of Trade Nation's Influencer program and receive a monthly fee for using their TradingView charts in my analysis.
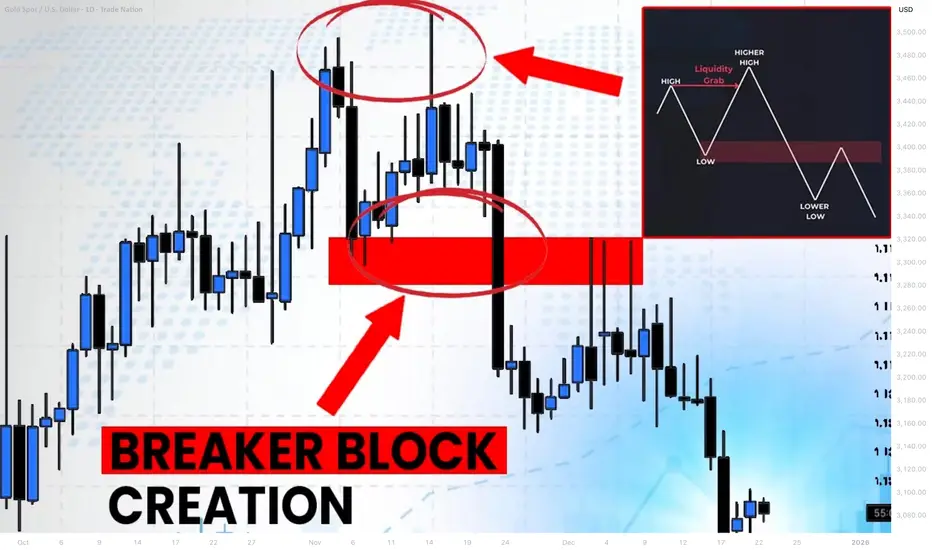
What is Bullish/Bearish Breaker Block & How to Find It Easily
Breaker blocks are easier to find than you think.
In this article, I will share with you very efficient price models for the identification of Order Blocks and Breaker Blocks.
You will learn their meaning, how to draw and use them in trading Smart Money Concepts SMC.
Bullish Trend Model & Breaker Block.
Let's start with an essential theory .
Please, examine a following price model:
In a classic bullish structure where the price consistently updates Higher Highs HH and Higher Lows HH, a bullish order block zone will be the area based on the last Higher How.
I will explain how to draw that zone in the examples below.
In some instances, a bullish order block zone will fail to deliver a bullish wave. Its bearish breakout will follow after its test instead.
It will be a critical event that is called a market structure shift in Smart Money Concepts SMC.
A formation of a new low will signify a violation of a bullish trend and a highly probable change of the market sentiment.
A broken bullish order block zone will turn into a Bearish Breaker Block.
The zone from where the next bearish wave will most likely follow.
It will provide a very safe place to sell from.
Market structure shift in a bullish trend is not a random event.
It usually occurs after a test of a significant supply zone with a liquidity grab.
It can help you to predict the change of the sentiment way before it happens.
That's an example of such a price model on GBPAUD forex pair.
We see a confirmed bullish liquidity sweep in uptrend after a test of a historic supply zone.
A bearish wave followed then and a bullish order block zone was broken.
To draw Order Block Zone, I picked the level of the last higher low as its lower boundary and a low of a body of that candlestick as the upper boundary.
After a breakout, it turned into a Bearish Breaker Block.
A bearish continuation occurred after its test.
Bearish Trend Model & Breaker Block.
Please, check this model:
In a classic bearish structure where the price consistently updates Lower Lows LL and Lower Highs LH, a bearish order block zone will be the area based on the last Lower High.
In some instances, a bearish order block zone will fail to deliver a bearish wave. Its bullish breakout will follow after its test instead.
It will be a significant event that is called a bullish market structure shift in Smart Money Concepts SMC.
A formation of a new high will signify a violation of a bearish trend and a highly probable change of the market sentiment.
A broken bearish order block zone will turn into a Bullish Breaker Block.
The zone from where the next bullish wave will most likely follow.
It will provide a very safe place to buy from.
Market structure shift in a bearish trend is not a random event.
It usually occurs after a test of a significant demand zone with a liquidity grab.
That's a real example of such a price model on WTI Crude Oil.
A bearish structure was violated after a test of a demand zone.
A bearish order block was broken, and it turned into a Bullish Breaker Block Zone then.
(Drawing a bullish order block zone, I picked the level of the last lower high as its upper boundary and a high of a body of that candle as its lower boundary )
A bullish movement followed after a deep test of that.
A proper combination of structure mapping and liquidity analysis will help you to predict a market structure shirt and a breaker block creation before they happen.
The models that I shared will help you to confirm bullish and bearish breaker blocks trading Forex or any other markets with Smart Money Concepts SMC ICT.
❤️Please, support my work with like, thank you!❤️
I am part of Trade Nation's Influencer program and receive a monthly fee for using their TradingView charts in my analysis.
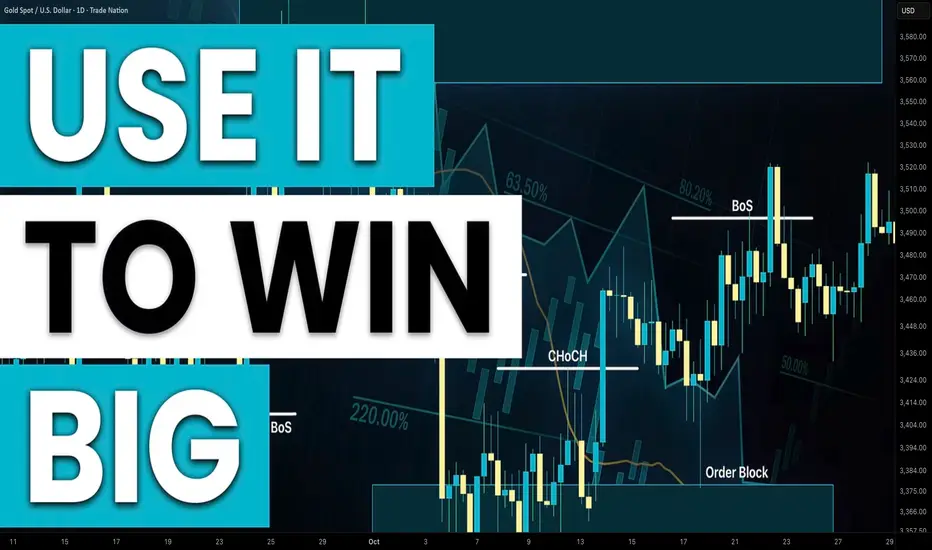
Profitable Multiple Time Frames Smart Money Strategy For Trading
In this post, I will share with you a very accurate and profitable SMC Smart Money trading strategy that combines top-down analysis, liquidity, imbalance, order block and inducement.
Step 1 - Identify liquidity zones on a daily
Liquidity zones are the areas on a price chart, where big players are placing their orders. From such areas, significant bullish and bearish movements initiate.
Liquidity zones that are above the current price will be the supply zones, while the liquidity zones that are below the current price will be the demand zones.
We will look for shorting opportunities from supply areas and for buying opportunities from demand zones.
Here are the liquidity zones that I identified on EURJPY.
Step 2 - Wait for a test of one of the liquidity zones
Let the market test the liquidity zone.
For buying, the price should reach a lower boundary of a demand zone.
For shorting, the price should test an upper boundary of a supply zone.
I underlined the exact levels that the price should test on EURJPY.
Here is the test of the lower boundary of the demand zone.
Step 3 - Look for inducement on an hourly time frame
With the inducement, smart money make the market participants think that the liquidity zone that the price is testing doesn't hold anymore.
When the price tests a supply area, an hourly candle close above its upper boundary will be a bullish inducement.
With that, the smart money incentivize buying orders.
When the price tests a demand area, an hourly candle close below its lower boundary will be a bearish inducement.
With that, the smart money incentivize selling orders.
The price closed below a lower boundary of a demand zone on EURJPY on 1H time frame.
Step 4 - Look for imbalance on an hourly time frame
After a violation of a supply area on an hourly time frame, look for a bearish imbalance.
Bearish imbalance is a strong bearish candle with wide range and big body. With that candle, the market should return within a supply zone and closed within or below that.
After a violation of a demand area on an hourly time frame, look for a bullish imbalance.
Bullish imbalance is a strong bullish candle with wide range and big body. With that candle, the market should return within a demand zone and closed within or above that.
Here is the example of a bullish imbalance on EURJPY.
After a bearish inducement, the price formed a high momentum bullish candle and closed within the demand zone.
The imbalance signify that a liquidity zone violation was a trap .
With that, smart money simply was trying to grab the liquidity.
That will be a signal for you to open an order.
Step 5 - Look for an order block
After the formation of the imbalance, the market becomes locally week and quite often corrects to an order block.
Order block will be the closest hourly liquidity zone.
After a formation of a bearish imbalance, look for a supply zone on an hourly time frame. That will be your perfect zone to sell .
After a formation of a bullish imbalance, look for a demand zone on an hourly. That will be your area to buy from.
Here is the order block on EURJPY.
Step 6 - Set a limit order
Set a sell limit order within a supply area after a formation of bearish imbalance on an hourly time frame.
Set a buy limit order within a demand area after a formation of a bullish imbalance on an hourly.
Here is your buy entry level on EURJPY.
Step 7 - Select the target
If you sell, your target should be the closest daily structure support: horizontal or vertical one.
If you buy, your target should be the closest daily structure resistance: horizontal or vertical one.
In our example, our closest structure resistance if a falling trend line.
Step 8 - Set stop loss
If you sell, stop loss will lie above a bullish inducement.
If you buy, stop loss will lie below a bearish inducement.
Here is a perfect point for a stop loss for a long trade on EURJPY.
Step 9 - Trade
Let the price trigger your entry, and then be prepared to wait.
It took many days for EURJPY to reach the target.
Trading Tips:
1. Make sure that you have a positive reward/ratio. It should be at least 1.2
2. Risk no more that 1% of your trading account per trade
Being applied properly, that strategy shows 70%+ accuracy.
Try it by yourself and let me know your results.
❤️Please, support my work with like, thank you!❤️
I am part of Trade Nation's Influencer program and receive a monthly fee for using their TradingView charts in my analysis.
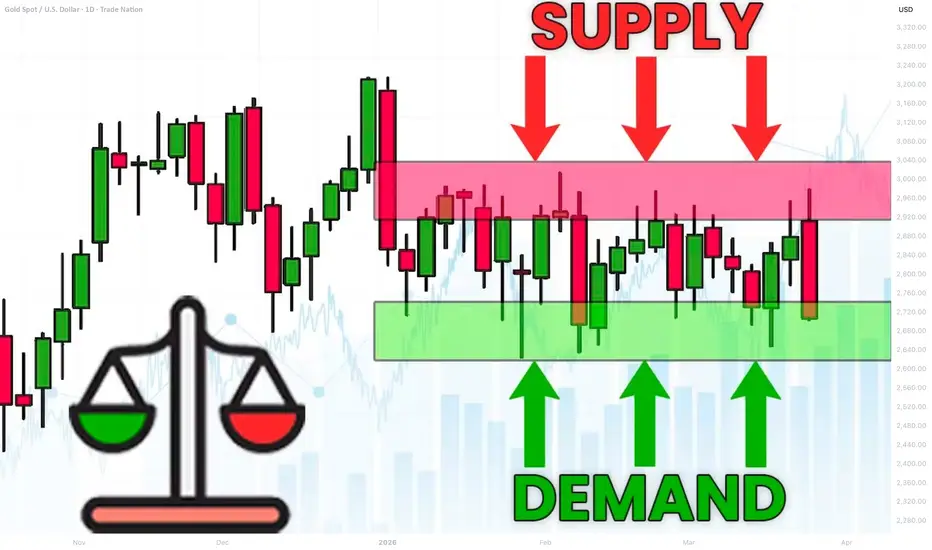
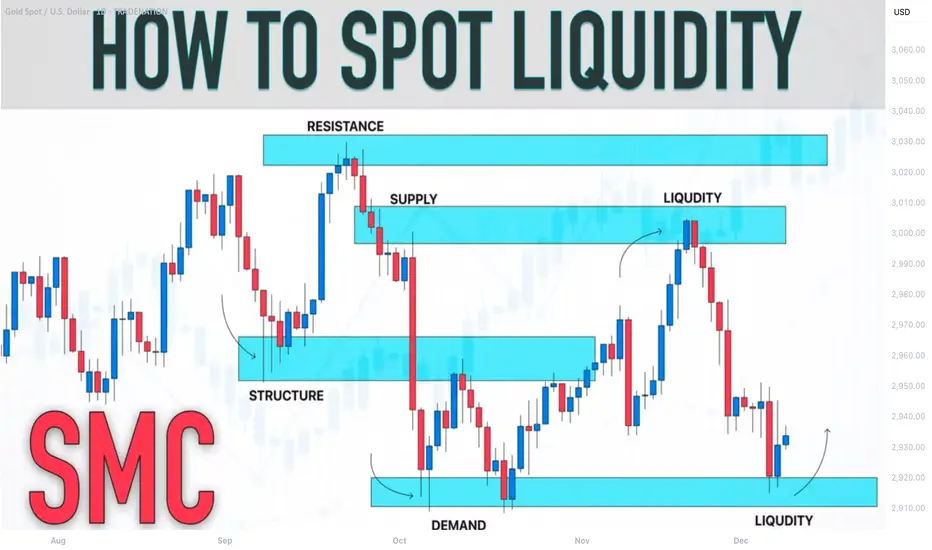
SMC Trading Basics. Liquidity Zones & How to Identify Them
In the today's article, I will teach you the concept of liquidity zones and how to identify them properly, trading Forex, Gold, Crypto and Indexes.
Simply put, a liquidity zone is a certain area on a price chart where a significant concentration of trading volumes occurred.
Huge trading volumes signify the presence of big players: hedge funds, banks, etc...
Correct identification of liquidity zones is essential for smart money trading, because such zones provide the safest and the most profitable trading opportunities.
There are 3 common characteristics of a valid liquidity zone:
1. Huge volume spikes upon its test
Take a look at the underlined blue area on USDCAD.
We see sharp volume spikes when the market was testing that area.
2. Strong rejections from such an area with a formation of long wicks
Look how the price reacts to the liquidity zone on USDJPY.
We see multiple strong rejections from that.
3. Long consolidation within that zone
Bitcoin was "standing" on a liquidity zone for more than 3 weeks, barely moving while trading volumes were quietly accumulating.
4. Multiple strong bullish or bearish reactions to that area
Just look how many times the underlined area was respected by the buyers and by the sellers. That is a perfect example of a liquidity zone.
To underline a liquidity zone properly, follow these simple rules:
1. If the price is ABOVE the liquidity zone, its lower boundary
will be the lowest wick within that area and its upper boundary will be the lowest candle close. Such a liquidity zone will be called a demand area.
Here is the example of drawing a liquidity zone on GBPUSD.
The lower boundary of the zone is the lowest wick, while its upper boundary is the lowest candle close.
2. If the price is BELOW the liquidity zone, its upper boundary will be the highest wick within that area and its lower boundary will be the highest candle close. Such a liquidity zone will be called a supply area.
Here is the liquidity zone that I identified on Gold following our rules.
Remember, that you can identify liquidity zones on any time frame. However, the rule is that the higher is the time frame, the stronger is the liquidity zone.
I prefer to analyze the liquidity zones on a daily time frame.
Once you underlined liquidity zones, you should realize that within these areas, big players are expected to place their orders in the future.
For that reason, after the tests of such areas, a strong bullish or bearish movements will be expected.
Here is a huge liquidity zone that I spotted on GBPJPY.
Look at a strong bearish movement that initiated after its test.
Your task as a smart money trader will be to identify bullish or bearish confirmations and understand the intentions of big players. With experience, you will learn to recognize valid signals.
❤️Please, support my work with like, thank you!❤️
I am part of Trade Nation's Influencer program and receive a monthly fee for using their TradingView charts in my analysis.
How to Do Structure Mapping with Multiple Time Frames Analysis
If you think that structure mapping is not efficient for profitable trading, you get it wrong .
What newbies traders always miss is that structure mapping works effectively only with multiple time frame analysis.
In this article, I will show you how you can build profitable trading plans and accurate predictions on forex market with structure mapping alone.
Learn top-down analysis secrets and how to map structure properly in Smart Money Concepts SMC ICT.
In order to effectively use structure mapping for scalping, day trading and swing trading , always start it from higher time frames.
Examine my complete structure mapping on USDJPY forex pair on a daily time frame.
You can see that first, the pair was trading in a strong bearish trend.
Then, we had a confirmed bullish reversal with Change of Character.
After that, the market started an extended consolidating movement, not being able to update the highs.
And finally, the last bullish wave managed to update a high , confirming a completion of a consolidation and a resumption of a bullish trend.
Structure mapping reveals that USDJPY is now bullish on a daily and the last bearish movement is a correction in uptrend.
We can expect a start of a new bullish wave soon.
To understand when exactly it is going to happen, you will need to dive your analysis deeper .
You should start structure mapping on lower time frames.
And you should execute a price action analysis there in relation to your structure mapping on a higher time frame.
4H time frame structure mapping will reveal a price action within the last bearish move that we spotted on a daily.
We see that the market is trading in a bearish trend and the price started a local correctional movement after a formation of the last low.
4h time frame structure mapping provided a detailed intra week perspective.
Hourly time frame analysis, we reveal hidden intraday trends that will unveil more insights.
And why are we doing all that?
Remember that big waves always start from minor reversals.
The earlier you are able to find strong confirmations, the earlier you will open a trading position and the more profits you will make.
On an hourly time frame, our structure mapping shows that the market is already bullish. A bearish trend that USDJPY followed is already violated, and the price is updating the highs.
Following our analysis, the only thing that we need to confirm a start of a bullish trend is a confirmed trend reversal and a change of character on a 4H time frame.
It will validate an intra week bullish trend.
We will need the price to break the underlined blue resistance based on the last lower high in a bearish trend.
That will provide an accurate signal for us to buy.
And we can anticipate a rise a least to a current daily higher high then.
When you do structure mapping on forex market, never forget to do that on multiple time frames. Multiple perspectives and short-term/mid-term/long-term projections will help you to build a more efficient trading plan.
Remember that you can expand your structure mapping even for minute time frames. It will provide a unique perspective for scalping forex.
❤️Please, support my work with like, thank you!❤️
Market Manipulations. Bullish Trap (Smart Money Concepts SMC)
In the today's article, we will discuss how smart money manipulate the market with a bullish trap .
In simple words, a bullish trap is a FALSE bullish signal created by big players.
With a bullish trap, the smart money aims to:
1️⃣ Increase demand for an asset, encouraging the market participant to buy it.
2️⃣ Make sellers close their positions in a loss .
When a short position is closed, it is automatically BOUGHT by the market.
Take a look at a key horizontal resistance on AUDCHF.
Many times in the past, the market dropped from that.
For sellers, it is a perfect area to short from.
Bullish violation of the underlined zone make sellers close their position in a loss and attracts buyers.
Then the market suddenly starts falling heavily, revealing the presence of smart money.
Both the sellers and the buyers lose their money because of the manipulation.
There are 2 main reasons why the smart money manipulates the markets in a such a way:
1️⃣ - A big player is seeking to close a huge long position
When a long position is closed, it is automatically SOLD to the market.
In order to sell a huge position, smart money needs a counterpart who will buy their position.
Triggering stop losses of sellers and creating a false demand, smart money sell their position partially to the crowd.
2️⃣ - A big player wants to open a huge short position
But why the smart money can't just close their long position or open short without a manipulation?
A big sell order placed by the institutional trader, closing their long position, can have an impact on the price of the asset. If the sell order is large enough, it can push the price downward as sellers outnumber buyers. Smart money are trying to balance the supply and demand on the market, hiding their presence.
It is quite complicated for the newbies and even for experienced traders to recognize a bullish trap.
One of the efficient ways is to apply multiple time frame analysis and price action.
Remember, that most of the time bullish traps occur on key horizontal or vertical resistances.
After you see a breakout, analyze lower time frames.
Quite often, after a breakout, the market starts ranging .
After a breakout of a key daily resistance, gold started to consolidate within a narrow range on an hourly time frame.
Bearish breakout of the support of the range will indicate a strength of the sellers and a highly probable bullish trap.
Remember, that you can not spot all the traps, and occasionally you will be fooled by smart money. However, with experience, you will learn to recognize common bullish traps.
❤️Please, support my work with like, thank you!❤️
I am part of Trade Nation's Influencer program and receive a monthly fee for using their TradingView charts in my analysis.

Accurate Price Model for Trading Smart Money Concepts SMC (=
If you trade Smart Money Concepts SMC, there is one single pattern that you should learn to identify.
In this article, you will learn an accurate price model that you can use to predict a strong bullish or bearish movement way before it happens.
Read carefully and discover how to track the silent actions of smart money on any market.
The only thing that you need to learn to easily find this pattern is basic Structure Mapping . After you map significant highs and lows, you will quickly recognize it.
This SMC pattern has 2 models: bullish and bearish ones.
Let's start with a bearish setup first.
Examine a structure of this pattern
it should be based on 2 important elements.
The price should set a sequence of equal lows.
These equal lows will compose a demand zone.
The area where a buying interest will concentrate.
The minimum number of equal lows and lowers highs should be 2 to make a model valid.
Exhausting of bullish moves will signify a loss of confidence in a demand zone . Less and less market participants will open buy positions from that.
At some moment, a demand zone will stop holding. Its bearish breakout will provide a strong bearish signal , and a bearish continuation will most likely follow.
This price model will signify a market manipulation by Smart Money.
They will not intentionally let the price fall, not letting it break a demand zone. A buying interest that will arise consequently will be used as a source of liquidity.
Smart money will grab liquidity of the buyers, silently accumulating huge volumes of selling orders.
Once they get enough of that, a bearish rally will start, with a demand zone breakout as a trigger.
Though, the chart model that I shared above has a strong bullish impulse, preceding its formation, remember that it is not mandatory.
The price may also form a bearish impulse first and for a pattern then.
Each bullish movement that initiates after a formation of an equal low should be weaker than a previous one.
So that the price should set a lower high every time after a formation of an equal low.
Look at a price action on USDCHF forex pair. Way before the price dropped, you could easily identify a market manipulation of Smart Money and selling orders accumulation.
A breakout of a horizontal demand zone was a final bearish confirmation signal.
Let's study its bullish model.
It has a similar structure.
The price should set a sequence of equal highs, respecting a horizontal supply zone.
Each bearish move that follows after its test should have a shorter length, forming a higher low with its completion.
This model will be also valid if it forms after a completion of a bearish impulse.
Weakening bearish movements will signify a loss of confidence in a supply zone, with fewer and fewer market participants selling that.
Its bullish breakout will be an important even that will confirm a highly probable strong bullish continuation.
Smart Money will use this price model to manipulate the market and accumulate buying orders, not letting the price go through a supply zone. They will grab a liquidity of the sellers each time a bearish move follows from a supply zone.
When they finally get enough of a liquidity, a bullish rally will initiate and a supply zone will be broken , providing a strong confirmation signal.
That price model was spotted on GBPJPY forex pair.
Smart Money were manipulating the market, not letting it continue rallying by creating a significant horizontal supply zone.
Selling orders that were executed after its tests provided a liquidity for them.
A bullish breakout of the underlined zone provides a strong bullish confirmation signal.
A breakout and a future rise could be easily predicted once this price model appeared.
Why they do it?
But why do Smart Money manipulate the markets that way?
The answer is simple: in comparison to retail traders, they trade with huge trading orders . To hide their presence and to not impact market prices much, they split their positions into a set of tiny orders that they execute, grabbing the liquidity.
The price model that we discussed today is the example how they do it.
The important thing to note about this pattern is that it efficiently works on any market and any time frame. You can use that for scalping, day trading, swing trading. And it can help you find great investing opportunities.
❤️Please, support my work with like, thank you!❤️
I am part of Trade Nation's Influencer program and receive a monthly fee for using their TradingView charts in my analysis.
How to Trade Liquidity Sweep in Forex Market (SMC Trading)
I will show you a real example of trading liquidity sweep with Smart Money Concepts.
You will learn the essential SMC liquidity basics, a simple and profitable strategy to identify and trade liquidity sweep.
I will share with you an accurate entry confirmation signal that works perfectly on any Forex pair.
Liquidity Basics
In order to trade liquidity sweeps profitably, you should learn to identify significant liquidity zones.
To spot them, analyze a historic price action and find clusters of important historic key levels.
Examine a price action on EURUSD on an hourly time frame.
I underlined multiple horizontal key levels.
The price respected each level, found support on them, and rebounded.
What is so specific about these levels is that they are lying close to each other, composing a liquidity cluster.
That fact that EURUSD strongly bounced from these levels suggests that buying interest and high buying volumes were concentrated around them.
We can unite these levels and treat them as a single demand zone that has just been broken and turned into a supply zone.
After we found a valid liquidity zone, we can look for a liquidity sweep.
First, we should let the price approach that area and look for a specific price behavior then.
That is a perfect example of a liquidity sweep.
You can see that the price formed a wide range candle with a long tail.
Its high went way beyond the underlined area, but its body closed within.
In order to understand, why a liquidity sweep occurred, let's zoom in our chart and try to understand a behavior of the market participants.
Our supply zone concentrated selling orders , we assume that sellers were placing their orders across its entire length.
Their stop losses were presumably lying above that area.
Smart Money know that and with a liquidity sweep they manipulate the market, making sellers close their positions in a loss (buying back their positions from the market) and providing a liquidity for big players.
After a formation of a such a candlestick, a reliable confirmation of a saturation of the Smart Money is a formation of a strong bearish candle - a clear sign of strength of the sellers.
A bearish engulfing candle above confirmed a completion of a liquidity sweep and indicates a highly probable bearish continuation.
Your perfect sell entry is immediately after a close of such a candlestick.
Stop loss should strictly lie above the high of a liquidity sweep.
Take profit is based on a local low.
Look, how quickly the price reached the goal.
Your strategy of trading liquidity sweeps of demand zones is absolutely the same.
Let the price test a demand zone, wait for a formation of wide range bearish candle with a tail going below its lows.
Wait for a bullish imbalance candle and buy immediately then.
Stop loss will be below the low of a liquidity sweep, take profit - a local high.
This SMC strategy works on any time frame and can be applied for trading any Forex pair, Gold, Silver, Crypto and commodities.
Try it by your own and let me know your results.
❤️Please, support my work with like, thank you!❤️
I am part of Trade Nation's Influencer program and receive a monthly fee for using their TradingView charts in my analysis.

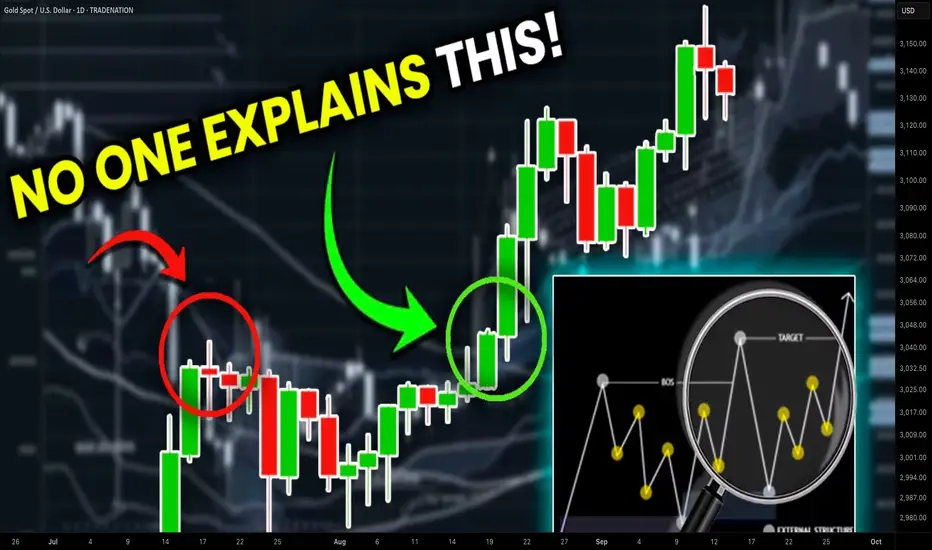
SMC Trading Basics. Change of Character - CHoCH (GOLD FOREX)
In the today's post, we will discuss one of the most crucial concepts in SMC - Change of Character.
Change of Character relates to market trend analysis.
In order to understand its meaning properly, first, we will discuss how Smart Money traders execute trend analysis.
🔘Smart Money Traders apply price action for the identification of the direction of the market.
They believe that the trend is bullish ,
if the price forms at least 2 bullish impulse with 2 consequent higher highs and a higher low between them.
The market trend is considered to be bearish ,
if the market forms at least 2 bearish impulses with 2 consequent lower lows and a lower high between them.
Here is how the trend analysis looks in practice.
One perceives the price action as the set of impulse and retracement legs.
According to the rules described above, USDCAD is trading in a bullish trend because the pair set 2 higher lows and 2 higher highs.
🔘Of course, trends do not last forever.
A skill of the identification of the market reversal is a key to substantial profits in trading.
Change of Character will help you quite accurately identify a bullish and bearish trend violation.
📉In a bearish trend, the main focus is the level of the last lower high.
While the market is trading below or on that, the trend remains bearish .
However, its bullish violation is a very important bullish signal,
it is called a Change of Character, and it signifies a confirmed violation of a bearish trend.
In a bearish trend, CHoCH is a very powerful bullish pattern.
Take a look, how accurate CHoCH indicated the trend reversal on Gold.
After a massive selloff, a bullish breakout of the level of the last lower high confirmed the initiation of a strong bullish wave.
📈In a bullish trend, the main point of interest is the level of the last higher low. While the price is trading above that or on that, the trend remains bullish.
A bearish violation of the last higher low level signifies the violation of a current bullish trend. It is called a Change of Character, and it is a very accurate bearish pattern.
Take a look at the example on Dollar Index below.
In a bullish trend, bearish violation of the last higher low level
quite accurately predicted a coming bearish reversal.
Change of Character is one of the simplest , yet accurate SMC patterns that you should know.
First, learn to properly execute the price action analysis and identify HH, HL, LL, LH and then CHoCH will be your main tool for the identification of the trend reversal.
❤️Please, support my work with like, thank you!❤️
I am part of Trade Nation's Influencer program and receive a monthly fee for using their TradingView charts in my analysis.

Best Liquidity Grab / Sweep Strategy For Trading Forex & Gold
Learn how to trade liquidity grab / sweep with multiple time frame analysis.
Discover how to combine top-down analysis and smart money concept SMC for trading forex and gold.
You will get a complete step by step trading strategy with entry, stop loss and target.
1. In order to trade liquidity grab / sweep properly, you need to find liquidity zones first.
For this trading strategy, the best liquidity zones will be on a daily time frame.
Check these 2 significant liquidity zones on EURAUD forex pair on a daily.
The zone where the selling activity concentrate will be called a supply zone. While the zone with a strong concentration of a buying activity will be a demand zone.
2. After that, you should look for a liquidity grab / sweep.
For a valid liquidity grab / sweep the daily candle should violate the liquidity zone only with the tail / wick of the candle , while the body should stay within the zone.
Above is the example of a liquidity grab of a demand zone.
While the daily candle closed within the underlined area, the wick went beyond that.
3. After you identified a liquidity grab/sweep, start analyzing lower time frames . For this strategy, the best time frames are 4H and 1H.
On these time frames, you should look for a consolidation and a formation of a horizontal range.
Here is such a range on EURAUD on a 4H.
These ranges will be used for confirmation .
Your bullish signal will be a breakout of the resistance of the range ,
it will confirm a strong buying interest after a liquidity grab.
That is the example of such a confirmation.
4. After that, set a buy limit order on a retest of a broken resistance of the range. Take profit will be the closest strong resistance, stop loss will be below the support of the range.
That is how we trade a liquidity grab/sweep of a demand zone.
With the supply zone liquidity grab trading strategy, you should wait for a bullish liquidity sweep followed by a bearish breakout of a range on a 4H / 1H time frames.
I always say to my students that a single time frame analysis is not sufficient for profitable trading SMC.
A proper combination of multiple time frames is the key to consistent profits.
Following this strategy, you should achieve up to 80% winning rate trading liquidity grabs / sweeps.
❤️Please, support my work with like, thank you!❤️
I am part of Trade Nation's Influencer program and receive a monthly fee for using their TradingView charts in my analysis.

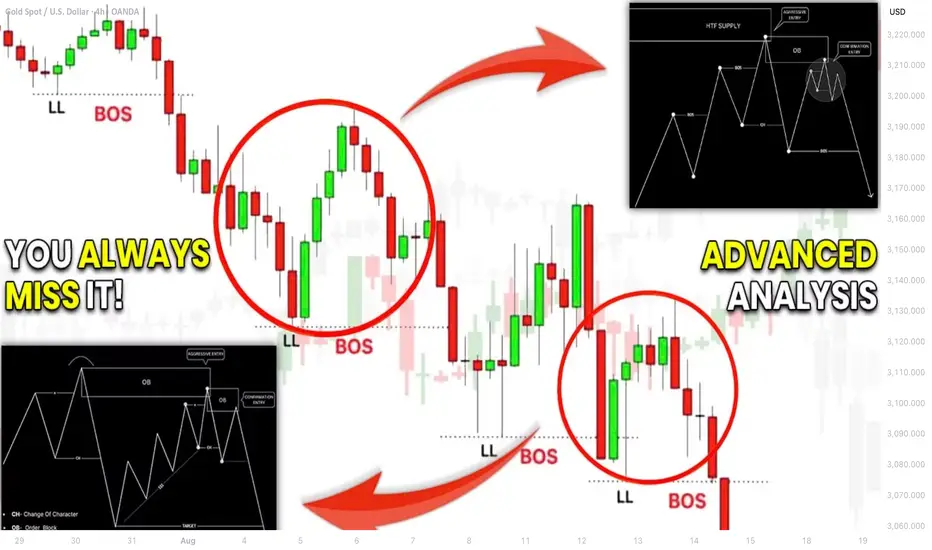
Advanced Trend Analysis in SMC Smart Money Concept Trading Forex
In this article, we will discuss how to execute advanced market trend analysis with smart money concept trading.
I will teach you how to identify long-term, mid-term and minor trend and how to apply trend analysis in making predictions and trading.
First, let me briefly remind you the basic rules of a trend analysis in SMC trading.
We say that the market is bullish if there are at least 2 bullish impulses with 2 higher highs and a retracement leg between them with a higher low.
The market is bearish if there are at least 2 bearish impulses with 2 lower lows and a retracement leg between them with a lower high.
If the conditions for a bullish or a bearish trend are not met, we say that the market is consolidating .
Bullish violation of the last higher high in a bullish trend is called a Break of Structure BoS.
Bearish violation of the last higher low in a bullish trend is called a Change of Character CHoCH.
Bearish violation of the last lower low in a bearish trend is called a Break of Structure BoS.
Bullish violation of the last lower high in a bearish trend is called a Change of Character CHoCH.
BoS signifies a trend continuation.
CHoCH signifies a trend violation.
In order to apply these rules on a price chart, we perceive the market movements as the set of impulse and retracement legs.
However, with such a method of analysis a big question arises: what is exactly is the impulse leg, how strong and long it should be. Which price fluctuations can be a part of the impulse and which should be excluded.
Look at the example above. A price action on AUDCAD can be perceived as one single bullish impulse or a combination of 3 bullish impulses and retracements and a combination of multiple impulses and retracements.
Which way of analysis is correct?
The fact is that the price action analysis on each chart is correct . The only difference between them is the perspective .
From a long-term perspective , the entire price movement on the chart is a one single impulse.
From a mid-term perspective , it is the market that is trading in a bullish trend in 3 bullish impulses.
From a short-term perspective , it is the market that is trading in a bullish trend and started to consolidate and trade in sideways for some time, resuming the growth then.
With advanced SMC trend analysis, you should learn to perceive a price chart not only as a combination of impulse and retracement legs, but also as a combination of long-term, mid-term and short-term trends and movements.
Depending on your trading style, such a reasoning can be applied on any time frame.
Look at AUDJPY pair on an hourly time frame.
From a long-term perspective, the pair is trading in a bearish trend.
Studying in details the last bullish impulse, we can perceive it as a minor bullish trend with its confirmed violation after a Change of Character.
Let's discuss another example.
EURNZD is trading in a clear long-term bullish trend on a daily.
Zooming in the chart, we can also analyze the last bullish impulse in a long-term bullish trend as a mid-term bullish trend.
At the same time, if we analyze the recent minor movements, we can spot a confirmed minor bearish trade on the pair.
Why do we need such an in-depth market trend analysis?
Always remember that a global trend is always born from a minor trend. Minor trend analysis will help you to identify local reversal, trend following signals much earlier.
The fact that EURNZD started to trade in a minor bearish trend, being globally bullish, can be an important warning sign for us.
You can see that after some time the pair started to fall rapidly.
A minor bearish trend continued, a mid-term bullish trend was violated and a correction started in a global bullish trend.
Your ability to correctly analyze different market perspectives is essential for making accurate predictions.
The trend analysis rules and events that we discussed are more than enough for successful trading any time frame and any market.
Study trend analysis, learn to identify global, mid-term and minor trend and good luck in your trading.
❤️Please, support my work with like, thank you!❤️

Learn What is Inducement and Trap in Smart Money Concepts SMC
Smart Money Concepts can be applied for the identification of trend reversal in Forex and Gold trading.
In this article, we will discuss what is an inducement and a trap in SMC . And how to apply them to spot an accurate trading signal.
We will study the important theory and go through real market examples on XAUUSD chart.
Imagine that there is a strong historical resistance on a price chart.
Because the price reacted to that strongly in the past, many sellers will place selling orders on that in future, anticipating a similar reaction.
Placing short trades, their stop losses will lie above the resistance.
In case of a bullish violation of the underlined resistance,
sellers will be stopped out from their short trades and close their positions in loss .
After the violation of a resistance, according to the rules, it should turn into support . Many traders will place their buy orders there, anticipating a bullish continuation.
Bearish violation of such a support will stop out the buyers as well.
Such a price action will be called an inducement and a bullish trap.
With that, smart money grab the liquidity both from the buyers and from the sellers.
After that, with a high probability, the market will drop .
For example, Bullish violation of an all-time-high on Gold can easily be a bullish trap.
To confirm that, the price should simply break and close below a broken horizontal resistance.
That will confirm a local bearish reversal.
With a bullish trap and inducement, smart money are quietly placing HUGE SELLING ORDERS , making the retail traders close short trades in loss (buy their positions) and buy from the broken structure, providing them the liquidity.
The ability to recognize the traps will let you understand real intentions of smart money and trade with them.
❤️Please, support my work with like, thank you!❤️

Learn What is Inducement and Trap in Smart Money Concepts SMC
Smart Money Concepts can be applied for the identification of trend reversal in Forex and Gold trading.
In this article, we will discuss how to apply basic SMC techniques : trap and inducement to identify early reversal signs. We will study the important theory and go through real market examples on XAUUSD chart.
Imagine that there is a strong historical resistance on a price chart.
Because the price reacted to that strongly in the past, many sellers will place selling orders on that in future, anticipating a similar reaction.
Placing short trades, their stop losses will lie above the resistance.
In case of a bullish violation of the underlined resistance,
sellers will be stopped out from their short trades and close their positions in loss.
After the violation of a resistance, according to the rules, it should turn into support . Many traders will place their buy orders there, anticipating a bullish continuation.
Bearish violation of such a support will stop out the buyers as well.
Such a price action will be called an inducement and a bullish trap.
With that, smart money grab the liquidity both from the buyers and from the sellers.
After that, with a high probability, the market will drop .
Bullish violation of an all-time-high on Gold can easily be a bullish trap.
To confirm that, the price should simply break and close below a broken horizontal resistance.
That will confirm a local bearish reversal.
With a bullish trap and inducement, smart money are quietly placing HUGE SELLING ORDERS , making the retail traders close short trades in loss (buy their positions) and buy from the broken structure, providing them the liquidity.
The ability to recognize the traps will let you understand real intentions of smart money and trade with them.
❤️Please, support my work with like, thank you!❤️

Smart Money Concepts Detailed Learning Plan. 5 Essential Topics
If you want to learn Smart Money concepts, but you don't know what to start with, this article with help.
I will share with you 5-steps Smart Money Concepts learning plan . 5 important topics to study in SMC.
Topic 1:
Market Structure - the analysis of a behavior of a price on a chart.
In the contest of Smart Money Concepts you should learn:
-SMC structure mapping
-Market trend identification
-Trend change
-Trend reversal
-SMC important events: BoS, CHoCH
Learn Trend Analysis
Leach ChoCH
Topic 2:
Liquidity Zones - learn to identify the areas on a price chart where liquidity concentrates.
Learn How to Identify Liquidity Zones
Topic 3:
Imbalance - one of the most accurate signals of the presence of big players / smart money on the market.
Learn How to Identify Imbalance with Candlestick
Topic 4:
Order Block - the specific areas on a price chart where institutional traders / smart money are placing significant number of trading orders.
Top 5:
Top-Down Analysis - structured and consistent analysis of multiple time frames.
After you study Topic 1, 2, 3, 4, you should learn to apply these knowledge and techniques on multiple time frames, to make informed decisions, following long-term, mid-term, short-term analysis.
Learn Top - Down Analysis
The 5 topics that we discussed are essential for your success as a smart money trader.
Study these topics with care, and I guarantee you that you will achieve exceptional results.
❤️Please, support my work with like, thank you!❤️
