HUBC – Short-Term Bullish SetupThe price is consolidating in the 217–221 zone and attempting a breakout.
RSI remains above 60 and the price is trading above the 50-day MA, indicating
bullish momentum.
Buying Zones: 217–221 (CMP), and around 210 on dips.
Stop-Loss: 205 (Closing Basis)
Targets: 239 / 250
Long-term structure also remains positive; dips can be considered for accumulation.
HUBC

HUBC – Smart Money Retracement Setup| Liquidity GrabThe HUB Power Co. Ltd (PSX: HUBC) chart is developing a clean Smart Money Concept (SMC) structure — showing signs of a short-term liquidity sweep before a strong bullish continuation.
📊 Market Insights:
🔹 Equal Lows / Liquidity Zone (SSS) forming near key support
🟪 Expecting short-term pullback to sweep liquidity around 160–170 zone
🟡 Order Block (OB) remains unmitigated — potential re-entry area for Smart Money
🔻 Bearish retracement before a strong bullish reversal
🎯 Long-term target zone around 280+ levels
💡 Smart Money Outlook:
Price may first hunt liquidity below current structure to tap into discounted OB, then shift momentum bullish for the next impulsive leg up.

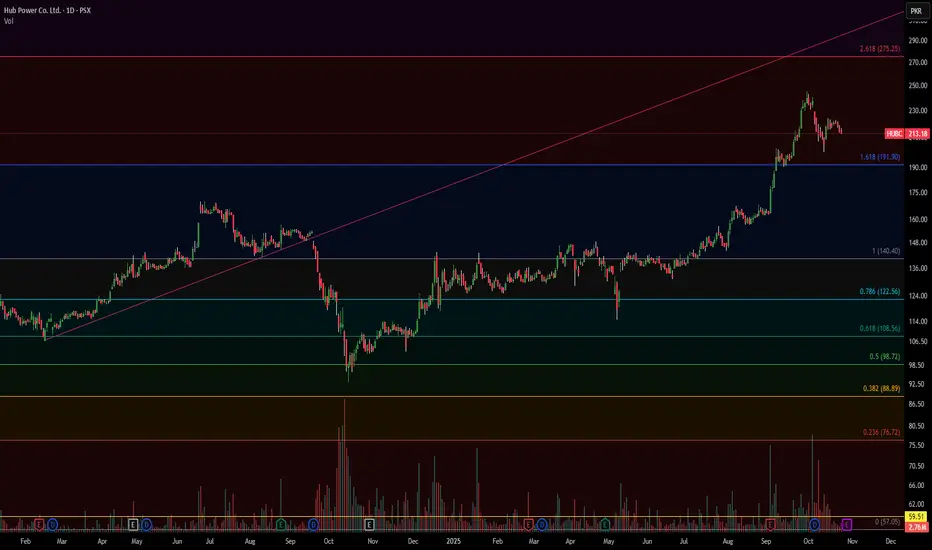
Hub Power Co. Ltd. (Daily chart analysis):Current Situation:
Price: 213.18 PKR, down 0.68%
The stock is in a correction phase after a parabolic rally to 250+ in October
Key Technical Observations:
Trend Structure:
Strong uptrend from August-October 2025, breaking above long-term resistance
Currently pulling back after reaching the 1.618 Fibonacci extension (275.25)
Price rejected at the red diagonal resistance trendline
Fibonacci Retracement Levels (from recent rally):
0.236 (76.72): Extreme support - major breakdown level
0.382 (86.89): Deep correction zone
0.5 (98.72): Half retracement
0.618 (108.56): Strong support zone ✓
0.786 (132.56): Current battle zone - KEY LEVEL
1.0 (140.40): Previous resistance, now support
Critical Support/Resistance:
Support:
Immediate: 210-213 (current price action)
Strong: 191-195 (1.618 Fib + psychological level)
Major: 140-145 (1.0 Fib + previous resistance turned support)
Critical: 132 (0.786 Fib)
Resistance:
Immediate: 220-225 (short-term)
Strong: 240-245 (recent highs)
Major: 250-255 (all-time high zone)
Volume Analysis:
Multiple volume spikes throughout the chart (circled)
Recent volume elevated but declining - suggests weakening buying pressure
Distribution pattern forming at the top
Pattern Recognition:
Potential rising wedge/parabolic blow-off top pattern
Red trendline acting as dynamic resistance
Price struggling to hold above the 1.618 Fib level (191.90)
Technical Outlook:
Bearish Scenario (Higher Probability):
If 210 breaks, expect a move toward 191-195 zone
Break below 191 could trigger deeper correction to 140-145 (30% pullback)
The parabolic nature of the rally suggests a significant retracement is likely
Bullish Scenario:
Needs to reclaim and hold above 220-225 with volume
Break above 240 would invalidate the correction and resume uptrend
Target: Retest of 250-260 highs
Trading Strategy:
Short-term: Bearish - avoid catching falling knives
Watch for support at 191-195 for potential bounce
Conservative buyers should wait for stabilization around 140-150 zone
Stop loss for any long positions: Below 190
Risk Assessment: The steep rally suggests profit-taking pressure. The stock may need time to consolidate before the next leg up. Be cautious of FOMO buying at current levels.
HUBC -PSX - Technical AnalysisHUBC on Daily TF is going bullish. RSI momentum indicates a steady rise and hence prices are going up. KVO also is suggesting that trend is going upwards but still the real Bull run has not begin. Weekly channel has been drawn. Once, this weekly channel is broken upwards then the real bull run will kick-in.
Therefore, sensible trade plan will be to now (Buy-1) and then exist (TP-1) at upper weekly resistance line. Then if the price breaks the resistance, buy again (Buy-2).
Butterfly Harmonic pattern has also been drawn which if respected by the price, then the weekly upper resistance line will not be broken. In that case price will drop to point C where a new buy can be initiated (BUY-3).
LONG (Buy) Call
Buy-1 : 118.20
SL 1: 102
TP-1: 137.00
Buy-2 : 140
SL 2 : 135
TP-2: 165.00
BUY-3: 103
SL 3: 93
TP-3: 165

HUBC - BEARISH REVERSAL WITHIN A BULL FLAG
HUBC is currently trading within a Bull Flag pattern, with the price encountering resistance below 118.30. Multiple resistance levels are preventing a breakout from the flag resistance zone. The price appears poised for a bearish reversal towards the levels of 111.80 to 102.70. It is probable that the flag channel's bottom support around 104 / 102 levels will be tested.
Consider selling with a STOPBUY set above 119.
Targets: 112.70, 111.30, 108.00, and 104.

HUBCHi Folks,
HUBC start has drawn an orderly consolidation that was worth to be reviewed
• A big move in the past 1-3 months anywhere from 30%-100% the rally last for a few days to weeks.
• Orderly consolidation with higher lows & tightening range
• RDM, VCP
• Stock surfs the rising EMA 10 or the EMA 20
• Volumes are significative compared to previous phase
• Volumes dry up at the end of the consolidation
• Volumes are strong during the breakout
This is a short term graph, exit should be considered when crossing down the EMA10

HUBC tumbled over 9.7% after a bearish pattern recognitionHUBC tumbled over 9.7% after a bearish pattern and death cross recognition.
Looks like Bouncing off from the support LINE and RSI as well. A short-term pullback can't be ruled out. Might retest to 80.60 - 82.00 levels.
HUBC a short-term pullback cant be ruled out

HUBC short-term longLooking for a swing here on HUBC for next week. This pink sheet comes in down big, there are some GD alerts on the 4-hr down but nothing on the Daily timeframe as of 3/30 Very Risky
