HYPE/USDT - Reversal Zone or Bearish Continuation?HYPE/USDT on the 12-hour timeframe remains in a clear medium-term downtrend. Price continues to trade below a well-defined descending trendline, which has been respected since the peak around the 49–51 USDT area. This structure confirms that sellers are still in control.
However, recent price action shows a reaction from the lower demand zone, signaling a critical decision area where the market may either reverse or continue its bearish trend.
---
Pattern Explanation
The dominant patterns visible on the chart include:
Descending Trendline (Bearish Market Structure)
Price consistently forms lower highs and lower lows, confirming a bearish trend.
Compression / Potential Descending Triangle
Price is compressing toward the trendline, indicating decreasing volatility and an upcoming breakout or rejection.
Minor Base Formation
A short-term consolidation is forming near the 22–25 USDT zone, showing early defensive buying pressure.
This type of structure often precedes a strong impulsive move.
---
Key Levels
Resistance Zones:
27.70 USDT → Descending trendline & short-term supply
29.80 USDT → Major horizontal resistance
34.70 USDT → Previous breakdown area
41.10 USDT → Mid-range resistance
49.20 – 51.48 USDT → Major supply & previous high
Support Zones:
25.00 USDT → Short-term support
22.19 USDT → Major demand zone & cycle low
---
Bullish Scenario
Price breaks and closes above the descending trendline (around 27.70 USDT) on the 12H timeframe.
Bullish confirmation becomes stronger if supported by increasing volume.
Upside targets:
29.80 USDT
34.70 USDT
41.10 USDT (extension target if momentum accelerates)
A confirmed breakout would shift the structure from lower highs to higher highs, signaling a trend reversal.
---
Bearish Scenario
Price fails to break the trendline and gets rejected near the 27.70 USDT area.
This rejection would confirm bearish trend continuation.
Downside targets:
25.00 USDT
22.19 USDT (critical support)
A breakdown below 22.19 USDT with strong volume could trigger a deeper sell-off.
---
Conclusion
HYPE/USDT is currently trading at a major decision zone. The descending trendline remains the key level that will determine the next directional move.
Breakout = potential trend reversal
Rejection = bearish continuation
Patience and confirmation are essential before taking positions.
---
#HYPEUSDT #Hyperliquid #CryptoAnalysis #TechnicalAnalysis #DescendingTrendline #TrendReversal #BearishMarket #BullishBreakout #AltcoinTrading
Hype

Hypeusd1st cycle looks near completion
This ones definitely going to be multi cycle theres no way to recreate a fair distribution for these kind of protocols barring a first round airdrop before theres too many farmers...
Modular perp liquidity layer1 with all the frills, battletested and anyone can can launch their own market.. so many sinks the supply drain is already starting to kick in
Next cycle will be massive..

HYPE – At a Crossroads After a Small Weekly GainHYPE wrapped up the week in green with a modest +2% gain, but the broader picture remains cautious. Price action is still capped by the $26 resistance, a key level that needs to be broken for any real bullish momentum to emerge. Until then, upside moves may continue to stall.
🔻 Downtrend Still Dominates
Since late September, HYPE has been in a strong downtrend, losing over 60% of its value. That said, the asset found strong support at $22, which triggered a recent bounce. This support zone now serves as a critical level to hold if bulls hope to defend against further losses.
⚠️ Outlook: Weak Until Key Levels Break
Despite the bounce, the downtrend structure is still intact. Bulls need to reclaim $26, and ideally make a strong push above $30, to suggest a trend reversal and spark broader interest. Until that happens, rallies may remain short-lived and corrective in nature.
🕵️♂️ Keep an eye on price action around $26–$30 for confirmation of any shift in trend.

HYPE – Weekly Structure Price got rejected from a major weekly resistance
Clear distribution at the highs → structure shifted bearish
Previous support has flipped into resistance (R/S flip)
As long as price stays below this level, downside pressure remains valid
Price is currently consolidating above a local support zone
This area is critical for short-term direction
If support fails on a weekly close, continuation to the downside becomes likely
Bullish scenario only activates if price reclaims resistance and holds
Level-to-level market
No prediction — wait for confirmation. Monitor on the LTF
What’s your bias from here: support hold or further continuation?
MrC

$HYPE Unlock: $25 Holds or FoldsRoughly 1.2M HYPE (around $33M) is being unstaked for distribution on Jan 6, which introduces a clear risk of near-term selling pressure.
Structurally, price is still holding the $25 area as a floor base, keeping upside potential in play for now.
We’ve seen multiple attempts to break above the $26 resistance, and while it has capped price so far, a clean hold above $25 could still allow a short-term push toward the $28–30 zone.

HYPEUSDT Breakout Confirmed. Ascending Triangle + EMA SupportKUCOIN:HYPEUSDT has recently broken out of an Ascending Triangle pattern on the 4-hour timeframe, indicating a potential shift toward bullish continuation. This pattern reflects sustained higher lows with strong horizontal resistance, and the breakout suggests buyers are now in control.
Price action is currently holding comfortably above the 50 EMA, which is acting as a dynamic support. This confirms bullish structure and increases the probability of continuation rather than a false breakout. Any healthy pullback toward the breakout zone or EMA may provide a better risk-reward opportunity.
In addition to technical strength, volume has expanded noticeably, supporting the validity of the breakout. Since GETTEX:HYPE is a #DEX platform token, the recent increase in platform activity and participation adds a fundamental tailwind to the bullish setup.
Overall bias remains bullish as long as price sustains above the breakout structure. Traders should continue to manage risk properly and keep a strict stop loss, as crypto markets remain highly volatile. This setup favors disciplined execution rather than aggressive leverage.
GETTEX:HYPE Currently trading at $25.8
Buy level : Above $25.5
Stop loss : Below $23
Target 1: $28
Target 2: $30
Target 3: $32
Target 4: $36
Max leverage 3x
Always keep stop loss
Follow Our Tradingview Account for More Technical Analysis Updates, | Like, Share and Comment Your thoughts

HYPE Mirrors ORDI’s Bearish Top — Lower Targets AheadThe structure on HYPE looks very similar to what we previously saw on ORDI. Both assets formed a clear bearish reversal structure at their local highs, followed by a breakdown from a rising wedge.
Based on this price action, I wouldn’t consider buying HYPE here — the chart suggests that it’s only a matter of time before the price continues moving lower.
My primary downside targets are:
$13–12
$6.6–5
Until the market shows a confirmed shift in structure, the trend remains bearish.

HYPEUSDT - Probably Gone by the Time You Read This Alright traders, this is one of those setups.
Quick scalp…
or quick dump…
and honestly, it will probably be gone by the time I finish writing this analysis. 😅
But hey — let’s try it anyway.
Macro just came out mixed,
which usually means range mode activated.
And when the market ranges,
HYPE loves to do its little chaotic moves inside the box.
So yeah:
• fast idea
• fast execution
• zero attachment
I don’t even have much time to explain this one properly,
because it’s probably already moving as we speak. 😂
Quick analysis, quick decision, quick outcome.
Enjoy — and good luck traders! 🚀📉😄

HYPERLIQUID Is it getting a relief rally?A month ago (November 13, see chart below), we gave a strong Sell Signal on Hyperliquid (HYPEUSD) after the Head and Shoulders (H&S) pattern turned into an obvious Channel Down, which easily hit our $30.00 Target:
Now we see some short-term relief before the next, larger drop as not only did the price make contact with the bottom (Lower Low trend-line) of the Channel Down, but also the 1D RSI is displaying the same kind of bottoming sequence it did on October 17.
Even though the resulting rebound/ Bullish Leg rose by +50.50%, even breaking above the 0.618 Fibonacci retracement level, this time the move might be limited by the 1D MA50 (blue trend-line) posing as a Resistance, even though the 1D MA100 (green trend-line) is the standard long-term one during Bear Cycles.
In any event, our 'modest' short-term Target for this bounce is $33.00.
---
** Please LIKE 👍, FOLLOW ✅, SHARE 🙌 and COMMENT ✍ if you enjoy this idea! Also share your ideas and charts in the comments section below! This is best way to keep it relevant, support us, keep the content here free and allow the idea to reach as many people as possible. **
---
💸💸💸💸💸💸
👇 👇 👇 👇 👇 👇

ONE Chart. SIX targets. Thats HYPE!The hyperliquid chart is showing signs of a head and shoulders pattern.
#HYPE has certainly garnered significant attention and acclaim for being one of the few altcoins to experience a surge this cycle.
This is due to the development of an innovative product: a decentralized perpetual DEX.
It has achieved product-market fit.
Receiving considerable attention on X.
However, it is not larger than the ongoing cycle.
At one point, they were purchasing $83M worth of tokens each month—this is why it has created a distorted head and shoulders pattern with multiple necklines.
Yet, in the world of crypto, if you develop something useful,
the code, idea, or platform will inevitably be replicated.
This highlights the fundamental issue with altcoins: the absence of a competitive moat and long-term sustainability.
Recently, they began unlocking a substantial amount of tokens, and it is likely that the team is offloading them through OTC transactions.
While innovation and profitable dapps are commendable... they can also become problematic.
Here are some bear targets for your consideration.
Which you can use to your advantage on their perp DEX ;)

HYPEUSD - Rounded Top Turned BullishAn example of a rounded top forming
These tend to break out bullishly once finished forming which I have shown with the bars pattern in green
It will be awhile most likely until breakout occurs as the rounded top isn't finalized
This is the 4Hr chart but the Rounded formation can be seen forming on the daily easily enough

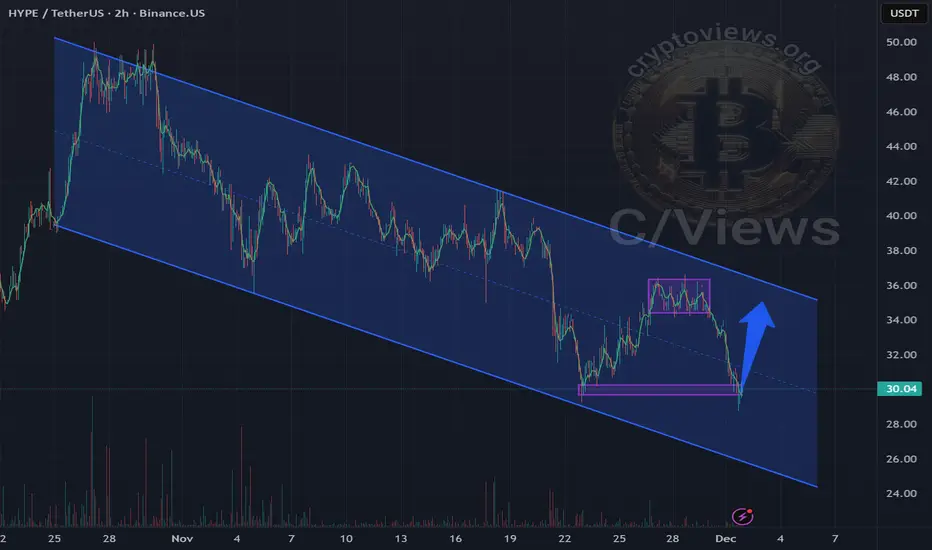
Hyperliquid still on a downtrend until its not. HYPE is still moving within a clear descending channel, but the structure is starting to tighten.
Price has bounced from the lower end of the channel and is now consolidating beneath mid-range resistance. This kind of compression usually precedes a larger move.
Momentum is improving. Indicators are holding higher lows while price moves sideways, showing that downside pressure is fading. Selling into this area continues to get absorbed rather than accelerated.
From a structure standpoint, holding the lower channel keeps the range-reclaim scenario intact. A push back through the middle of the range would shift the bias toward the upper end, while losing support would put the downtrend back in control.
This is a key area where patience matters. Direction should become clearer on the next expansion.
What’s your take on HYPE from here?

HYPE price analysis#HYPE Third attempt to form a bottom — will it hold above $36?
The price of OKX:HYPEUSDT is again testing the same demand zone where two previous rebounds were formed.
At the moment, the key factor remains unchanged:
Key Levels
$36 — critical level that must be reclaimed and held
$49–50 — realistic short-term target if momentum flips
Breakdown below current support would open room for a deeper retrace
A successful breakout above $36 would confirm buyer strength and could trigger a short-term rally into the New Year period.
Question: Do you expect #HYPE to reclaim $36 and move toward $50, or is another sweep of the lows more likely?
______________
◆ Follow us ❤️ for daily crypto insights & updates!
🚀 Don’t miss out on important market moves
🧠 DYOR | This is not financial advice, just thinking out loud

$HYPE - Swing Point RetestThere’s been a lot of noise around Hyperliquid lately as it slowly gives up market share, and the price action is starting to show that pressure. The real issue here looks structural rather than just sentiment-driven. New competition from platforms like Lighter and Variational is absorbing retail flow, and fewer traders seem willing to tolerate higher fees. That shift has led to a sharp drop in Hyperliquid’s volumes and fee generation — both crucial components of its valuation.
TECHNICAL OUTLOOK:
KUCOIN:HYPEUSDT just hit its lowest level since May 21, with several large leveraged positions sitting in the $20–$30 zone. With so much open interest vulnerable below price, it makes sense that buyers are cautious. Polymarket is currently pricing a 56% chance of HYPE trading below $24, which lines up with the prevailing downtrend.
On the 1-hour timeframe, price is capped around $29.5. If it can’t reclaim that level soon, a move back toward $28.4–$28 looks likely. In the short term, a clean swing-point retest at $28 — or even a dip toward $27.5 — could offer a decent long setup.

HYPE Update📊 HYPE Update
HYPE tried to push through the red resistance zone 🔴 but couldn’t break out.
Price has been rejected at this level, showing it remains a strong barrier ⚠️📉.

FireHoseReel | HYPE on 0.618 Fibonacci Decision Zone🔥 Welcome To FireHoseReel !
Let’s jump into HyperLiquid (HYPE) market analysis.
👀 HYPE 1H Overview
HYPE is currently trading near a key support zone and is forming a lower low compared to the previous bottom. This area also aligns with the 0.618 Fibonacci retracement, making it a critical reaction zone.
📊 Volume Analysis
HYPE volume has dropped significantly. The first strong increase in volume is likely to define the next major move. Volume is the most reliable confirmation here.
✍️ HYPE Trading Scenarios
🟢 Long Scenario:
A breakout above $35.945, either through a short squeeze or strong buy volume, can activate a bullish move to the upside.
🔴 Short Scenario:
A breakdown below the current support near $33.179 with rising sell volume can trigger a solid short setup.
🧠 Protect your capital first. No setup is worth blowing your account. If risk isn’t controlled, profit means nothing. Trade with rules, not emotions.

HYPE Approaching Key Reversal ZoneHYPE is approaching a critical decision zone after a long corrective move inside a descending channel. Price has returned to the mid-range supply zone, where previous reactions created strong turning points. This area now acts as the major pivot for the next directional leg.
After the recent liquidity sweep, the market is showing early signs of stabilization. The reaction inside the demand pocket indicates that buyers are slowly stepping in, although the overall structure is still corrective until the mid-range is reclaimed.
The next movement will likely be defined by how price behaves around the highlighted zone.
Key Technical Points
• Price has reached a major mid-range supply block
• Reaction from the lower channel boundary confirms buyer interest
• A break above the supply zone unlocks momentum toward the upper channel
• Failure to reclaim the zone risks a deeper sweep toward lower liquidity levels
• Volatility is expected as price compresses inside the range
Bullish Scenario
If price reclaims the shaded zone with sustained strength, HYPE may initiate a trend reversal. This can open the door for a move toward the channel top and ultimately toward the 50-52 region.
Bearish Scenario
If rejection occurs from this zone, price may rotate back toward the lower boundary of the channel. A deeper sweep of liquidity can occur before any strong reversal attempt.
Simple View
HYPE is sitting at a decisive supply zone. Reclaiming it leads to upside continuation. Rejecting it leads to another leg down. This is a pivotal moment.

HYPE forming a bullish flag with consolidationHYPE continues to move within a global bull flag pattern
Currently, the price is declining to the liquidation zone (lower purple area)
The price is consolidating at this level
A liquidity zone has formed above, which is more likely to be taken
The movement will likely continue to its upper boundaries
Current price: $28.86
TradeCityPro | HYPE Near Breakdown Zone, Bears Gaining Control👋 Welcome to TradeCityPro!
In this analysis, I want to review HYPE, one of the well-known decentralized exchanges in crypto. The exchange’s native token currently has a $10.46 billion market cap, ranking 11th on CoinMarketCap.
🗓 Daily Timeframe
On the daily timeframe, this coin had been moving inside a rising channel, which was already broken in the previous analysis, and we were waiting for its trigger to activate.
✔️ The trigger for confirming the channel breakdown was 36.682, but since there was a major support zone right beneath it, we needed to wait for the price to stabilize below that support to confirm a bearish trend.
📊 After reacting to 36.682, the price made a deep pullback to the channel, and after getting rejected from the channel again, it continued moving downward.
💥 Following this pullback, the RSI dropped back below the 50 level, signaling a return of bearish momentum, and all that remained was a price confirmation for the downtrend to fully establish.
🧮 After breaking 36.682, the price reached the $30 zone for the first time and reacted to it. Currently, after pulling back to 36.682, the price looks ready to continue its bearish move.
🔔 The confirmation for HYPE turning fully bearish comes with a break of 29.9.
Once this level breaks, we can open a short position.
⚖️ RSI staying below 50 and avoiding any overbought conditions — along with weak buying volume — are strong signs that the bearish trend can continue.
As long as RSI remains under the 50 zone, the market structure remains bearish in my view.
📝 Final Thoughts
Stay calm, trade wisely, and let's capture the market's best opportunities!
This analysis reflects our opinions and is not financial advice.
Share your thoughts in the comments, and don’t forget to share this analysis with your friends! ❤️

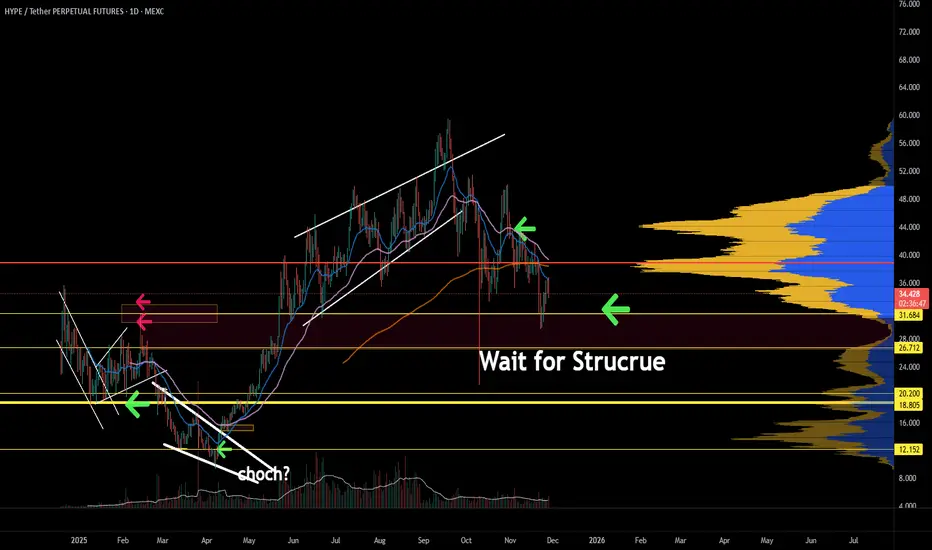
Hyperliquid needs to prove itself. HYPE just lost its mid-range support and is now tapping a major high-volume node on the VPVR. This zone is historically where buyers stepped in, but structure hasn’t confirmed a reversal yet.
🔻 Momentum: Multiple overbought rejections on the oscillator + MACD still crossing down.
🔻 Trend: Breakdown from the rising channel + failure to hold EMAs.
🟧 Current Zone: Price is sitting inside a heavy demand block, but weakness persists.
🟩 Bull Case:
Watch for a clean market structure shift (higher low + higher high) before calling the bottom. Without confirmation, this can easily drift lower into the next liquidity pocket.
🟥 Bear Case:
A rejection at this level sends HYPE into the deeper value area below. There’s not much volume support until the lower yellow band.
📌 Summary:
This is a high-interest zone, but not a high-confidence one yet.
Wait for structure. Let the reversal prove itself.
HYPE Update🚨📊 HYPE Update
HYPE is testing the red resistance zone right now 🔴.
If price manages to break out above this red level,
the first target will be the green line level 🟢 —
the next key zone on the chart.

HYPE — Updated Long ScenarioDespite the fact that in my previous publication HYPE broke through my invalidation zone, the overall long picture has not been destroyed — on the contrary, HYPE has actually strengthened its bullish intentions.
With this update, my target has been moved slightly higher.
🎯 New target: 37
❌ Invalidation zone: 31.78
Let’s see how the price action unfolds from here. As always, this is not financial advice — just my personal view.

HYPE — Impulse Loading In my view, HYPE is about to start a new impulse movement. The structure looks like it’s gaining momentum, and I’m watching it very closely.
📌 My target: 36.5
❌ Plan invalidation zone: 32.499
I also believe that HYPE has the potential to move even higher than my target, but first let’s see how exactly the price approaches level 36,5.
I’ll be posting updates along the way as the chart develops.
Stay tuned! 🚀📈
