COW/USDT — This Demand Zone Could Decide the Next Move?📐 Pattern Analysis (Detailed Explanation)
🔻 1. Descending Trendline (Major Resistance)
The downward-sloping yellow line shows consistent selling pressure
Every upward move has been capped → Lower Highs
This trendline acts as a dynamic key resistance
👉 A break above the trendline = early signal of trend change
---
🟨 2. Strong Demand Zone (0.22 – 0.19)
This area has:
Repeatedly held price from further decline
Triggered strong bullish reactions in the past
Indicates buyer accumulation (smart money area)
👉 As long as price holds above 0.19, reversal potential remains valid
---
🔄 3. Price Structure
Previous structure: Lower Highs + Lower Lows (Bearish)
Current structure: Base formation / ranging phase
This suggests:
Selling pressure is weakening
Buyers are gradually absorbing supply
---
🟢 Bullish Scenario (Reversal / Breakout)
Bullish Confirmation Requirements:
1. Price holds above 0.22
2. Strong breakout and close above the descending trendline
3. Ideally supported by increasing volume
Upside Targets:
🎯 0.267
🎯 0.325
🎯 0.367
🎯 0.458 (Major Resistance)
📌 A valid breakout may shift the market from bearish into bullish continuation.
---
🔴 Bearish Scenario (Support Breakdown)
Bearish Conditions:
1. Daily / 2D close below 0.19
2. Failure of the demand zone
3. No significant bullish reaction from buyers
Downside Targets:
📉 0.16
📉 0.13 (Previous low / extreme support)
📌 A breakdown below the demand zone signals bearish continuation and invalidates the reversal setup.
---
🧠 Technical Conclusion
COW/USDT is currently at a key decision-making zone
Best risk–reward lies within the demand zone (0.22–0.19)
Trendline breakout → early bullish signal
Demand breakdown → bearish continuation
⚠️ Wait for candle confirmation and volume validation before entering.
---
#COWUSDT #CryptoAnalysis #TechnicalAnalysis #Altcoin #DescendingTrendline #DemandZone #SupportResistance #PriceAction
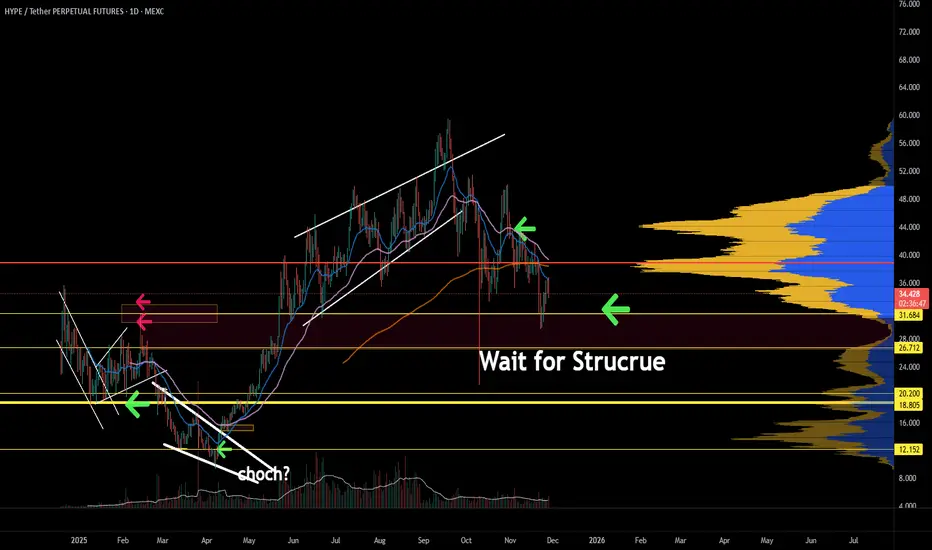
Hyperliquid

HYPEUSDT Breakout Confirmed. Ascending Triangle + EMA SupportKUCOIN:HYPEUSDT has recently broken out of an Ascending Triangle pattern on the 4-hour timeframe, indicating a potential shift toward bullish continuation. This pattern reflects sustained higher lows with strong horizontal resistance, and the breakout suggests buyers are now in control.
Price action is currently holding comfortably above the 50 EMA, which is acting as a dynamic support. This confirms bullish structure and increases the probability of continuation rather than a false breakout. Any healthy pullback toward the breakout zone or EMA may provide a better risk-reward opportunity.
In addition to technical strength, volume has expanded noticeably, supporting the validity of the breakout. Since GETTEX:HYPE is a #DEX platform token, the recent increase in platform activity and participation adds a fundamental tailwind to the bullish setup.
Overall bias remains bullish as long as price sustains above the breakout structure. Traders should continue to manage risk properly and keep a strict stop loss, as crypto markets remain highly volatile. This setup favors disciplined execution rather than aggressive leverage.
GETTEX:HYPE Currently trading at $25.8
Buy level : Above $25.5
Stop loss : Below $23
Target 1: $28
Target 2: $30
Target 3: $32
Target 4: $36
Max leverage 3x
Always keep stop loss
Follow Our Tradingview Account for More Technical Analysis Updates, | Like, Share and Comment Your thoughts

SPK/USDT — Price at Critical Support: Breakdown or Reversal?SPK/USDT on the daily timeframe (1D) remains in a clear downtrend (bearish trend) since the peak around 0.19 USDT. Price continues to form lower highs and lower lows, indicating strong seller dominance. Currently, price is trading near a major historical support zone, which may act as a key technical reaction area.
---
Pattern & Price Structure
Descending Channel / Modified Falling Wedge
Price is moving within a broad descending channel, characterized by:
Upper line: dynamic resistance (descending trendline)
Lower line: medium-term dynamic support
This structure represents a bearish continuation pattern, although a potential reversal could occur if price breaks above the upper trendline with strong confirmation and volume.
---
Key Levels
Support:
0.0220 – 0.0210 (current support / demand area)
0.0189 (historical low / extreme support)
Resistance:
0.0295
0.0320
0.0350
0.0455 (strong resistance / supply zone)
---
Bullish Scenario
Price holds above the 0.021 – 0.022 area and forms:
higher low
bullish engulfing / strong rejection candle
A valid breakout above the descending trendline
Upside targets:
0.0295
0.0320
0.0350
Extension: 0.0455
This scenario would indicate a relief rally or the early stage of a recovery phase.
---
Bearish Scenario
Price fails to hold above the 0.021 area
Strong daily candle close below support
Further downside potential toward:
0.0189
If broken, risk of bearish price discovery (new lows)
This scenario confirms bearish continuation with sustained seller control.
---
Conclusion
SPK/USDT remains in a medium-term bearish phase, but price is currently sitting at a critical decision zone. This area will determine whether the market experiences a technical rebound or continues its downward expansion. Clear breakout or breakdown confirmation is essential before taking any trading decision.
---
#SPKUSDT #SPK #CryptoAnalysis #TechnicalAnalysis #Altcoin #DescendingChannel #BearishTrend #BullishReversal #SupportResistance

HYPE Mirrors ORDI’s Bearish Top — Lower Targets AheadThe structure on HYPE looks very similar to what we previously saw on ORDI. Both assets formed a clear bearish reversal structure at their local highs, followed by a breakdown from a rising wedge.
Based on this price action, I wouldn’t consider buying HYPE here — the chart suggests that it’s only a matter of time before the price continues moving lower.
My primary downside targets are:
$13–12
$6.6–5
Until the market shows a confirmed shift in structure, the trend remains bearish.

HYPERLIQUID Is it getting a relief rally?A month ago (November 13, see chart below), we gave a strong Sell Signal on Hyperliquid (HYPEUSD) after the Head and Shoulders (H&S) pattern turned into an obvious Channel Down, which easily hit our $30.00 Target:
Now we see some short-term relief before the next, larger drop as not only did the price make contact with the bottom (Lower Low trend-line) of the Channel Down, but also the 1D RSI is displaying the same kind of bottoming sequence it did on October 17.
Even though the resulting rebound/ Bullish Leg rose by +50.50%, even breaking above the 0.618 Fibonacci retracement level, this time the move might be limited by the 1D MA50 (blue trend-line) posing as a Resistance, even though the 1D MA100 (green trend-line) is the standard long-term one during Bear Cycles.
In any event, our 'modest' short-term Target for this bounce is $33.00.
---
** Please LIKE 👍, FOLLOW ✅, SHARE 🙌 and COMMENT ✍ if you enjoy this idea! Also share your ideas and charts in the comments section below! This is best way to keep it relevant, support us, keep the content here free and allow the idea to reach as many people as possible. **
---
💸💸💸💸💸💸
👇 👇 👇 👇 👇 👇

HYPEUSD - Rounded Top Turned BullishAn example of a rounded top forming
These tend to break out bullishly once finished forming which I have shown with the bars pattern in green
It will be awhile most likely until breakout occurs as the rounded top isn't finalized
This is the 4Hr chart but the Rounded formation can be seen forming on the daily easily enough

Hyperliquid still on a downtrend until its not. HYPE is still moving within a clear descending channel, but the structure is starting to tighten.
Price has bounced from the lower end of the channel and is now consolidating beneath mid-range resistance. This kind of compression usually precedes a larger move.
Momentum is improving. Indicators are holding higher lows while price moves sideways, showing that downside pressure is fading. Selling into this area continues to get absorbed rather than accelerated.
From a structure standpoint, holding the lower channel keeps the range-reclaim scenario intact. A push back through the middle of the range would shift the bias toward the upper end, while losing support would put the downtrend back in control.
This is a key area where patience matters. Direction should become clearer on the next expansion.
What’s your take on HYPE from here?

HYPE price analysis#HYPE Third attempt to form a bottom — will it hold above $36?
The price of OKX:HYPEUSDT is again testing the same demand zone where two previous rebounds were formed.
At the moment, the key factor remains unchanged:
Key Levels
$36 — critical level that must be reclaimed and held
$49–50 — realistic short-term target if momentum flips
Breakdown below current support would open room for a deeper retrace
A successful breakout above $36 would confirm buyer strength and could trigger a short-term rally into the New Year period.
Question: Do you expect #HYPE to reclaim $36 and move toward $50, or is another sweep of the lows more likely?
______________
◆ Follow us ❤️ for daily crypto insights & updates!
🚀 Don’t miss out on important market moves
🧠 DYOR | This is not financial advice, just thinking out loud

$HYPE - Swing Point RetestThere’s been a lot of noise around Hyperliquid lately as it slowly gives up market share, and the price action is starting to show that pressure. The real issue here looks structural rather than just sentiment-driven. New competition from platforms like Lighter and Variational is absorbing retail flow, and fewer traders seem willing to tolerate higher fees. That shift has led to a sharp drop in Hyperliquid’s volumes and fee generation — both crucial components of its valuation.
TECHNICAL OUTLOOK:
KUCOIN:HYPEUSDT just hit its lowest level since May 21, with several large leveraged positions sitting in the $20–$30 zone. With so much open interest vulnerable below price, it makes sense that buyers are cautious. Polymarket is currently pricing a 56% chance of HYPE trading below $24, which lines up with the prevailing downtrend.
On the 1-hour timeframe, price is capped around $29.5. If it can’t reclaim that level soon, a move back toward $28.4–$28 looks likely. In the short term, a clean swing-point retest at $28 — or even a dip toward $27.5 — could offer a decent long setup.

HUMA/USDT – Reversal Incoming or Deeper Breakdown?HUMA has been moving inside a large Descending Channel for months, forming a repeated yet controlled pattern of selling pressure. Every rally has consistently failed to break the upper trendline, maintaining a strong lower-high structure. But now, something important is happening:
👉 Price is sitting directly above the Key Support at 0.025–0.0225, a long-standing “life-or-death” zone for buyers.
This is not just another support — this is the final defense before a major structural breakdown or a powerful market reversal.
---
🔶 Clear Technical Structure
1. Descending Channel (Major Trend)
The trend remains bearish, but the channel is tightening — an early sign of momentum shift.
2. Key Support Box (0.025–0.0225)
This zone has acted as a strong demand area multiple times.
The more it gets tested, the bigger the potential move — either a breakout upward or a sharp breakdown.
3. Midline Reaction
Price frequently reacts around the midline, showing that market participants are respecting this dynamic level.
4. Key Horizontal Targets
0.031 → 0.037 → 0.0445 → 0.055 → 0.067
These levels are not only resistance but also potential rally checkpoints if structure shifts bullish.
---
🟢 Bullish Scenario (Major Reversal Potential)
Bullish bias becomes valid only if:
1. Price breaks the upper trendline with clean momentum.
A breakout without volume is not valid.
2. Daily close above 0.031.
This confirms the long-term downtrend is weakening.
If confirmed, bullish targets:
TP1: 0.037 (nearest resistance, minor rejection zone)
TP2: 0.0445 (major structural resistance)
TP3: 0.055 (bullish structure activation)
TP4: 0.067 (high-value upside target)
Bullish Intent
The channel has extended for a long period — sellers may be exhausted.
Price is stabilizing near strong support.
Large reversals often begin from areas like this.
---
🔴 Bearish Scenario (Trend Continuation)
Bearish momentum continues if:
Daily close falls below 0.0225.
This would indicate the final support has failed.
Bearish downside targets:
T1: 0.018 (mid-to-lower channel zone)
T2: 0.015–0.0135 (lower boundary, potential capitulation sweep)
Bearish Intent
The Descending Channel remains dominant.
Selling pressure is still strong near the upper trendline.
Losing the key support can trigger panic-driven moves.
---
🎯 Market Psychology
The 0.025–0.0225 level currently represents:
A slow accumulation zone for smart money, or
A distribution zone before continuation downward
At this stage, the market is choosing its next direction — and the move that follows this zone is usually significant.
---
#HUMA #HUMAUSDT #CryptoAnalysis #TechnicalAnalysis #DescendingChannel #ReversalZone #BreakoutWatch #CryptoTrading #AltcoinAnalysis #MarketStructure #SupportAndResistance #ChartPatterns

Hyperliquid needs to prove itself. HYPE just lost its mid-range support and is now tapping a major high-volume node on the VPVR. This zone is historically where buyers stepped in, but structure hasn’t confirmed a reversal yet.
🔻 Momentum: Multiple overbought rejections on the oscillator + MACD still crossing down.
🔻 Trend: Breakdown from the rising channel + failure to hold EMAs.
🟧 Current Zone: Price is sitting inside a heavy demand block, but weakness persists.
🟩 Bull Case:
Watch for a clean market structure shift (higher low + higher high) before calling the bottom. Without confirmation, this can easily drift lower into the next liquidity pocket.
🟥 Bear Case:
A rejection at this level sends HYPE into the deeper value area below. There’s not much volume support until the lower yellow band.
📌 Summary:
This is a high-interest zone, but not a high-confidence one yet.
Wait for structure. Let the reversal prove itself.
FireHoseReel : ENA : Ethena Charging Toward Daily Resistance🔥 Welcome FireHoseReel !
Let’s dive into the ENA setup and break down the key levels.
👀 ENA – 4H Timeframe Analysis
ENA is approaching its daily resistance on the 4H chart, and a confirmed breakout above this level can activate our long trigger and push price higher with momentum.
📊 Volume Analysis
ENA showed a clear volume increase during the breakout of its descending pattern (falling channel) — an early signal that a new bullish phase could be forming.
However, breaking the nearby daily resistance requires another strong wave of buy volume; without it, price may face rejection.
🔁 ENA/BTC – A Different Perspective Looking at ENA/BTC, we can see that this pair is also moving toward a key daily resistance level, just like ENA/USDT.
A breakout on the BTC pair could accelerate momentum and help ENAUSDT trigger earlier.
The structural overlap between the two charts gives strong confluence and increases confidence in our setups.
📌 Trading Scenarios
🔼 Long Scenario
• Daily resistance at 0.2814 breaks
• Buy volume increases
• Volume convergence forms after the breakout
• This activates the long trigger and may lead to higher continuation.
🔽 Short Scenario
cal support at 0.2267 breaks
• Sellers gain control and strong sell pressure appears
• This scenario can trigger a deeper sell-off.
🎯 Personal View
I personally prefer the long scenario, especially since ENA was recently listed on Hyperliquid Spot, which may boost liquidity and accelerate upward momentum.
🛞 Risk Management & Disclaimer
Please remember to always use proper risk management and position sizing. Nothing in this analysis is financial advice. The market can change quickly, so always trade based on your own strategy, research, and risk tolerance. You are fully responsible for your own trades.

Still...Don't Believe the Hype - Hyperliquid's Problem...Hyperliquid has gotten a lot of attention with it's Decentralized way of bringing Crypto trading to the masses. But, we've been analyzing this from a technical perspective and there is still too much Hype right now. Please see my previous analysis on this from 11/8/25....attached.
The Hype problem continues and we have seen a drop to near a daily FVG zone that is giving a "dead cat bounce". But, this is only temporary, and the target is still the Weekly Source Zone ~ $14.50. That's a hard pill to swallow, but there is not much of anything to keep us from falling that far. There is another Daily FVG around 21.50- 23.25, but that should only be another temporary bounce on the way down.
The Target we are seeking is again that Weekly Source zone from ~ $10 - $14. That's a relatively large range, so to fine tune that even more, I would target the $10 - $12, because that is the Daily Source within that weekly zone.
So, overall, hold those shorts and ride the coaster down to these levels. Any bullish responses on the way are only the necessary pullbacks to give us the thrill of the fall.

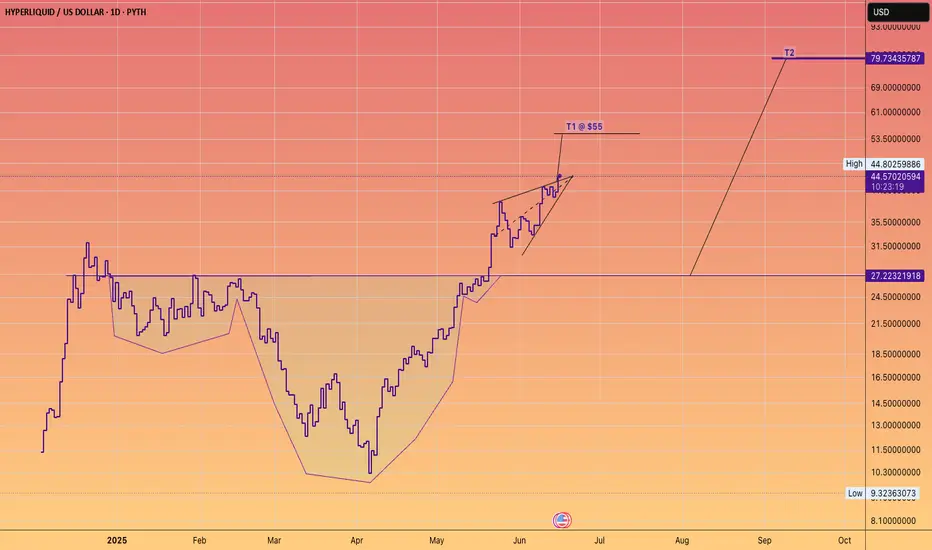
HYPEUSDT - up trend start?If you like the idea, please put a ‘like’. It's the best ‘Thank you!’ 😊 P.S. Always do your own analysis before a trade. Set a stop loss. Capture profits in instalments. Withdraw profits in fiat and make yourself and your friends happy.

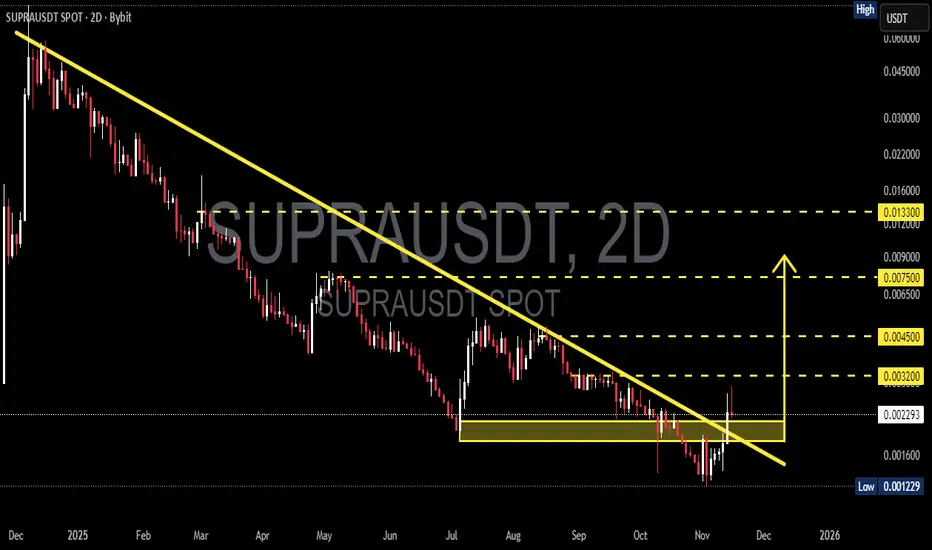
SUPRA/USDT — Trendline Breakout at Critical: Is Major Reversal?SUPRA has spent nearly a full year trapped under a relentless descending trendline—each rally attempt crushed, each bounce rejected. But for the first time since early 2025, the 2-day candle has broken above the dominant descending trendline, signaling a potential structural shift in market momentum.
This breakout occurred precisely after SUPRA revisited the major demand block at 0.00215–0.00180, a region that has repeatedly acted as the survival zone for this asset. The reaction from this area suggests renewed accumulation and a clear transfer of strength from sellers back to buyers.
SUPRA is now entering the most critical stage of its 2025 chart structure:
Is this a genuine trend reversal—or just another liquidity trap disguised as a breakout?
---
PATTERN STRUCTURE: “Descending Trendline Break + Demand Zone Rejection”
This combination is historically one of the strongest reversal structures, especially after prolonged downtrends.
1. Descending Trendline Breakout
The yellow trendline has suppressed price since early 2025.
The 2D breakout is a strong early reversal signal.
However, the wick on the breakout candle shows that sellers aren’t fully gone—momentum still needs confirmation.
2. Strong Demand Block (0.00215–0.00180)
This yellow box represents
high-volume reaccumulation,
liquidity sweeps,
structural support
that has repeatedly reset the market’s short-term direction.
3. Mid-Term Market Structure Shift (MSS)
A breakout + higher low formation near demand suggests the foundation of a larger bullish transition.
---
Bullish Scenario: “The Ingredients of a Full Trend Reversal”
SUPRA may be forming the early stages of a multi-week bullish reversal if the following conditions are respected:
1. Holding Above 0.00215
This is the line between “breakout confirmed” and “breakout failed.”
2. Successful Retest of Trendline or Demand Zone
A clean rejection wick from this zone would signal buyers stepping in aggressively.
3. Bullish Targets Based on Chart Structure
If the breakout is real, SUPRA has a clear ladder of upside targets:
Target Description
0.00320 First resistance / short-term reaction zone
0.00450 Major historical supply area
0.00750 Mid-range structural resistance
0.01330 Full trend reversal target
Bullish Narrative
A stable 2D close above 0.00230–0.00250 would mark the beginning of a mid-term trend reversal, opening the path toward multi-target rallies.
---
Bearish Scenario: “False Breakout Liquidity Trap”
Despite the breakout, danger remains:
1. Closing Below 0.00215
This would signal weakness and invalidate early bullish momentum.
2. Closing Below 0.00180 (Major Breakdown)
If the candle closes below the lower demand boundary, SUPRA risks sliding toward:
0.00123 (the next major low on the chart)
or even forming new lower lows
Bearish Narrative
If sellers reclaim the demand zone, the reversal collapses and the long-term downtrend resumes.
---
Summary
SUPRA is at one of its most defining technical moments of 2025.
The trendline breakout is only the first chapter of this story—the real decision will be made at the 0.00215–0.00200 retest.
If the zone holds, SUPRA isn’t just escaping a downtrend—it may be entering a full multi-week reversal phase aimed at 0.00320 → 0.00450 → 0.00750 and beyond.
But if it closes below 0.00180, the entire bullish structure erases and the downtrend resumes.
---
#SUPRA #SUPRAUSDT #CryptoAnalysis #Breakout #TrendlineBreak #Altcoin #MarketStructure #DemandZone #ReversalSetup
Do you want to be a Millionaire ?Hi Guys,
This bull run has been very unusual with Bitcoin reaching record highs while the altcoins are watching from the sidelines, considering Gold,Stocks, and pretty much every other assets are
At ATH and the current AI bubble (ticking time bomb) I think all markets are due to crash very soon!
So I've been comparing current BTC chart with all types of other assets and I came to the conclusion that Nvidia 2000-2010 chart looks very similar to what we have in Bitcoin right now!
Is Bitcoin following Nvidia's (Dot Com) bubble crash ? Both charts looks extreamly similar
And Bitcoin has already broke below the weekly 50MA and the current chart pattern looks like a huge Head & shoulders are forming on the monthly period.
Even Michel Burry is shorting the AI bubble right now and the crypto community detected a suspiciouse activity on Microstrategy's Bitcoin wallets!
So I think this is it boys ..its the opportunity of the century to achieve financial freedom and
I refuse to live in denial and "HODL" like what most of us did in the previouse bear markets.
Feel free to leave a comment and let me know what you think about this idea !

HYPERLIQUID Massive H&S targets $30 and $19 long-term.Hyperliquid (HYPEUSD) has formed a Head and Shoulders (H&S) pattern, a highly symmetrical structure that is has completed its Right Shoulder. At the same time, a Channel Down has emerged that is aiming for a -43.87% decline on the current Bearish Leg, similar to the previous one, targeting $30.00 short-term.
The H&S long-term Target is the 2.0 Fibonacci extension, which as you can see matches the 0.618 Fib from the April 07 bottom. That gives a $19.00 Target.
Notice the huge 1D RSI Bearish Divergence of Lower Highs since May 25, which further strengthens the long-term bearish trend.
---
** Please LIKE 👍, FOLLOW ✅, SHARE 🙌 and COMMENT ✍ if you enjoy this idea! Also share your ideas and charts in the comments section below! This is best way to keep it relevant, support us, keep the content here free and allow the idea to reach as many people as possible. **
---
💸💸💸💸💸💸
👇 👇 👇 👇 👇 👇

SYRUP/USDT — The Make-or-Break Moment for Bulls?The SYRUP/USDT pair is now at a critical zone — after months of being trapped below the main descending trendline (yellow) since June, price is once again testing a key resistance area around 0.48–0.51 USDT.
Buyer momentum is starting to build, but the market has not yet given a confirmed breakout signal.
The latest candle shows a strong attempt to break above the trendline, but the big question remains:
➡️ Is this the start of a major trend reversal?
or
➡️ Just a classic rejection before another leg down?
---
🔼 Bullish Scenario — “The Breakout We’ve Been Waiting For!”
If price closes daily above 0.5095 and holds that level (successful retest), then the potential for a reversal becomes stronger.
Buyer strength could push the price toward:
🎯 Target 1: 0.5778
🎯 Target 2: 0.6265
🎯 Target 3: 0.6800 (previous swing high)
A confirmed breakout would mark the end of the lower-high structure and open the door to a mid-term uptrend rally.
Additional confirmation: rising volume & solid bullish candle bodies without long upper wicks.
---
🔽 Bearish Scenario — “False Breakout Trap?”
If price fails to break above 0.5095 or gets strongly rejected at the trendline (forming a bearish engulfing / rejection candle), the likelihood of a false breakout becomes high.
In this case, sellers may regain control and drive price lower toward:
⚠️ Support 1: 0.44
⚠️ Support 2: 0.36
⚠️ Support 3: 0.29
Failed breakouts are often followed by quick dumps, as trapped longs (bull traps) rush to exit positions. Beware of long wicks near resistance zones!
---
🧩 Structure & Pattern
The current setup forms a Descending Trendline Breakout Pattern, where the market is attempting to break through a long-term downward pressure line that has held for months.
This structure typically signals either:
Trend Reversal → if the breakout is confirmed.
Downtrend Continuation → if rejection occurs.
In short: A major momentum shift is building — direction awaits confirmation.
---
⚖️ Quick Summary
> “The market stands at a major crossroads. A confirmed breakout could trigger a trend reversal — but failure here might signal another bearish continuation. Stay disciplined, wait for confirmation, and manage risk wisely.”
#SYRUPUSDT #CryptoAnalysis #BreakoutAlert #TechnicalAnalysis #TrendReversal #CryptoTrading #PriceAction #ChartPattern #BullishScenario #BearishScenario #CryptoTrader #AltcoinWatch

SPK/USDT – Final Pressure Before a Major Breakout?The market is watching SPK/USDT closely as it approaches a make-or-break zone.
After months of steady decline under a well-defined downtrend line, price is now testing the critical demand zone at 0.034–0.030 — the same level that previously triggered a massive rally earlier this year.
The current structure hints at a potential shift in momentum, but failure to hold this area could invite a deeper sell-off.
---
Pattern & Technical Structure
SPK is shaping a descending wedge / descending triangle pattern — a classic formation that often precedes a trend reversal when sellers lose steam and buyers begin to accumulate around a key support area.
The 0.034–0.030 zone acts as a strong defensive wall.
If this zone holds and price breaks above the yellow downtrend line, it could signal the start of a medium-term bullish reversal.
However, a clean break below this level would confirm bearish continuation, likely driving price down toward the 0.0225 support zone.
---
🟢 Bullish Scenario
A daily candle close above the downtrend line confirms a momentum shift.
Breakout must be supported by increasing volume for validation.
Upside targets:
0.0465 → first key resistance
0.0565 → confirmation of a trend reversal
0.0885 → extended bullish target if sentiment strengthens
Watch for the formation of a higher low post-breakout — a reliable sign of a structural reversal.
---
🔴 Bearish Scenario
A daily close below 0.030 confirms bearish dominance.
Potential for accelerated drop toward 0.0225 (previous major low).
If breakdown occurs on high volume, it may signal the final phase of capitulation before a deeper accumulation phase.
---
💡 Market Outlook & Sentiment
SPK is standing at a major inflection point.
The 0.034–0.030 zone is not just a support range — it’s a battlefield between accumulation and continuation.
A breakout above the trendline would ignite a new chapter in SPK’s price structure, while a breakdown could extend its bearish cycle into year-end.
Smart traders will wait for daily candle + volume confirmation, not emotional reactions.
The next decisive move here could define the market direction for months ahead.
---
🎯 Key Technical Levels
Main Support: 0.034 – 0.030
Next Support: 0.0225
Immediate Resistance: 0.0465
Major Resistances: 0.0565 / 0.0885 / 0.1250
---
🧭 Market Perspective
Although SPK remains within a downtrend, the slowing bearish momentum near this demand zone might indicate early accumulation by smart money.
If a breakout occurs, expect a possible short squeeze rally toward 0.05–0.06 as short positions unwind above the descending trendline.
---
#SPK #SPKUSDT #CryptoAnalysis #Breakout #Downtrend #TechnicalAnalysis #PriceAction #AltcoinSetup #CryptoTrading #ReversalZone #SupportResistance

Don't fight the HYPE train!The James Wynn saga was wonderful advertising for the platform.
(Maybe it was staged).
Either way #Hyperliquid goes higher.
SHELL/USDT — at the Critical Zone: Breakout or Deadly Rejection?The price of SHELL is currently walking on a tightrope — right at the confluence between the key support zone of 0.120–0.108 and the descending trendline that has been suppressing every bullish attempt for months.
The chart now enters a make-or-break phase where the next major direction will soon be decided.
---
Technical Structure Overview
The current setup forms a Descending Triangle Pattern, where:
The horizontal base (yellow zone) acts as the last line of defense for buyers,
While the descending trendline serves as the main wall for sellers.
In recent months, every breakout attempt has been rejected from this trendline — but this time, momentum looks stronger, and volume is starting to build up.
---
Bullish Scenario
If the price breaks and closes above 0.142 with strong volume confirmation:
The descending triangle could invalidate and turn into a bullish breakout reversal,
Upside targets will likely be at:
0.185 → 0.205 → 0.226 → 0.260 → 0.330,
Such a move may signal the start of a medium-term trend reversal, especially if the broader crypto market gains strength.
Main confirmation: a daily close above 0.142 followed by a successful retest of the breakout zone as new support.
---
Bearish Scenario
However, if momentum fails and the price gets rejected from the trendline and then breaks below 0.108,
The descending triangle will confirm as a bearish continuation pattern,
The next downside target sits around 0.085–0.075, the previous demand area.
Losing 0.108 support may trigger a panic sell and extend the bearish cycle significantly.
---
Key Takeaway
The 0.120–0.108 zone is the lifeline for buyers right now.
A breakout above it could reshape the entire medium-term structure,
while a breakdown below it could open the path for a deeper selloff.
Moments like this are often golden opportunities for technical traders — where the risk is tightly controlled, but the reward potential is substantial if confirmation appears.
---
Conclusion
SHELL stands at the final equilibrium between buyers and sellers.
The longer price stays under the descending trendline, the more pressure builds up for a decisive move.
Once the breakout or breakdown happens, a volatility expansion is inevitable.
The key is simple:
Watch the daily close, monitor the volume, and follow the confirmation.
#SHELLUSDT #CryptoAnalysis #BreakoutZone #TechnicalAnalysis #DescendingTriangle #CryptoSetup #PriceAction #SupportResistance #TrendReversal #CryptoTrader #ChartOfTheDay

ATH/USDT – at Golden Zone: Massive Rebound or Deep Breakdown?ATH has once again returned to the golden demand zone between 0.0275–0.025, a historically critical area that has triggered multiple price reversals in the past.
This is not just another support level — it’s the last stronghold of buyers on the daily timeframe.
Each time price revisited this region, we saw strong reactions, suggesting institutional accumulation and heavy buying pressure. However, this time the bearish momentum remains dominant, and sellers are still in control on the higher structure.
Interestingly, there’s a long lower wick indicating a liquidity sweep — meaning stop losses were taken below the zone before price quickly recovered. This often signals the beginning of a potential reversal phase.
---
Technical Structure & Key Observations
Overall trend: Still bearish (series of lower highs and lower lows).
Critical zone: 0.0275–0.025 (highlighted yellow box) — major demand area.
Candle structure: Multiple long lower wicks suggesting demand absorption.
Current formation: Sideways consolidation between 0.025–0.031 — breakout on either side will define the next major move.
Key levels to watch:
Immediate resistance: 0.031 – 0.033
Mid resistance: 0.0355 – 0.041
Strong resistance: 0.051 – 0.0645
Next support: 0.0223
---
Bullish Scenario – “Rebound From the Abyss”
A bullish setup will form if price successfully holds above 0.0275–0.025 and prints a strong bullish engulfing candle on the daily close.
That would confirm renewed buyer strength within the major demand area.
🎯 Upside targets:
Target 1: 0.031 (minor breakout confirmation)
Target 2: 0.0355
Target 3: 0.041 — potential trend reversal zone
📉 Invalidation: Daily close below 0.025.
👉 Note: If volume rises along with a solid green candle above 0.031, expect a swift move toward 0.041.
---
Bearish Scenario – “Breakdown Into the Abyss”
If buyers fail to defend the golden zone, a confirmed daily close below 0.025 with strong volume would signal a continuation of the downtrend.
This could trigger another wave of distribution and deeper correction.
🎯 Downside targets:
Target 1: 0.0223 (major local low)
Target 2: Below 0.020 — potential capitulation zone
📈 Invalidation: Strong rebound and daily close back above 0.031.
---
Technical Conclusion
ATH is standing at a make-or-break level that will define its next trend direction.
If the golden demand zone holds, we could see a powerful technical rebound and possible short squeeze.
But if this level gives way, expect a deeper move toward the 0.022 range.
This is the “do or die” moment for ATH bulls.
---
#ATH #ATHUSDT #CryptoAnalysis #TechnicalAnalysis #PriceAction #SupportZone #BreakoutOrBreakdown #CryptoTrading #SmartMoney #LiquiditySweep #SwingTrading

HYPE/USDT — Breakout, Retest Zone 43.5–40.5 Before Next Leg?Overview
After weeks of persistent selling pressure and a consistent lower-high structure, HYPE/USDT has finally shown signs of life — a clean breakout above the major downtrend line that has capped price action since early October.
This breakout signals a psychological shift in market sentiment, moving from fear-driven selling into an early optimism phase, where smart money begins accumulating before the retail wave arrives.
The 43.5–40.5 zone has acted as a crucial battlefield between buyers and sellers, now transforming into a key demand base — the foundation of a potential mid-term trend reversal.
---
Pattern & Structure Analysis
Primary pattern: Descending trendline breakout followed by a minor retest above structural support.
Context: After printing a panic wick in early October, price established a higher low and then broke through the descending line of resistance.
Technical implication: Bearish momentum is fading, while bullish pressure is gradually strengthening — an early indication of trend reversal.
---
Bullish Scenario — Momentum Reignited
If price holds above 47–48 USDT, the structure can evolve into a bullish continuation pattern with clear upside potential.
A confirmed breakout above 51 USDT would likely trigger the next expansion phase toward 59.4 USDT, aligning with the previous swing high and liquidity pocket.
Bullish Confirmation Signals:
12-hour candle closes above 48–51 with increasing volume.
Successful retest around 46–47 without falling back below the demand zone.
Upside Targets:
TP1: 51.00 (initial breakout zone).
TP2: 59.40 (major resistance / previous high).
TP3 (extended target): 65+ if momentum accelerates.
---
Bearish Scenario — False Breakout Trap
If the breakout fails to sustain and 51 USDT acts as a strong rejection point, the move may turn into a liquidity sweep — a classic bull trap.
A breakdown below 43.5–40.5 would invalidate the bullish structure and expose downside risk toward 36–32 USDT.
Bearish Confirmation:
12h candle closes below 43.5 with rising sell volume.
Clean breakdown of 40.5 with no rebound — confirming continuation of the previous downtrend.
---
Conclusion
HYPE is currently at a critical transition zone — between the end of a prolonged downtrend and the potential start of a new bullish cycle.
The 43.5–40.5 region remains the key battleground.
If buyers defend this base and reclaim 51 with strength, HYPE could enter a momentum expansion phase toward its previous highs.
Failure to hold this level, however, could send price back into extended consolidation.
Trader’s focus:
Watch the 47–51 USDT range for confirmation of strength, or wait for a clean retest and bounce from 43.5–40.5 for high-probability long setups.
---
#HYPEUSDT #Hyperliquid #CryptoBreakout #TechnicalAnalysis #PriceAction #SupportResistance #SmartMoneyConcepts #BreakoutTrading #TrendReversal #CryptoAnalysis
