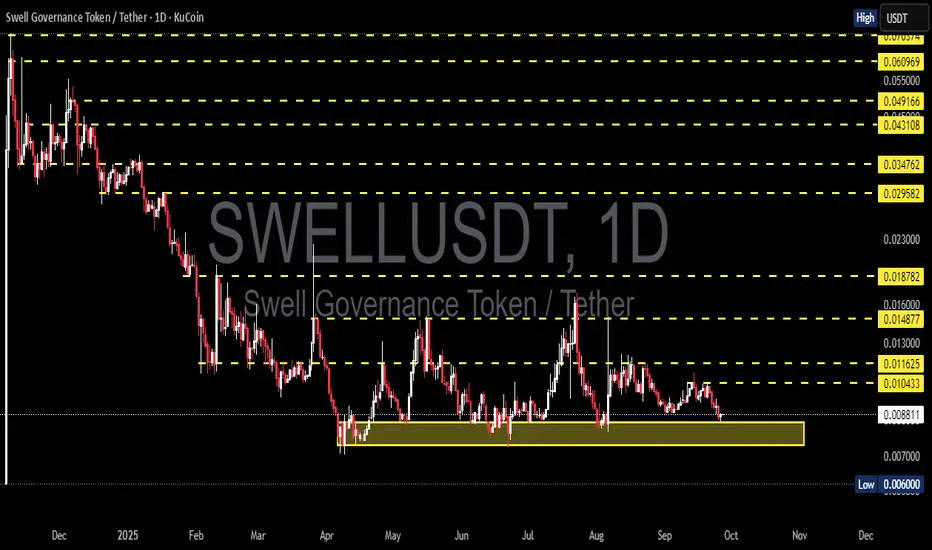
SWELL/USDT – Key Demand Zone: Relief Rally or Breakdown?Full Analysis
SWELL is currently at a critical juncture. After a prolonged downtrend since early 2025, the price has shifted into a range-bound structure, with a strong demand zone around 0.0060 – 0.0088 (highlighted in yellow).
This zone has been tested multiple times over the past few months, suggesting that buyers—potentially whales or institutions—are defending it. However, the more a support level is tested, the weaker it often becomes, raising the stakes for what comes next.
---
Structure & Price Pattern
Primary trend: bearish since the start of the year, but the momentum of the decline has slowed since Q2 → forming a range market.
Current pattern: multi-touch support combined with lower highs on the upside → signaling a phase of accumulation or distribution.
Key levels:
Support zone: 0.0060 – 0.0088.
Resistance layers: 0.0104 → 0.0116 → 0.0149 → 0.0187.
If the support zone holds, the probability of a relief rally is high. If it breaks, we could see a new capitulation phase.
---
Bullish Scenario
1. Bounce from demand zone
Confirmation: a strong daily rejection candle (hammer / bullish engulfing) with rising volume.
Short-term target: 0.0104 – 0.0116.
Extended targets: 0.0149 – 0.0187 if a breakout gains traction.
Upside potential: +30% to +100% from current levels.
2. Structural breakout
If price closes above 0.0116 on the daily chart, structure shifts into a higher-high formation.
This would significantly increase the probability of a larger bullish leg.
---
Bearish Scenario
1. Support breakdown
If the daily close falls below 0.0060, the demand zone will have failed.
This could trigger another strong sell-off and force the price to search for lower support levels.
Downside potential: at least -30% from current price, possibly more under heavy selling pressure.
---
Implications for Traders
Aggressive traders may consider entering within the demand zone with a tight stop-loss just below 0.0059. High risk, but potentially high reward if the bounce materializes.
Conservative traders should wait for a confirmed breakout above 0.0116, then enter on the retest. This approach provides a clearer bullish structure and better confirmation.
Risk management is critical here—SWELL is a small-cap altcoin with high volatility.
---
Conclusion
SWELL/USDT is standing at a major decision point. The 0.0060–0.0088 demand zone is the battlefield where the next trend direction will be decided—whether we see a relief rally toward higher resistances or a bearish breakdown into uncharted territory.
For traders, this is the time to stay patient and wait for confirmation: watch daily candle closes, volume spikes, and market reactions around this zone before making a move.
---
#SWELL #SWELLUSDT #CryptoAnalysis #Altcoin #TradingView #PriceAction #SupportResistance #Breakout #CryptoTrading #TechnicalAnalysis
Hyperliquid
HYPERLIQUID This is its last chance to rebound.Hyperliquid (HYPEUSD) has been trading within a 4-month Channel Up and today made contact with its 1W MA20 for the first time since May 06. With the 1D MA100 (green trend-line) broken also yesterday, this is the token's last chance to find Support as it sits at the bottom of the pattern.
If it holds and doesn't close a 1W candle below the 1W MA20, this would technically be the new Higher Low that initiated the next Bullish Leg. All previous sequences reached at least the 1.236 Fibonacci extension, which is at 64.500.
If the candle fails on the 1W MA20 however, we expect more aggressive selling towards Support 1 where contact can be possibly made with the 1D MA200 (orange trend-line). In that case, our Target will be 36.000.
It is also worth mentioning that the 1D RSI is just above its 6-month Support Zone, enhancing the probabilities for a rebound.
-------------------------------------------------------------------------------
** Please LIKE 👍, FOLLOW ✅, SHARE 🙌 and COMMENT ✍ if you enjoy this idea! Also share your ideas and charts in the comments section below! This is best way to keep it relevant, support us, keep the content here free and allow the idea to reach as many people as possible. **
-------------------------------------------------------------------------------
💸💸💸💸💸💸
👇 👇 👇 👇 👇 👇

Hype betas crowding the market like agent Smith In the world of memecoins, during the previous cycle you had token with "baby" appended in front of a bigger token's name. Their purpose was to use token tax collected from its trading (5% mostly) and use it to buy the main memecoin. These were the origins of beta play memecoins.
In this cycle, we had beta plays that didn't benefit the main coin in any way but they were made as a coping mechanism for people who missed out on the main one. Examples include countless WIF derivatives, blonde and brunette on base, trump and melania on sol earlier this year.
Regardless, in both the cases arrival of beta plays kills the main coin and ofcourse itself too. In previous cycle one would argue it made people think "what is the inherent value of this token if not collecting taxes to buy the main one? Why then shouldn't I buy the main one. Then their minds would ponder " what is the inherent value of the main one even? Why should I buy it?" And everything would nosedive. In this cycle, their is shortage of retail liquidity so arrival of beta plays sucks out monetary liquidity and attention liquidity from the main coin and injects it into the derivative. The derivative coin pumps while the main one dies. And then people realise the derivative doesn't have as much meme power as the main one. So this dies too and people move on to the next one.
But that's about memecoins. Such kinds of things shouldn't happen to serious chains right? Well i don't know if we should consider anything serious really. Call me silly but i see parallels between hype this cycle and luna last cycle. Both attracted people who wanted decentralisation above anything else. Although in case of hype the decentralisation factory is disputed, we can keep that talk for a later date. So cults can take things to the top but can they keep it up there? Maintainance is harder than the rise. I'm not saying it will crash and burn like luna but at some point the bells will be rung, and we'll be too busy partying loudly to hear them.
Binance founder came out of prison and decided to launch his own version of hyperliquid to vamp attack hype. This shouldn't be that concerning because eth and bnb have coexisted forever... Right? Not really. Hype is not eth. If you were there to see eth go from ico to $100 you'd understand what I'm saying. But regardless, this cycle even eth is struggling and bnb is breaking ATH after ATH. I was never a fan of binance ecosystem but i recently learned the chinese crypto community lives in their own world. For them BNB is both BTC and ETH. And anything the binance people make them believe. I'm not the biggest fan of Aster but chinese community+ hyperliquid factory + the fact that most retail normal people outside Anglo countries use binance makes me think....
HYPE is short term bearish desu.

HYPE - BULLISH SETUP GETTEX:HYPE - Bullish setup 📈
"🚨Team also announced that: GETTEX:HYPE TOKEN COULD SEE SUPPLY REDUCED BY 45%. "
Daily bottom is probably in! 🔥
Key support: $45.20
Lower: $43.30
Upper huge levels:
$48.90 - $50.00 - $50.70 - 52.50$
#HYPE #trading

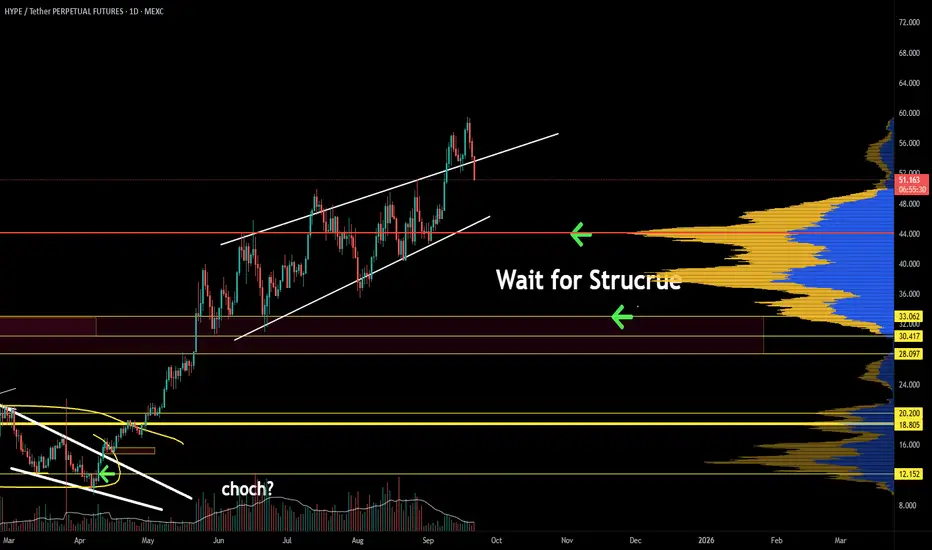
Hype's path to $55BYBIT:HYPEUSDT.P is currently forming a wedge shape pattern, is it indicating that it will break out and follow Path A, the blue path? I'm not so sure, I am sure we'll hit $55 either way.
If we take the red path, Path B, we'll come down to some heaviy support which could give us the fuel needed to get to $55
Out of all of the oscillators I was using, all except the chop zone on the daily mind you, were in bearish mode. So logically one would choose the red Path B right?
I can't wait to see how this plays out, shall we dip some and buy some more BYBIT:HYPEUSDT.P on Path B or experience more of a continuation of the current trendline to $55?
Let me know what you think in the comments, that'ls all for today, let's go HYPE!!! straight to $55!

HYPE Swing Long IdeaHYPE Swing Long Idea
📊 Market Sentiment
FED has resumed its rate-cutting cycle, starting with a 0.25% cut in September, with two more 0.25% cuts expected in the coming months. Additionally, institutional liquidity inflows have accelerated as the U.S. officially adopts crypto as part of its reserves. While inflation remains elevated, the weakening labor market is forcing the FED to ease, driving more capital into risk-on assets.
📈 Technical Analysis
Price broke the HTF Key Level and closed above, leading to price discovery.
It is also supported by the HTF Bullish Trendline.
Currently, price is retracing from its discovery highs.
📌 Game Plan
1-Retest of HTF Key Level at $50
2-Retest of HTF Bullish Trendline
3-Possible retrace into Fibonacci EQ (discount zone) at $47.55
🎯 Setup Trigger
• 4H break of structure after retest
• Alternative: Daily close back above HTF Bullish Trendline in case of deviation (deviation entry method)
📋 Trade Management
Stoploss: Below the 4H swing low that breaks structure
Target: $59.5 (ATH)
Carrying 25% runner with stop at breakeven for extended gains
💬 Like, follow, and comment if you find this setup valuable!
⚠️ Disclaimer: This content is for informational and educational purposes only and does not constitute financial, investment, or trading advice. Always DYOR before making any financial decisions.

Hyperliquid showing weakness as competition moves in.HPYE momentum is slowing down at the end of a rising wedge. Divergence is a sign that bullish momentum is slowing down, and follow-through should be expected. As trend line liquidity is hunted, be prepared for the base of the wedge to be a solid POI.
Crypto Market Weekly Review: Trend Structures and Key ExpectatioOverall trends continue to develop within the macro structures outlined in previous weekly reviews. Some assets (BNB, SOL, HYPE) are already in new uptrends, while others are only starting to form the first impulsive moves within broader bullish structures.
In the coming days, I expect local downside pressure to complete the ongoing September corrections, followed by a continuation of the uptrend toward target resistance zones. Another wave of Autumn consolidation is likely to follow afterward.
From a macro perspective, as long as prices hold above their key support zones, I continue to view the September lows as important macro higher-lows. Below these levels, most coins (possibly with the exception of ETH) are unlikely to fall and should instead continue forming higher lows ahead of a more sustainable rally into Q4.
⸻
BINANCE:BNBUSDT
Chart:
Support: 1000–930
Resistance: 1135–1150
⸻
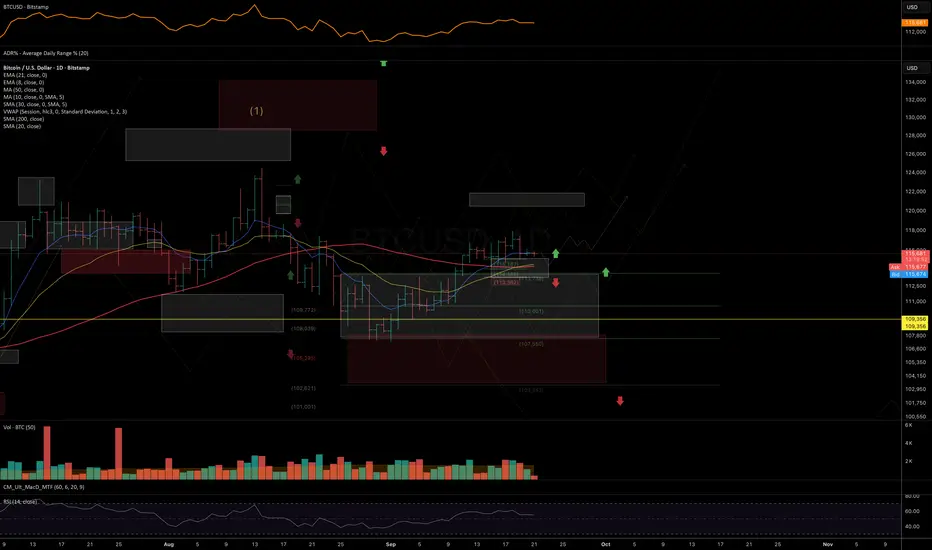
BINANCE:BTCUSDT
Chart:
Support: 115–113.3K
Resistance: 120–122K
⸻
BINANCE:XRPUSDT
Chart:
Support: 2.97–2.91 / 2.85
Resistance: 3.30–3.40
⸻
BINANCE:ETHUSDT
Chart:
Support: 3380
Resistance: 5060–5235
⸻
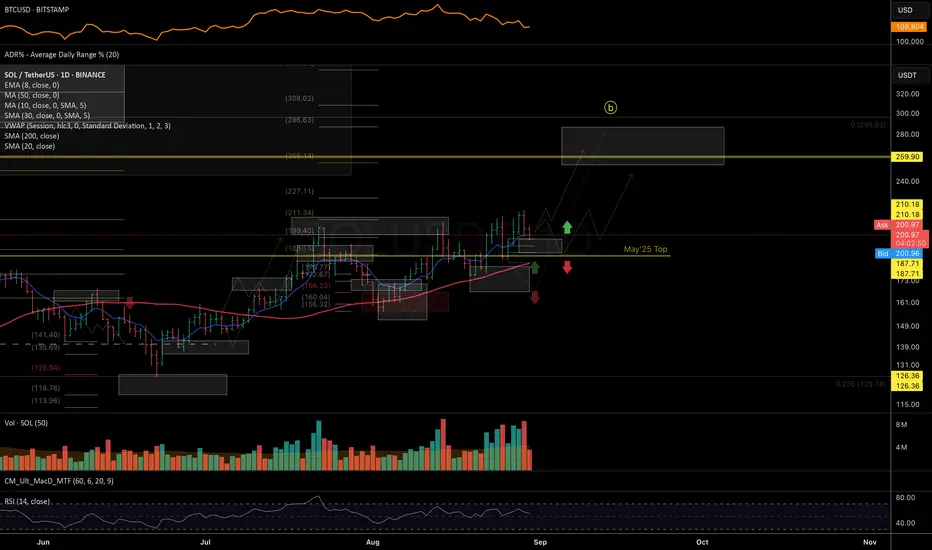
BINANCE:SOLUSDT
Chart:
Support: 230–223
Resistance: 285–310
⸻
$HYPEHUSDT
Chart:
Support: 52.5–51
Resistance: 67–73
Feel free to comment which coins and assets you’re most interested in, and I’ll prepare a separate review on them.
Thank you for your attention, and wishing you a successful week ahead!
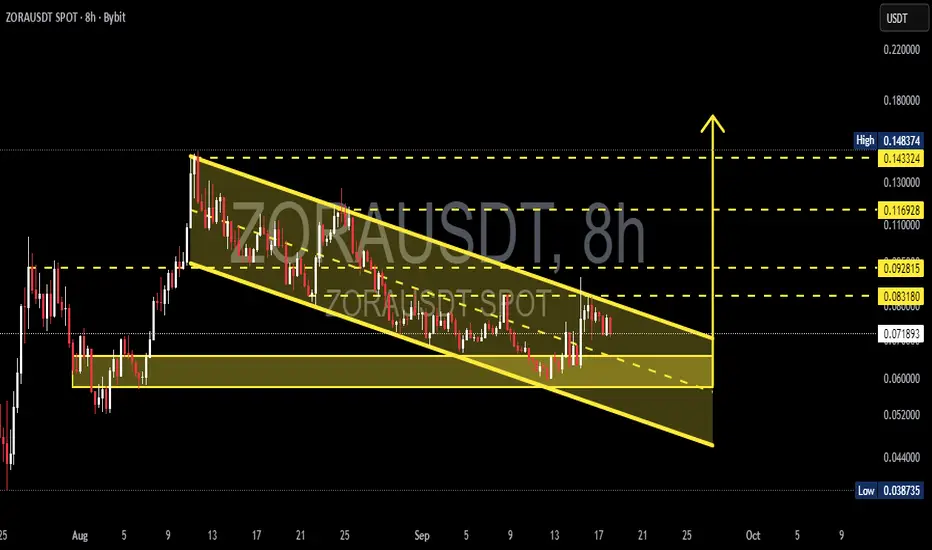
ZORA/USDT — Descending Channel Reaching Decision Point?Currently, ZORA/USDT is trading inside a well-defined descending channel, formed since the mid-August peak. The structure shows a sequence of lower highs and lower lows, reflecting mid-term bearish control. However, this pattern also resembles a falling wedge, which often signals a potential bullish reversal if a breakout occurs.
---
🔹 Technical Structure
Main Pattern: Descending channel (slightly converging, similar to a falling wedge).
Current Price: ~0.0719 USDT
Demand Zone: 0.055 – 0.062 (strong accumulation area tested multiple times).
Key Support: 0.0387 (chart low).
Resistance Levels:
0.0831 → first breakout trigger
0.0928 → next psychological resistance
0.1169 → mid-term target if momentum holds
0.1433 – 0.1483 → major resistance zone / previous rally high
---
🔹 Bullish Scenario
1. Price must close above the channel’s upper trendline and 0.0831 on the 8H timeframe.
2. A valid breakout should be confirmed with strong volume + successful retest of the upper channel as new support.
3. If confirmed, bullish targets are:
🎯 Target 1 → 0.0928
🎯 Target 2 → 0.1169
🎯 Target 3 → 0.1433 – 0.1483
📍 Note: A failed breakout (false breakout) could send price back into the channel.
---
🔹 Bearish Scenario
1. If price gets rejected at the upper channel or fails to close above 0.0831, downside pressure may return.
2. A strong breakdown below the demand zone (0.055–0.062) opens the path toward 0.0387.
3. Bearish outlook is invalidated if the price sustains above 0.0831 with confirmation.
---
🔹 Conclusion
ZORA/USDT is approaching a critical decision zone.
The descending channel structure provides two clear paths:
🚀 Bullish breakout above 0.0831 → upside targets 0.0928 – 0.1433.
📉 Breakdown below 0.055–0.062 → potential continuation toward 0.0387.
Key decision levels: 0.0831 (resistance) and 0.055–0.062 (support zone).
---
📢 Trading Notes
Always wait for 8H/1D candle close for confirmation before execution.
Risk management is crucial — never enter without a stop loss.
Descending channels often lead to explosive moves once a breakout is confirmed — be prepared.
---
ZORA/USDT is consolidating inside a descending channel. 0.0831 is the breakout trigger for a bullish reversal, while 0.055–0.062 remains the key demand zone. Breakout → targets 0.0928 – 0.1433. Breakdown → risk toward 0.0387. Watch candle close + volume for confirmation.
---
#ZORA #ZORAUSDT #Crypto #Altcoins #TechnicalAnalysis #TradingView #ChartPattern #Breakout #SupportResistance #PriceAction
Memecoin is risky but profitable...Hello friends🙌
Given the channel's failure on the weekly time frame, there is now a good opportunity to buy in the price reversal or price correction, of course, with capital and risk management.
🔥Follow us for more signals🔥
*Trade safely with us*

HYPE- long plan ,bullish continuation 🚀 GETTEX:HYPE Daily Chart looking 🔥
🔹Price has broken out strong and is now setting up for a healthy retracement. Eyes are on the Daily FVG + Fib Zone around $50 – a perfect area for bulls to reload before the next leg up.
🔹Liquidity has been swept, structure is bullish, and momentum is still on our side. As long as this zone holds, the next move could send us into new highs. 📈
This dip = opportunity. Don’t fade the HYPE. ✨

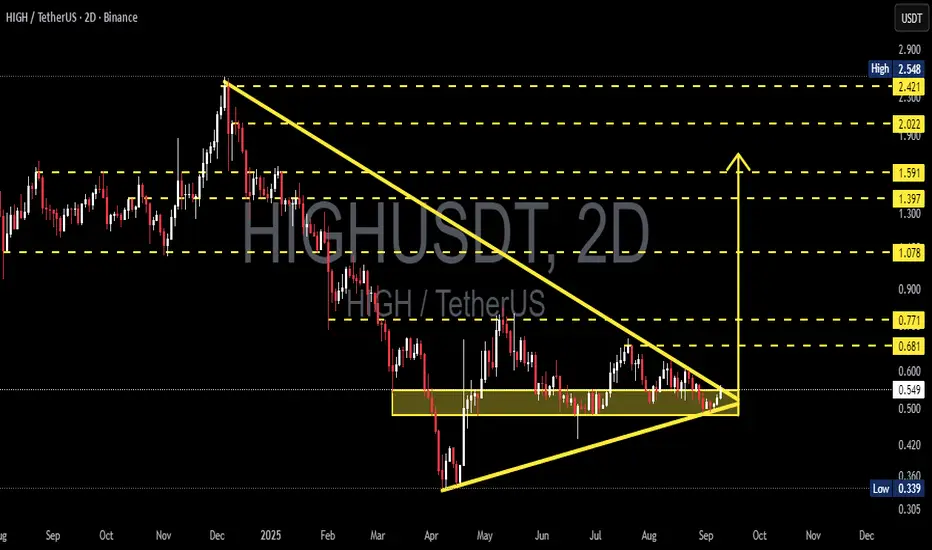
HIGHUSDT — Symmetrical Triangle A Major Breakout Is Approaching?The pair HIGH/USDT is currently at a critical stage after experiencing a prolonged downtrend earlier this year. On the chart, we can clearly see the formation of a Symmetrical Triangle, marked by a descending resistance line from the $2.5 peak and a rising support line that has been holding since April 2025.
This type of pattern usually appears during a consolidation phase, where both buyers and sellers are competing to decide the next medium-term trend.
---
🔑 Key Highlights from the Chart:
1. The accumulation zone (0.45 – 0.55) has been tested multiple times since April and continues to hold — making it a critical demand area.
2. Price action is now squeezing into the apex of the triangle, suggesting that a major breakout is likely to occur soon.
3. Key resistances: 0.681 → 0.771 → 1.078 → 1.397 → 1.591 → 2.022 → 2.421.
4. Key supports: 0.45, with the last major floor at 0.339. A breakdown here would strengthen the bearish case.
---
📈 Bullish Scenario
A breakout above the descending trendline and a confirmed 2D candle close above 0.68–0.77 would open the door for a strong rally.
Short-term targets: 0.77 → 1.08 → 1.40
Mid-term targets: 1.59 → 2.02 → 2.42
Full measured move target: 2.63 – 2.76
Confirmation: Breakout must come with rising volume + successful retest.
---
📉 Bearish Scenario
Failure to hold above 0.45 would invalidate the triangle pattern and likely lead to further downside.
First bearish target: 0.339 (previous low).
If broken, extended bearish measured move could reach around 0.12 (extreme scenario).
Confirmation: 2D close below 0.45 with strong selling volume.
---
🧭 Conclusion
HIGH is at a decisive turning point.
Bulls need a confirmed breakout above 0.68–0.77 to shift momentum and reclaim medium-term strength.
Bears will dominate if 0.45 breaks, pushing price back to 0.339 or lower.
Until confirmation, the setup remains neutral, but the tightening triangle indicates that a large move is imminent.
---
#HIGHUSDT #HIGH #Crypto #TechnicalAnalysis #SymmetricalTriangle #Breakout #Bullish #Bearish #Altcoin #SupportResistance
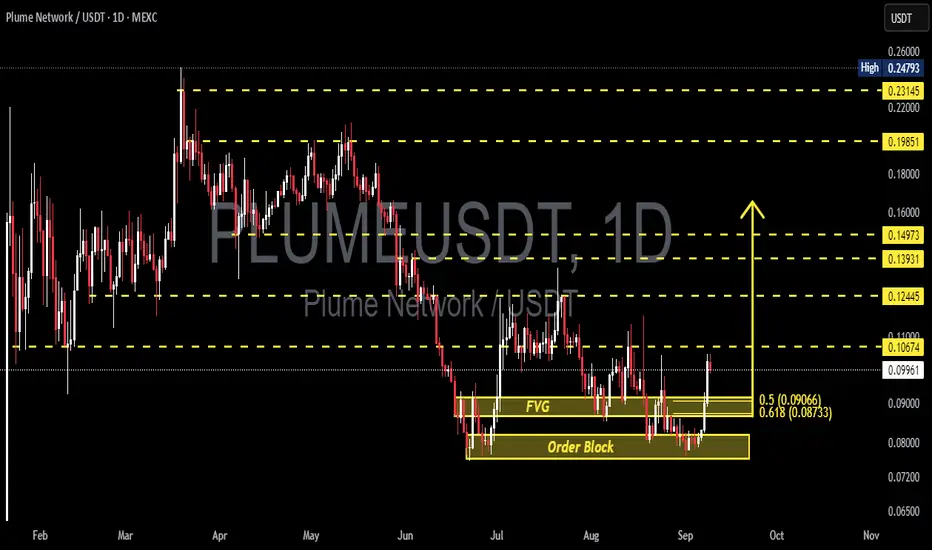
PLUME/USDT (1D) — Decision: Major Reversal or Deeper Correction?🔎 Technical Outlook
PLUME is currently at a critical stage after months of decline since April. The price has found a strong demand zone around 0.076–0.082, aligned with a daily Order Block, reinforced by a Fair Value Gap (FVG) highlighting an imbalance zone that often acts as a turning point.
From this zone, PLUME bounced sharply toward 0.100–0.106, which now stands as the first key resistance. This strong reaction suggests accumulation by larger players — but the real battle begins here: will PLUME break above 0.10674 to confirm a bullish reversal, or face rejection and revisit the demand zone?
---
🟢 Bullish Scenario
1. Upside Confirmation:
A daily close above 0.10674 would signal short-term bullish momentum. Breakout could open the path toward higher resistance levels:
Target 1: 0.12445
Target 2: 0.13931
Target 3: 0.14973
Major Upside Zone: 0.19851 → 0.23145
2. Entry Ideas:
Conservative: wait for a retest at 0.090–0.092 (FVG) with stop-loss below 0.078.
Aggressive: buy after a daily close above 0.10674 with volume confirmation.
3. Why Bullish Could Work:
Strong bounce from demand zone.
FVG often gets filled before continuation.
Breaking 0.10674 would form a higher high and signal structure shift.
---
🔴 Bearish Scenario
1. Rejection at Resistance:
If the price fails to break 0.10674, PLUME is likely to revisit:
The FVG area (0.087–0.091).
The Order Block (0.076–0.082).
2. Breakdown of Demand Zone:
Losing this support zone could send PLUME lower toward 0.065.
3. Short Setup Idea:
Entry: rejection near 0.105–0.107 with bearish confirmation.
Stop-loss: above 0.112.
Take-profit: first at 0.087–0.091, then 0.076–0.082.
---
📌 Pattern in Play
Order Block + FVG: strong demand zone overlap.
Potential Reversal Zone: could mark a major turning point.
Key Pivot: 0.10674 — breakout or rejection here will define the next trend.
---
📝 Conclusion
PLUME is at a make-or-break moment:
Bullish Valid: daily close above 0.10674 → opens the way to 0.124–0.149 and potentially higher.
Bearish Valid: rejection at resistance and breakdown of the Order Block → downside risk toward 0.065.
The 0.076–0.091 demand zone is the last line of defense for buyers.
⚠️ Always apply strict risk management, as this setup is highly prone to false breakouts and fake pumps.
---
#PLUME #PLUMEUSDT #Crypto #TechnicalAnalysis #Altcoin #OrderBlock #FVG #PriceAction #CryptoTrading #SupplyDemand
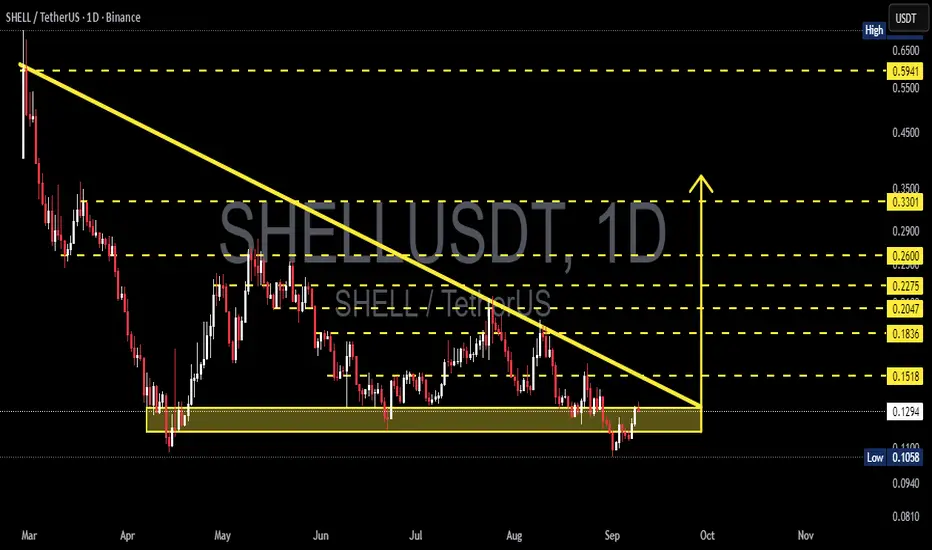
SHELL/USDT — Decision Point at the Edge of Descending TriangleCurrently, SHELL/USDT (1D) is at a critical stage after a prolonged downtrend since March. The chart clearly shows a Descending Triangle pattern, with strong support around 0.1058 – 0.1350.
Each time price dips into this zone, buyers step in for a rebound — yet sellers consistently push lower highs, forming a descending trendline. This signals the market is in a consolidation phase before a major decision: either a breakout to the upside or a breakdown to the downside.
---
🔎 Pattern and Chart Structure
Main pattern: Descending Triangle (default bias = bearish).
Strong support: 0.1058 – 0.1350 (demand zone, tested multiple times).
Dynamic resistance: Descending trendline (~0.1518 now).
Key levels to watch:
Resistance: 0.1836 → 0.2047 → 0.2275 → 0.2600 → 0.3301 → 0.5941.
Support: 0.0940 → 0.0810 (if breakdown).
---
🚀 Bullish Scenario
Bullish momentum may emerge if there’s a daily close above 0.1518 with strong volume, signaling buyers breaking through the descending pressure.
Initial target: 0.1836.
Mid targets: 0.2047 – 0.2275.
Extended targets: 0.2600 → 0.3301 → potentially 0.5941 if momentum accelerates.
Strategy: Enter after breakout confirmation, stop loss below 0.1300 or below 0.1058 for full invalidation.
---
🐻 Bearish Scenario
If price fails at the trendline and instead breaks down below 0.1058 on a daily close, the descending triangle plays out as a bearish continuation.
First target: 0.0940.
Next target: 0.0810.
Strategy: Enter short/re-entry on breakdown, with stop loss above 0.1200–0.1300.
---
📌 Conclusion: “Decision Zone”
SHELL/USDT is at a critical decision zone. Buyers are defending support, while sellers continue pressing down with lower highs.
Breakout above trendline → potential trend reversal.
Breakdown below support → bearish continuation.
Traders should avoid FOMO and wait for clear confirmation (breakout or breakdown). Risk management is essential: use stop loss and proper position sizing.
---
#SHELL #SHELLUSDT #Crypto #TechnicalAnalysis #SupportResistance #Breakout #DescendingTriangle #CryptoTrading
Shorting $HYPE
Hyperliquid has been sending nonstop and CT is screaming ATH + $100 soon. That’s usually when late longs get trapped.
I’m eyeing a short if we get a blow-off move into the $60–65 zone and it fails. Need that rejection wick before pulling the trigger.
Plan:
Entry: 55 - 60 or a lil below if it rejects
Stop: above $70 (invalidate)
Targets: $52 / $48 / $42
If it blasts through $70 with volume, short idea is cooked and $80–100 opens up next. Simple as that.

HYPE | Looking for All-Time HighsHYPE | Looking for All-Time Highs
📊 Market Sentiment
Market sentiment remains strongly bullish as the FED is set for a 0.25% rate cut, with the possibility of a 0.5% cut in September. Monetary policy is being adjusted not only in response to inflation but also weak labor market data. Recent August and September job numbers came in soft, signaling that the economy is cooling rapidly. This shift is fueling expectations for one of the strongest bullish runs in the coming weeks.
📈 Technical Analysis
HYPE continues to show a strong HTF bullish trend — one of the most bullish structures currently in crypto. Price retraced into the 0.75 HTF discounted range and reacted strongly from there. This level also aligned with the HTF bullish trendline, creating a clean confluence. Following the bounce, price established a fresh 4H demand zone, adding further validation to the bullish outlook.
📌 Game Plan
I will be watching for price to revisit the 4H demand zone, which also overlaps with the HTF bullish trendline. This zone aligns with the 0.5 Fibonacci equilibrium level, making it a key area of interest for continuation to the upside.
🎯 Setup Trigger
I will look for a confirmed 1H break of structure before entering long.
📋 Trade Management
Stoploss: Below the 1H swing low responsible for the BOS
Targets:
• TP1: $47.78
• TP2: $51.20 (ATH)
💬 Like, follow, and comment if you find this setup valuable!
⚠️ Disclaimer: This content is for informational and educational purposes only and does not constitute financial, investment, or trading advice. Always do your own research before making any financial decisions.

Hype Breakout Above $47.6?Hype continues to consolidate near the 45.95 resistance on the 4-hour chart. In this update, I break down the short-term roadmap with clear resistance and support levels. A breakout above 45.95 could open the way to 47.57, 49.32, and even 52.14 in the coming sessions.
On the downside, supports to watch are 44.32, 42.58, and 40.49. The broader structure remains constructive above 38.27, and my bias continues to be for more upside as long as that foundation holds. Watch these levels closely as they will define the next move for Hype.

TradeCityPro | HYPE Weakens Inside Ascending Channel👋 Welcome to TradeCity Pro!
In this analysis, I want to review the HYPE coin for you. It is one of the coins that has recently trended and with a market cap of 15.31 billion dollars is ranked 12th on CoinMarketCap.
📅 Daily Timeframe
In the daily timeframe, this coin has had a very long-term upward trend that has now shown weakness after breaking the 31.132 zone, and its slope has decreased significantly.
✨ After the 31.132 break, an ascending channel has formed, and the price is correcting in the direction of the trend.
📊 The volume has gradually decreased, indicating weakness in this upward move, and on the other hand, RSI has shown a strong divergence.
💥 Of course, the RSI divergence has not yet been activated, and it is natural for RSI to show divergence when the price is in a correction and consolidation phase.
✅ Currently, the price is in the lower half of the channel and has reacted several times to the bottom and midline of the channel. If the resistance at 49.223 is broken, the price structure can change, and if volume starts to increase, the probability of breaking the channel top rises significantly.
⚡️ On the other hand, considering all the negative signs that have led to this trend weakness, the possibility of breaking the channel to the downside is also high.
📈 In that case, with the break of the 40.625 or 36.871 triggers, we can open a short position, but in my opinion, as long as the price is above the 31.132 zone, short positions are not logical and the market trend remains bullish.
📝 Final Thoughts
Stay calm, trade wisely, and let's capture the market's best opportunities!
This analysis reflects our opinions and is not financial advice.
Share your thoughts in the comments, and don’t forget to share this analysis with your friends! ❤️

SIGN/USDT – Critical Accumulation Zone Before the Next Big Move!📊 Detailed Analysis of SIGN/USDT
Currently, SIGN/USDT is moving within a prolonged consolidation phase, with the key demand zone at 0.06700 – 0.07000 USDT (highlighted in yellow). This zone has acted as a strong base since mid-June, repeatedly rejecting downside pressure, and can be considered a major accumulation area.
---
🔎 Market Structure & Pattern
1. Sideways Accumulation
The price is forming a sideways base within the range of 0.067 – 0.078 USDT. Such structures often precede a significant move, either a breakout to the upside or a breakdown lower.
2. Strong Support Zone
Primary Support: 0.06700 – 0.07000 USDT
Next Supports: 0.06300 – 0.05950 USDT, if breakdown occurs.
3. Layered Resistance (Supply Zones)
R1: 0.07382 – 0.07814 USDT
R2: 0.08532 – 0.08938 USDT
R3: 0.09576 – 0.10137 USDT
This structure signals that the price is currently at a decision point, awaiting confirmation of the next big move.
---
✅ Bullish Scenario
As long as price holds above 0.06700, this zone can serve as a strong rebound point.
A breakout above 0.07382 – 0.07814 will open the way toward 0.08532 – 0.08938.
Further bullish momentum above 0.09576 may push the price to 0.10137 USDT, which is the major resistance zone.
If sustained, this could evolve into an Ascending Accumulation Pattern, strengthening the bullish outlook.
---
❌ Bearish Scenario
If the price breaks below 0.06700, a drop toward 0.06300 – 0.05950 becomes highly likely.
A confirmed daily close below this support would shift the structure into a downtrend continuation, possibly extending losses toward 0.05650.
This scenario would reinforce bearish momentum and invalidate the current accumulation zone.
---
🎯 Key Takeaway
0.06700 – 0.07000 USDT is the make-or-break zone.
Holding above it keeps the bullish rebound potential alive, while a breakdown will accelerate the bearish trend.
For traders, this level can act as a strategic entry point with strict risk management, as the market is preparing for its next decisive move.
#SIGNUSDT #CryptoAnalysis #PriceAction #SupportResistance #CryptoTrading #Altcoins #ChartAnalysis #BullishScenario #BearishScenario

Big Weekly Crypto Review: Altcoins Trend Structures This week’s review covers major altcoins and selected mid/low-cap tokens (see separate update for BTC and ETH). Focus is on macro structures, key support/resistance zones, and expected mid-term scenarios through Autumn.
BINANCE:BNBUSDT
Pulled back to the local support highlighted earlier this week. I would prefer to see a more prolonged consolidation before the next higher low forms and one more break-out into the macro resistance zone at 930–1000. However, a sustained break above Thursday’s high would increase the odds of more immediate upside momentum, potentially bypassing the longer consolidation phase.
Chart:
BINANCE:XRPUSDT
Is following the corrective structure outlined in the previous weekly report. A double bottom formation is possible at current levels, but as long as price remains below the 50DMA, the odds favor further downside into the macro support zone at 2.52–2.35 before a higher low can be established.
Chart:
CRYPTO:HYPEHUSD
Is following the price structure outlined in the previous weekly report, holding the mid-term support zone and reversing to the upside. A quick shake-out below recent August lows is possible in the coming weeks, but the next break above 50 has high odds of follow-through toward the next resistance around 65+. The price action remains among the strongest in the crypto space, suggesting potential outperformance versus most other coins during the next upside phase.
Chart:
BINANCE:SOLUSDT
Is following the trend structure outlined in the previous crypto market review: holding mid-term support and continuing its upside momentum. The near-term trend looks bullish, supported by a high-level constructive consolidation. Given seasonality, a more prolonged autumn consolidation with a series of higher lows would be constructive for a more sustainable breakout later toward year-end.
Chart:
BINANCE:LINKUSDT
Is following the trend structure suggested in previous August updates. I expect a more prolonged Autumn consolidation and base building within the higher levels of macro support: 19.5–17.5, before the next upside leg. The macro trend structure remains bullish and has a wide margin of safety, indicating potential outperformance during the next upward momentum.
Chart:
BINANCE:LTCUSDT
Price respected the mid-term resistance levels outlined in the previous August update. Mid-term support for the impulsive structure is 114–105. If these levels fail to hold, or if price cannot break above the Aug 24 highs, a more prolonged consolidation within the 108–95 macro support zone is likely.
Chart:
BINANCE:SUIUSDT
Price respected the mid-term resistance levels outlined in the previous August update and is now consolidating orderly within the mid-term support zone. Expecting a higher low to form within 3.10–2.75, continuing base formation before a potential larger-degree breakout.
Chart:
BYBIT:ONDOUSDT
Is showing potential for a double bottom formation in the coming sessions. However, if price fails to break above 1–1.05 on any recovery attempt, the risk of a deeper correction toward macro support at 0.80–0.75 increases.
Chart:
CRYPTO:TONUSD price continues to respect the mid-term support zone at 3.25–3.00, in line with the structure outlined in the Aug 9 weekly review. As long as 3.00 holds (with potential max downside extension toward 2.82), the bias remains for a higher-low formation and eventual resumption of the broader uptrend.
Chart:
BINANCE:RENDERUSDT
Price is consolidating within the mid-term support zone at 3.50–3.25. The macro structure remains bullish, but there is still a risk of further downside toward the 3–2.75 macro support if price fails to reclaim the 50DMA on any recovery attempt.
Chart:
BINANCE:UNIUSDT is following the larger-degree structure outlined in the previous August update. Key mid-term support for the impulsive structure lies at 9.70–8.80. If price fails to close above the August 22 highs or breaks below 8.80, the odds increase for a more complex corrective structure and extended consolidation.
Chart:
BINANCE:DOGEUSDT
0.22–0.20 marks a key mid-term support zone where price could form a higher low before continuing upside momentum. Failure to reclaim August highs on any breakout attempt may lead to continued selling pressure toward macro support below early August lows.
Chart:
BINANCE:TAOUSDT is evolving within a complex corrective structure. Key macro support levels are at 287–270–250. Any short-term bounce that fails to close above the 50DMA may face renewed selling pressure toward the macro support zone.
Chart:
BINANCE:FETUSDT
Was unable to close above the local resistance zone highlighted in the previous August update and continues showing downside potential. Price may attempt to form a double bottom with early August lows, followed by a bounce toward the declining 50DMA. Macro support remains at 0.50–0.45. The weekly structure stays bullish for the long term, as long as price holds above April lows.
Daily chart:
Weekly chart:
BINANCE:VIRTUALUSDT.P
Is trading within the macro support zone 1.30–0.95–0.80, following the larger-degree corrective structure first suggested in July. I am looking for price to start forming a higher low within this range.
Chart:
BYBIT:POPCATUSDT is forming a complex corrective structure. Key macro support for a potential larger-degree higher low sits at 0.23–0.19.
Chart:
$1000FLOKIUSDT key support zone to maintain macro bullish structure stands at 0.097–0.085–0.075. Holding above these levels keeps odds in favor of long-term upside continuation.
Chart:
BINANCE:SUPERUSDT is approaching the mid-term support area at 0.53–0.50. This zone may provide conditions for a higher-low formation and potential trend continuation.
Chart:
$1000000MOGUSDT.P corrective structure remains complex, but as long as price holds within the mid-term support zone at 0.89–0.77–0.70, the odds favor a potential upside reversal with a new base formation developing.
Chart:
CRYPTO:BRETT2USD is consolidating within the mid-term support zone highlighted since the Aug 9 weekly review. Watching for a higher-low formation inside 0.044–0.038 support before potential trend continuation.
Chart:
BINANCE:BONKUSDT price is in a mid-term support zone where a higher low formation could develop, setting up at least a bounce. A break below 0.0000183 would open the door to the next support levels at 0.0000165–0.0000145.
Chart:
Hyperliquid defended the $43 level ┆ HolderStatOKX:HYPEUSDT.P on the 8h chart is showing strength after breaking out of a falling channel. The price is holding above 42.9, supported by a pattern of triangles and sideways ranges that consistently preceded bullish extensions. If momentum holds, the market could target 47.5 and eventually 50, suggesting accumulation is ongoing with breakout potential building.

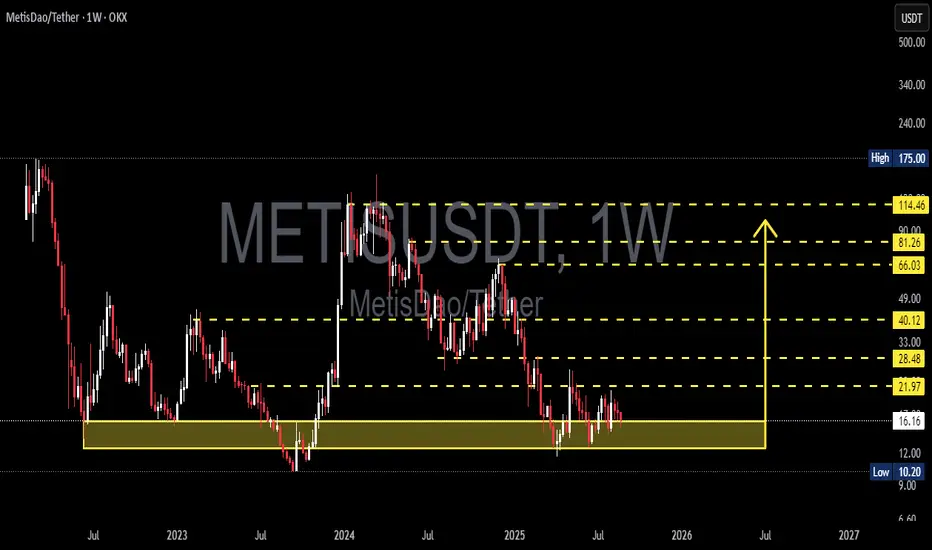
METIS/USDT — Major Accumulation or Breakdown Ahead?Currently, METIS/USDT is trading inside a very crucial demand zone at $10.20 – $16.16 (highlighted in yellow). This area has acted as strong support multiple times since 2022–2025, preventing deeper sell-offs. In other words, this is the last line of defense for buyers and a potential accumulation zone before a major move.
---
🔎 Technical Structure & Pattern
Macro trend: Since the 2024 peak, METIS has been forming a series of lower highs, signaling that the medium-term downtrend is still intact.
Key zone: The $10–16 range is a historical demand zone where buyers have consistently stepped in. Holding above this area increases the probability of a trend reversal.
Current formation: Price action shows a sideways movement within this demand zone → often referred to as a base-building phase or accumulation phase. Historically, such phases are followed by explosive moves either upward or downward.
---
🚀 Bullish Scenarios
1. Rebound from demand zone
If METIS holds above $10.20–$16.16 and prints a strong bullish weekly candle, a rally could begin.
Short-term upside targets: $21.97 → $28.48 → $40.12 (weekly resistances).
2. Medium-term reversal
A true reversal becomes more likely once price breaks and closes weekly above $40.12.
If confirmed, higher targets could unfold: $66.03 → $81.26 → $114.46.
This would mark the transition from lower highs to higher highs — a signal of a new bullish cycle.
---
🔻 Bearish Scenarios
1. Breakdown of demand zone
If price fails to hold and weekly closes below $10.20, the structure breaks down.
This opens the door for deeper declines, potentially towards $7–8 psychological levels.
2. False rally / rejection
If price rallies to $21–28 but gets rejected with strong bearish weekly candles, it would suggest weak buyers.
In that case, price could revisit the demand zone, keeping the downtrend intact.
---
🎯 Key Takeaways
The $10–16 zone is the most critical area on this chart → both a last defense for bulls and a potential golden accumulation zone for long-term positions (with strict risk management).
Bullish confirmation: A weekly close above $21.97 – $40.12.
Bearish confirmation: A weekly close below $10.20 → signaling a full breakdown.
---
📌 Important Note
Trading around such critical zones requires patience and confirmation. Avoid chasing moves blindly — wait for weekly candle confirmations (breakouts or breakdowns). Remember: accumulation phases can last longer than expected before a big move unfolds.
#METIS #METISUSDT #CryptoAnalysis #Altcoin #TechnicalAnalysis #PriceAction #SupportResistance #SwingTrading #CryptoMarket
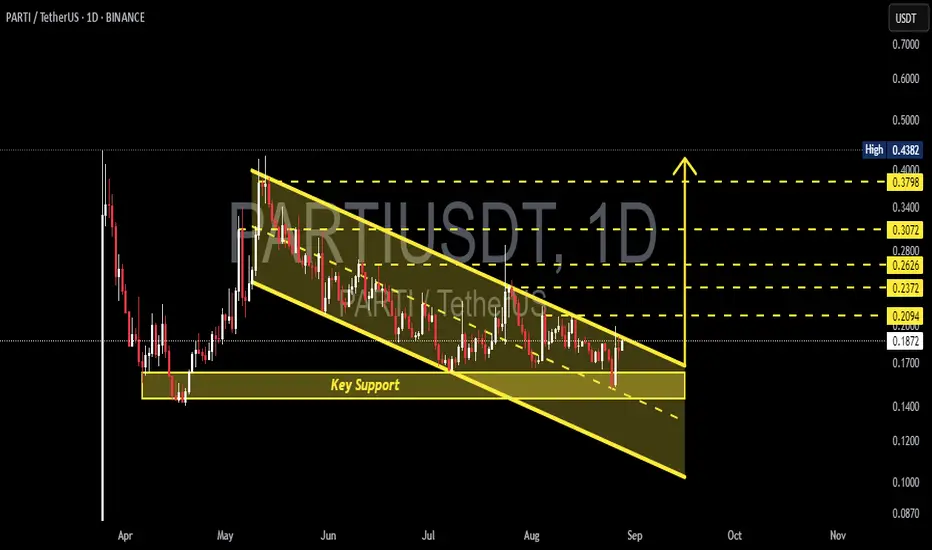
PARTI/USDT — Descending Channel & Key Support Zone!🔎 Market Structure & Pattern
Since May 2025, PARTI has been trading within a clear descending channel, forming consistent lower highs and lower lows.
Current price is around 0.187 USDT, sitting near the channel mid-line and close to the upper trendline resistance.
A key support zone lies between 0.14–0.16 USDT, which has historically acted as a strong demand area.
This setup often suggests a continuation of the bearish trend, but it can also turn into an accumulation pattern if a breakout occurs.
---
🟢 Bullish Scenario
Bullish potential will be unlocked if the price breaks out of the descending channel.
Breakout confirmation: Daily close above the upper trendline and above 0.2094 USDT.
Upside targets:
🎯 0.2094 → breakout trigger
🎯 0.2372 → intermediate resistance
🎯 0.2626 → short-term swing target
🎯 0.3072 → main breakout target
🎯 0.3798 – 0.4382 → major resistance zone (over 100% upside from current levels if confirmed)
Key factor: Breakout must be supported by increasing volume, otherwise it risks being a fake breakout.
---
🔴 Bearish Scenario
If the price fails to break out and gets rejected at the channel resistance:
Bearish confirmation: Rejection at the upper trendline or failure to hold above 0.187 / 0.16.
Downside targets:
🕳️ 0.16 → first support
🕳️ 0.14 → lower edge of key support zone
🕳️ A breakdown below 0.14 could lead to 0.10 – 0.12 USDT, the next potential demand zone.
A strong breakdown with volume would confirm continuation of the bearish trend.
---
📌 Key Technical Levels
Main Support: 0.14 – 0.16 (critical demand zone)
Key Resistance: 0.2094 (bullish trigger)
Upside Targets: 0.2372 | 0.2626 | 0.3072 | 0.3798
Bullish Invalidation: Daily close below 0.14
---
🧠 Conclusion & Bias
Currently, PARTI remains in a downtrend within the descending channel. However, price is approaching a decision zone at the key support (0.14–0.16).
If support holds + breakout occurs: A bullish reversal toward 0.237 / 0.262 / 0.307 is possible.
If support fails: Expect continuation of the bearish trend, targeting 0.12 or even lower.
👉 This is a critical decision point for PARTI — the next move will confirm whether we see a bullish reversal or a bearish continuation.
#PARTI #Crypto #TechnicalAnalysis #DescendingChannel #Breakout #BearishTrend #BullishReversal #PriceAction #SupportResistance #Altcoins #CryptoAnalysis