Trendline Compression After 400% Pump – Waiting for Breakout After the previous breakout of the descending trendline, price reacted with a powerful impulse move of over 400% , confirming strong demand and aggressive buying interest.
Since that impulse, the market has been forming a corrective structure and is now compressing back toward the descending trendline. This area is critical — all attention is on the trendline as it represents a key decision point for the next move.
Long setups are only valid on a confirmed breakout and acceptance above the trendline. Until then, patience is required.
If the descending trendline is decisively broken, I’m targeting the $0.30 – $0.33 zone as the next upside objective.
Invalidation: Continued rejection below the trendline
HYPERUSD

HYPER: waitHey guys! HYPERUSDT's navigating some choppy waters on the 1h timeframe after that sharp -10.34% pullback, but the structure underneath is actually holding up better than the headline number suggests. Let me break down what's happening here and where the opportunities might be developing.
Price is currently trading at $0.1517 after bouncing from a $0.1422 low, and despite the daily drawdown, we're still sitting comfortably above all major moving averages. The EMA20 at $0.1483, EMA50 at $0.1440, and EMA200 at $0.1375 are forming a bullish stack that's providing structural support. When you see price hold above this kind of moving average alignment after a significant wick down, it's telling you that buyers are defending key levels. That's not random - that's institutional memory and algorithmic support kicking in.
The technical indicators are painting a mixed but cautiously bullish picture. RSI's at 58.2, which keeps us in neutral territory but with a slight bullish lean. What's more important than the RSI level itself is the context - we saw a 50% lower wick formation on the recent candle, which is a strong signal that buyers stepped in aggressively to defend the $0.1422 low. That's real demand showing up when it matters most. The MACD's showing some short-term weakness with the histogram at 0.0014 sitting below the signal line at 0.0019, creating a bearish crossover that suggests momentum hasn't fully shifted back yet. But here's the thing - the ADX at 24.2 tells us we're not in a strong trending environment, which means these momentum signals might be less reliable than usual.
Stochastic at 56.8 and MFI at 48.1 are both dead neutral, confirming we're in a decision zone where the next move could go either way based on volume and external catalysts. The Bollinger Bands are showing price above the middle band at $0.1491 but below the upper band at $0.1560, suggesting we're in the upper half of the range without being overextended. The HMA55 at $0.1549 is creating an immediate resistance level that's worth watching closely.
Now let's talk about the volume situation, because this is critical. Current hourly volume is sitting at $2.8M, which is significantly below the $18M average. That's a massive discrepancy, and it tells us that this -10% move happened on weak conviction. When you see sharp price moves on below-average volume, it often means the move lacks staying power. Sellers aren't really committed here, and once buyers show up with size, we could see a quick reversal back toward resistance zones. The 24h volume of $105M is decent, but the recent hourly compression suggests we're in a consolidation phase waiting for the next catalyst.
Support levels are well-defined and worth respecting. The first major support sits at $0.1440 where the EMA50 converges with recent price structure. This level has been tested multiple times over the past sessions, and buyers have consistently defended it. Below that, $0.1422 represents the 24h low and the absolute line in the sand for the bullish case. If we break and close below $0.1422 with volume, the structure gets compromised and we'd be looking at a retest of the $0.1375 zone (EMA200) or potentially the lower Bollinger Band at $0.1423. That would shift the entire bias bearish.
On the resistance side, $0.1549 (HMA55) is the immediate hurdle, followed closely by $0.1560 (Bollinger Band upper). These two levels create a tight resistance cluster that price needs to clear with conviction to confirm a bullish continuation. A break above $0.1560 with increasing volume would target $0.1590-$0.1600 initially, and if momentum sustains, we could see a push back toward the $0.1650-$0.1700 zone where prior supply exists from the recent high at $0.1788.
For a trading setup, here's how I'd approach this. If you're looking to enter long, the ideal accumulation zone is $0.1440-$0.1455, right at that EMA50 support where buyers have shown up consistently. Your stop loss needs to be tight below $0.1418 to protect against a breakdown of the support structure. That gives you about 2-3% risk, which is manageable. Target 1 would be $0.1549 (HMA55) for a quick 6-7% gain and 2.5:1 R/R. Target 2 sits at $0.1590 for about 10% upside and 4:1 R/R. Target 3 extends to $0.1650 if momentum really kicks in, giving you 14% potential and nearly 6:1 R/R. Scale out at each target to lock profits while letting runners work.
Alternatively, if you're more conservative or want confirmation, wait for a breakout above $0.1560 with volume exceeding the $18M average. That would confirm buyers are back in control, and you could enter on the retest of $0.1549-$0.1560 as new support with the same target structure but slightly better R/R since your stop would be $0.1530.
The internal market state is showing a bullish bias with 6 bullish factors versus 2 bearish, but directional confidence is only 38.6%, which explains the mixed signals. The regime is trending, but not strongly, and that low-volatility filter being inactive means we could see expansion soon. Price structure is showing both a higher low (bullish) and a lower high (bearish), which confirms we're in a consolidation range waiting for resolution.
Bottom line - HYPER's in a wait-and-see mode with a slight bullish lean. The moving average stack and strong lower wick suggest buyers are defending structure, but weak volume and MACD divergence mean we need confirmation before getting aggressive. Watch $0.1440 support and $0.1560 resistance as your key decision levels. What's your take on this setup - are you waiting for the breakout or accumulating at support?

HYPERUSDT — Long OpportunityPrice formed a BOS + CHoCH and pulled back into the green demand zone. Expect a couple of retest swings there before a breakout above the descending trendline.
Prefer long entries on the zone (~0.134–0.140) with invalidation below 0.1282.
Targets:
$0.1485 (TP1)
$0.1568 (TP2)
$0.1662 (TP3)
Manage risk. Reduce size into targets.
Good Luck!
#HYPER #USDT #Crypto #SupplyDemand #Breakout #SwingTrade

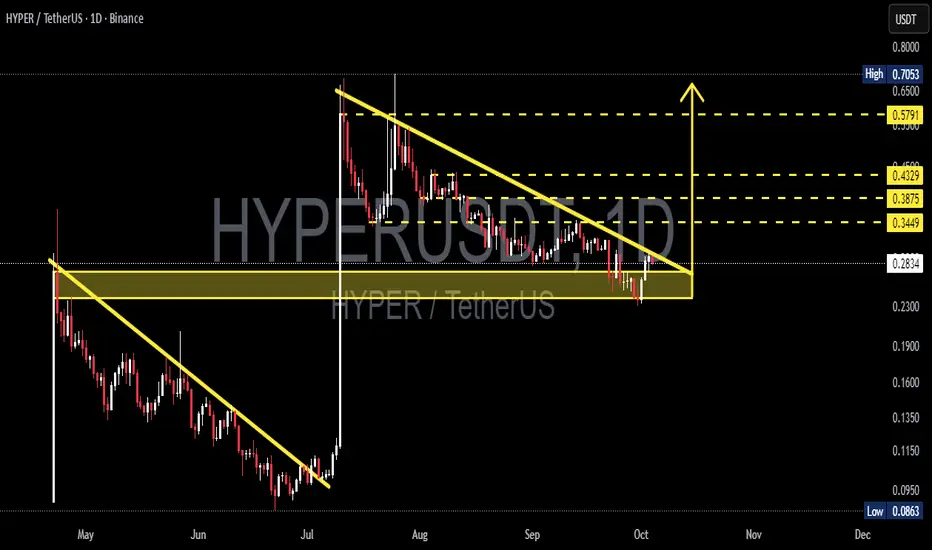
HYPER/USDT — Descending Triangle: Breakout or Breakdown?🔎 Overview
HYPER/USDT is currently trading inside a crucial consolidation zone (0.23–0.29 USDT) while being compressed by a descending trendline.
This setup forms a descending triangle pattern, typically a bearish continuation, but in some cases (especially after a strong rally), it can act as an accumulation phase before another bullish leg.
The market is now at a decision point — waiting for either a confirmed breakout to the upside or a breakdown below support.
---
📌 Pattern & Market Structure
Previous Trend: Strong pump in early July → followed by consolidation with selling pressure.
Main Pattern: Descending Triangle = flat horizontal support + descending trendline of lower highs.
Support Zone: 0.23 – 0.29 (highlighted yellow box on the chart).
Key Resistance Levels (if breakout occurs):
0.3449 → initial target
0.3875 → mid resistance
0.4329 → major resistance
0.5791 → extended target if momentum continues
Historical High/Low: High 0.7053 / Low 0.0863.
---
🚀 Bullish Scenario
1. Confirmation: A strong daily close above the descending trendline, ideally above 0.31.
2. Retest: Breakout gains strength if price retests the trendline and holds as new support.
3. Upside Targets:
TP1: 0.3449
TP2: 0.3875
TP3: 0.4329
TP4: 0.5791 (if rally extends)
4. Invalidation: A daily close below 0.23 invalidates the bullish setup.
---
🐻 Bearish Scenario
1. Confirmation: A daily close below 0.23 with strong volume confirms breakdown.
2. Downside Targets:
0.16 – 0.135 zone → historical support area
0.0863 → previous cycle low, major bearish target
3. Invalidation: If price reclaims and sustains above 0.34, the bearish outlook fails.
---
⚖️ Conclusion & Outlook
Neutral Zone: As long as price stays between 0.23 – 0.30, the market remains sideways without clear direction.
Bullish Outlook: Needs confirmation with daily close above trendline.
Bearish Outlook: Breakdown below 0.23 would shift momentum clearly bearish.
Best Strategy: Wait for confirmation on daily close & volume before entering, since descending triangles are prone to false breakouts.
---
📝 Notes for Traders
Apply strict risk management (1–2% risk per trade).
Take partial profits at each resistance level.
Focus on daily closes and volume spikes for confirmation, not intraday wicks.
---
#HYPERUSDT #Crypto #TechnicalAnalysis #Altcoin #PriceAction #ChartPattern #DescendingTriangle #Breakout #Bearish #Bullish #SupportResistance
HYPER Analysis (4H)From where we placed the red arrow on the chart, the HYPER correction has started.
This corrective pattern might be diametric, with wave E near completion.
By maintaining the green box, it could move toward the targets, which are marked on the chart.
A daily candle closing below the invalidation level will invalidate this analysis.
For risk management, please don't forget stop loss and capital management
When we reach the first target, save some profit and then change the stop to entry
Comment if you have any questions
Thank You
