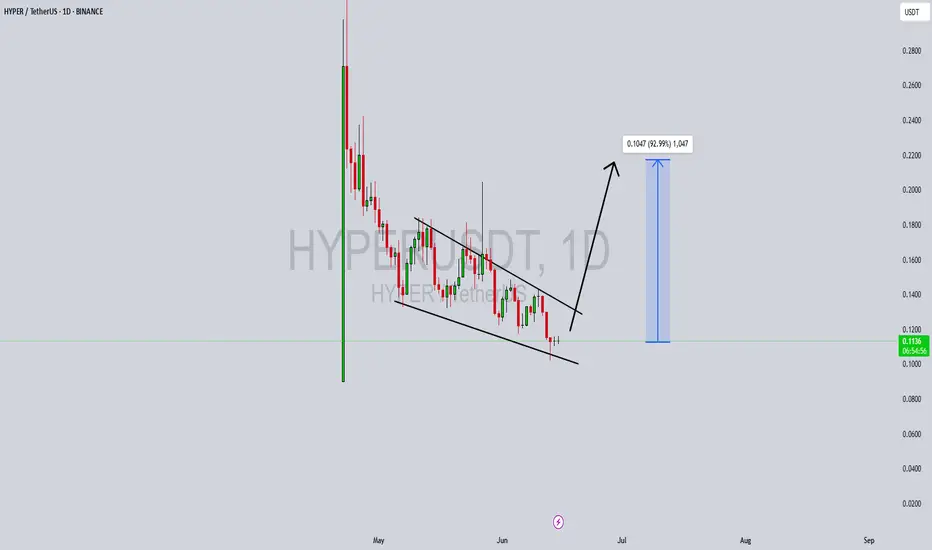
HYPERUSDT Forming Falling WedgeHYPERUSDT is forming a clear falling wedge pattern, a classic bullish reversal signal that often indicates an upcoming breakout. The price has been consolidating within a narrowing range, suggesting that selling pressure is weakening while buyers are beginning to regain control. With consistent volume confirming accumulation at lower levels, the setup hints at a potential bullish breakout soon. The projected move could lead to an impressive gain of around 90% to 100% once the price breaks above the wedge resistance.
This falling wedge pattern is typically seen at the end of downtrends or corrective phases, and it represents a potential shift in market sentiment from bearish to bullish. Traders closely watching HYPERUSDT are noting the strengthening momentum as it nears a breakout zone. The good trading volume adds confidence to this pattern, showing that market participants are positioning early in anticipation of a reversal.
Investors’ growing interest in HYPERUSDT reflects rising confidence in the project’s long-term fundamentals and current technical strength. If the breakout confirms with sustained volume, this could mark the start of a fresh bullish leg. Traders might find this a valuable setup for medium-term gains, especially as the wedge pattern completes and buying momentum accelerates.
✅ Show your support by hitting the like button and
✅ Leaving a comment below! (What is your opinion about this Coin?)
Your feedback and engagement keep me inspired to share more insightful market analysis with you!
HYPERUSDT

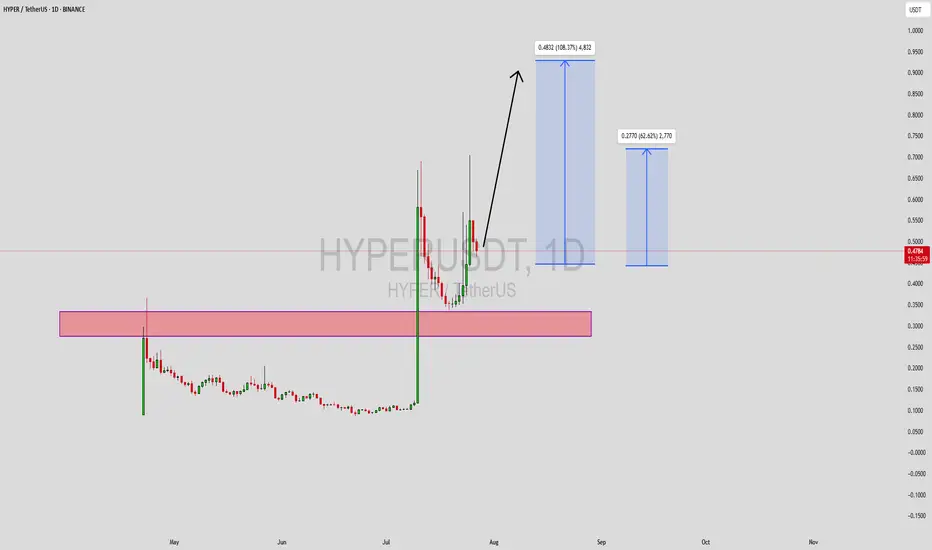
Trendline Compression After 400% Pump – Waiting for Breakout After the previous breakout of the descending trendline, price reacted with a powerful impulse move of over 400% , confirming strong demand and aggressive buying interest.
Since that impulse, the market has been forming a corrective structure and is now compressing back toward the descending trendline. This area is critical — all attention is on the trendline as it represents a key decision point for the next move.
Long setups are only valid on a confirmed breakout and acceptance above the trendline. Until then, patience is required.
If the descending trendline is decisively broken, I’m targeting the $0.30 – $0.33 zone as the next upside objective.
Invalidation: Continued rejection below the trendline

HYPER: waitHey guys! HYPERUSDT's navigating some choppy waters on the 1h timeframe after that sharp -10.34% pullback, but the structure underneath is actually holding up better than the headline number suggests. Let me break down what's happening here and where the opportunities might be developing.
Price is currently trading at $0.1517 after bouncing from a $0.1422 low, and despite the daily drawdown, we're still sitting comfortably above all major moving averages. The EMA20 at $0.1483, EMA50 at $0.1440, and EMA200 at $0.1375 are forming a bullish stack that's providing structural support. When you see price hold above this kind of moving average alignment after a significant wick down, it's telling you that buyers are defending key levels. That's not random - that's institutional memory and algorithmic support kicking in.
The technical indicators are painting a mixed but cautiously bullish picture. RSI's at 58.2, which keeps us in neutral territory but with a slight bullish lean. What's more important than the RSI level itself is the context - we saw a 50% lower wick formation on the recent candle, which is a strong signal that buyers stepped in aggressively to defend the $0.1422 low. That's real demand showing up when it matters most. The MACD's showing some short-term weakness with the histogram at 0.0014 sitting below the signal line at 0.0019, creating a bearish crossover that suggests momentum hasn't fully shifted back yet. But here's the thing - the ADX at 24.2 tells us we're not in a strong trending environment, which means these momentum signals might be less reliable than usual.
Stochastic at 56.8 and MFI at 48.1 are both dead neutral, confirming we're in a decision zone where the next move could go either way based on volume and external catalysts. The Bollinger Bands are showing price above the middle band at $0.1491 but below the upper band at $0.1560, suggesting we're in the upper half of the range without being overextended. The HMA55 at $0.1549 is creating an immediate resistance level that's worth watching closely.
Now let's talk about the volume situation, because this is critical. Current hourly volume is sitting at $2.8M, which is significantly below the $18M average. That's a massive discrepancy, and it tells us that this -10% move happened on weak conviction. When you see sharp price moves on below-average volume, it often means the move lacks staying power. Sellers aren't really committed here, and once buyers show up with size, we could see a quick reversal back toward resistance zones. The 24h volume of $105M is decent, but the recent hourly compression suggests we're in a consolidation phase waiting for the next catalyst.
Support levels are well-defined and worth respecting. The first major support sits at $0.1440 where the EMA50 converges with recent price structure. This level has been tested multiple times over the past sessions, and buyers have consistently defended it. Below that, $0.1422 represents the 24h low and the absolute line in the sand for the bullish case. If we break and close below $0.1422 with volume, the structure gets compromised and we'd be looking at a retest of the $0.1375 zone (EMA200) or potentially the lower Bollinger Band at $0.1423. That would shift the entire bias bearish.
On the resistance side, $0.1549 (HMA55) is the immediate hurdle, followed closely by $0.1560 (Bollinger Band upper). These two levels create a tight resistance cluster that price needs to clear with conviction to confirm a bullish continuation. A break above $0.1560 with increasing volume would target $0.1590-$0.1600 initially, and if momentum sustains, we could see a push back toward the $0.1650-$0.1700 zone where prior supply exists from the recent high at $0.1788.
For a trading setup, here's how I'd approach this. If you're looking to enter long, the ideal accumulation zone is $0.1440-$0.1455, right at that EMA50 support where buyers have shown up consistently. Your stop loss needs to be tight below $0.1418 to protect against a breakdown of the support structure. That gives you about 2-3% risk, which is manageable. Target 1 would be $0.1549 (HMA55) for a quick 6-7% gain and 2.5:1 R/R. Target 2 sits at $0.1590 for about 10% upside and 4:1 R/R. Target 3 extends to $0.1650 if momentum really kicks in, giving you 14% potential and nearly 6:1 R/R. Scale out at each target to lock profits while letting runners work.
Alternatively, if you're more conservative or want confirmation, wait for a breakout above $0.1560 with volume exceeding the $18M average. That would confirm buyers are back in control, and you could enter on the retest of $0.1549-$0.1560 as new support with the same target structure but slightly better R/R since your stop would be $0.1530.
The internal market state is showing a bullish bias with 6 bullish factors versus 2 bearish, but directional confidence is only 38.6%, which explains the mixed signals. The regime is trending, but not strongly, and that low-volatility filter being inactive means we could see expansion soon. Price structure is showing both a higher low (bullish) and a lower high (bearish), which confirms we're in a consolidation range waiting for resolution.
Bottom line - HYPER's in a wait-and-see mode with a slight bullish lean. The moving average stack and strong lower wick suggest buyers are defending structure, but weak volume and MACD divergence mean we need confirmation before getting aggressive. Watch $0.1440 support and $0.1560 resistance as your key decision levels. What's your take on this setup - are you waiting for the breakout or accumulating at support?

HYPERUSDT — Long OpportunityPrice formed a BOS + CHoCH and pulled back into the green demand zone. Expect a couple of retest swings there before a breakout above the descending trendline.
Prefer long entries on the zone (~0.134–0.140) with invalidation below 0.1282.
Targets:
$0.1485 (TP1)
$0.1568 (TP2)
$0.1662 (TP3)
Manage risk. Reduce size into targets.
Good Luck!
#HYPER #USDT #Crypto #SupplyDemand #Breakout #SwingTrade

$HYPER Near Demand Zone$HYPER is currently retesting its key support trendline after a steady uptrend.
If this zone holds, a rebound looks likely, but a breakdown could trigger deeper correction toward the S/R zone.
DYOR, NFA

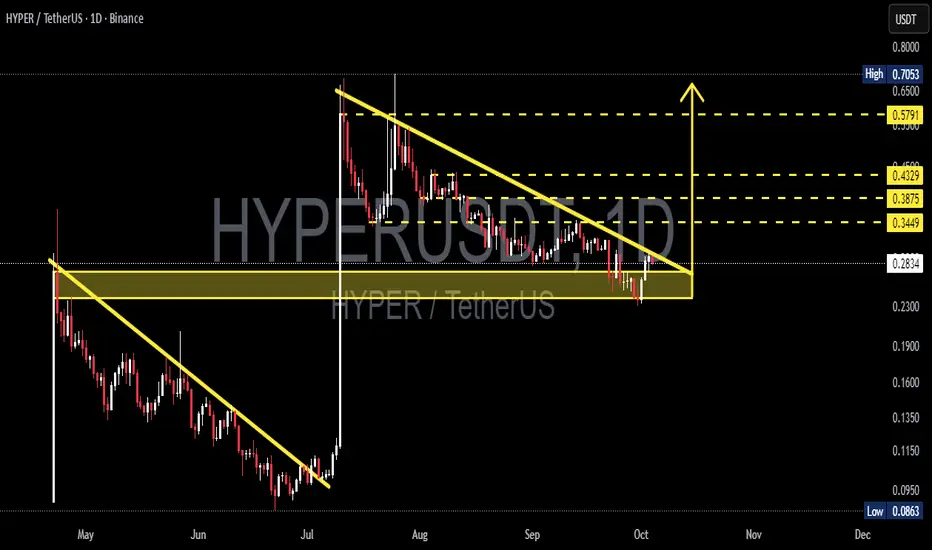
HYPER/USDT — Descending Triangle: Breakout or Breakdown?🔎 Overview
HYPER/USDT is currently trading inside a crucial consolidation zone (0.23–0.29 USDT) while being compressed by a descending trendline.
This setup forms a descending triangle pattern, typically a bearish continuation, but in some cases (especially after a strong rally), it can act as an accumulation phase before another bullish leg.
The market is now at a decision point — waiting for either a confirmed breakout to the upside or a breakdown below support.
---
📌 Pattern & Market Structure
Previous Trend: Strong pump in early July → followed by consolidation with selling pressure.
Main Pattern: Descending Triangle = flat horizontal support + descending trendline of lower highs.
Support Zone: 0.23 – 0.29 (highlighted yellow box on the chart).
Key Resistance Levels (if breakout occurs):
0.3449 → initial target
0.3875 → mid resistance
0.4329 → major resistance
0.5791 → extended target if momentum continues
Historical High/Low: High 0.7053 / Low 0.0863.
---
🚀 Bullish Scenario
1. Confirmation: A strong daily close above the descending trendline, ideally above 0.31.
2. Retest: Breakout gains strength if price retests the trendline and holds as new support.
3. Upside Targets:
TP1: 0.3449
TP2: 0.3875
TP3: 0.4329
TP4: 0.5791 (if rally extends)
4. Invalidation: A daily close below 0.23 invalidates the bullish setup.
---
🐻 Bearish Scenario
1. Confirmation: A daily close below 0.23 with strong volume confirms breakdown.
2. Downside Targets:
0.16 – 0.135 zone → historical support area
0.0863 → previous cycle low, major bearish target
3. Invalidation: If price reclaims and sustains above 0.34, the bearish outlook fails.
---
⚖️ Conclusion & Outlook
Neutral Zone: As long as price stays between 0.23 – 0.30, the market remains sideways without clear direction.
Bullish Outlook: Needs confirmation with daily close above trendline.
Bearish Outlook: Breakdown below 0.23 would shift momentum clearly bearish.
Best Strategy: Wait for confirmation on daily close & volume before entering, since descending triangles are prone to false breakouts.
---
📝 Notes for Traders
Apply strict risk management (1–2% risk per trade).
Take partial profits at each resistance level.
Focus on daily closes and volume spikes for confirmation, not intraday wicks.
---
#HYPERUSDT #Crypto #TechnicalAnalysis #Altcoin #PriceAction #ChartPattern #DescendingTriangle #Breakout #Bearish #Bullish #SupportResistance
HYPERUSDT UPDATE#HYPER
UPDATE
HYPER Technical Setup
Pattern: Bullish falling wedge breakout
Current Price: $0.2634
Target Price: $0.565
Target % Gain: 100.89%
HYPER is breaking out of a falling wedge pattern on the 1D timeframe, indicating a strong bullish reversal setup with potential to nearly double from current levels. Always use proper risk management when trading.

HYPERUSDT Forming Falling WedgeHYPERUSDT is showing a classic falling wedge pattern, which is widely recognized as a strong bullish reversal signal in technical analysis. This setup indicates that downward momentum is gradually weakening while buyers are accumulating, preparing the market for a potential breakout to the upside. Based on the current structure, the expected move could deliver gains in the range of 170% to 180%+, offering traders and investors an exciting opportunity.
Volume has remained healthy, further validating the strength of this pattern. A breakout accompanied by a surge in volume would serve as a powerful confirmation that bulls are ready to take control. This level of interest suggests that market participants are keeping a close eye on HYPERUSDT, which adds confidence to the bullish scenario.
Investor sentiment is building as this project continues to attract attention, with more traders positioning themselves for the potential breakout. If momentum continues, the technical alignment of the falling wedge alongside positive market dynamics could push HYPERUSDT into a strong rally phase.
✅ Show your support by hitting the like button and
✅ Leaving a comment below! (What is You opinion about this Coin)
Your feedback and engagement keep me inspired to share more insightful market analysis with you!

Memecoin is risky but profitable...Hello friends🙌
Given the channel's failure on the weekly time frame, there is now a good opportunity to buy in the price reversal or price correction, of course, with capital and risk management.
🔥Follow us for more signals🔥
*Trade safely with us*

Hype Breakout Above $47.6?Hype continues to consolidate near the 45.95 resistance on the 4-hour chart. In this update, I break down the short-term roadmap with clear resistance and support levels. A breakout above 45.95 could open the way to 47.57, 49.32, and even 52.14 in the coming sessions.
On the downside, supports to watch are 44.32, 42.58, and 40.49. The broader structure remains constructive above 38.27, and my bias continues to be for more upside as long as that foundation holds. Watch these levels closely as they will define the next move for Hype.

HYPERUSDT Forming Bullish WaveHYPERUSDT is forming a compelling bullish wave pattern, a continuation formation indicating strong upward momentum is building following a recent correction and consolidation. This pattern typically reflects renewed buyer strength, marked by higher highs and higher lows as momentum reasserts itself—high-probability setup territory for traders looking for continuation moves.
Recent price action supports this bullish outlook: the pair has broken above a key resistance level on solid volume, reinforcing the pattern and increasing the likelihood of further upward acceleration. This breakout phase is often where traders look to position for the next leg up, and with volume backing the move, confidence in the rally's sustainability grows.
Fundamentally, the project behind HYPER is gaining traction as well. Bitcoin Hyper is positioning itself as a layer-2 scaling solution for Bitcoin—built using the Solana Virtual Machine for high performance and scalability. It offers near-instant(tx) finality and low-cost transactions, enabling DeFi, gaming, and app development on Bitcoin’s network. The narrative is gaining further momentum, with its presale surpassing $8 million and promising massive upside potential, especially in a renewed bull market.
Putting it all together, HYPERUSDT has the technical structure, volume support, and narrative tailwinds lining up perfectly for a strong bullish run. Traders targeting continuation setups should monitor for sustained price action above key levels. The projected 90% to 100%+ upside reflects the strength of this confluence.
✅ Show your support by hitting the like button and
✅ Leaving a comment below! (What is your opinion about this Coin)
Your feedback and engagement keep me inspired to share more insightful market analysis with you!

HYPERUSDT Forming Bullish ContinuationHYPERUSDT is capturing significant attention as it emerges from a consolidation zone, signaling a potential bullish continuation. After a massive impulse move to the upside, the price found support at a critical zone, which has now flipped into a demand area. This area is acting as a strong base for buyers, with volume steadily increasing—a key indication of accumulation and renewed interest from market participants.
Currently, the price is forming a structure that reflects bullish momentum, supported by recent higher lows and increased wick rejections from below. This kind of setup often precedes a strong breakout, especially when reinforced by strong volume, as seen here. The chart suggests a potential upside move of over 130%, targeting previous liquidity zones and untouched resistance areas, as buyers step in aggressively.
HYPER is becoming a trending topic in the altcoin space, with investors closely watching its price action for signs of a full recovery. As trading sentiment shifts bullish and on-chain metrics support the narrative, HYPERUSDT stands out as one of the higher potential mid-cap coins. A breakout beyond recent highs could quickly accelerate gains, given the relatively thin resistance levels above.
This setup is ideal for breakout traders and swing positions, especially as the broader market regains confidence. Patience and technical confirmation will be key, but HYPERUSDT is positioning itself as a standout opportunity for the weeks ahead.
✅ Show your support by hitting the like button and
✅ Leaving a comment below! (What is You opinion about this Coin)
Your feedback and engagement keep me inspired to share more insightful market analysis with you!

HYPERUSDT Forming Bullish ReversalHYPERUSDT is currently forming a bullish reversal pattern, suggesting a potential shift in momentum from bearish to bullish. This type of setup typically emerges after a downtrend, signaling that sellers are losing strength and buyers are preparing to reclaim control. The current chart shows early signs of trend exhaustion with tightening price action, which often precedes a breakout in the opposite direction. This setup is particularly attractive for swing traders looking to capitalize on a major reversal.
Volume activity is supporting the reversal thesis, with increased accumulation evident at key support zones. This suggests strong interest from investors and smart money anticipating a move higher. Bullish reversal patterns backed by volume typically lead to sharp rallies, and based on this structure, HYPERUSDT has the potential to deliver gains of 90% to 100%+ in the coming sessions. Confirmation of this setup will be a breakout above the neckline or key resistance with sustained buying volume.
Investor sentiment around HYPER is also improving, fueled by growing community support and rising visibility in crypto forums and social platforms. Technically, the coin is sitting at a major inflection point where a clean break can result in a parabolic upside move. Traders should remain alert for breakout confirmation and be ready to manage risk accordingly for maximum reward potential.
This trade idea aligns well with common reversal setups seen in successful altcoin rallies. If executed with precision, it offers both technical strength and strong upside risk-to-reward profile.
✅ Show your support by hitting the like button and
✅ Leaving a comment below! (What is You opinion about this Coin)
Your feedback and engagement keep me inspired to share more insightful market analysis with you!
HYPERUSDT Forming Bullish WaveHYPERUSDT is currently showcasing a bullish wave pattern, a strong technical formation that often signals the continuation of an upward move after a healthy correction or consolidation. This wave structure suggests that bulls are regaining control, creating the potential for a significant price expansion. With volume remaining solid and consistent, this aligns well with the expected upside breakout, making this a promising setup. Analysts and short-term traders alike are eyeing a 90% to 100%+ gain from the current levels based on wave projection.
The growing interest around the HYPER project adds a layer of fundamental strength to the technical setup. With active community engagement and strategic development updates, HYPERUSDT has been catching investor attention across crypto forums and social media platforms. This increasing visibility could further drive price action, especially if market conditions remain favorable for altcoin momentum.
Looking at historical price movements, HYPERUSDT has shown the capacity for sharp, impulsive waves followed by periods of consolidation—characteristics of a trending asset. If the current bullish wave completes its projected move, it could push the price back into a previous resistance zone or even break into price discovery, depending on broader market sentiment.
Given the technical pattern confirmation and rising investor interest, HYPERUSDT is shaping up to be a strong short-to-mid-term play. Traders looking for volatility and high-reward setups may want to keep this pair on their active watchlist.
✅ Show your support by hitting the like button and
✅ Leaving a comment below! (What is You opinion about this Coin)
Your feedback and engagement keep me inspired to share more insightful market analysis with you!

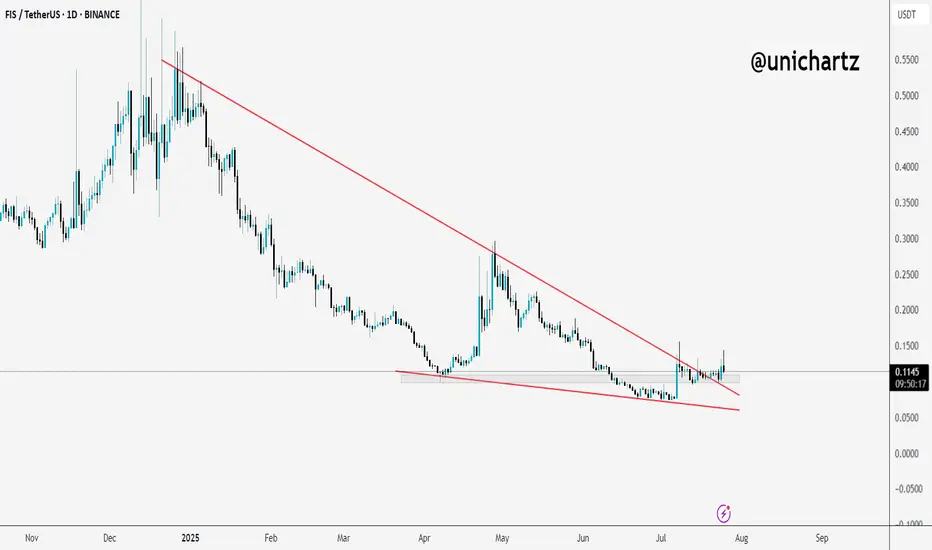
FIS Breaks Out of Falling Wedge – Reversal in Play?$FIS/USDT has finally broken out of a long-term falling wedge pattern, a structure that often signals reversal.
Price is now holding above the breakout zone, showing signs of strength.
As long as it stays above the wedge, we might see further upside in the coming days.
DYOR, NFA
HYPERUSDT Forming Falling WedgeHYPERUSDT is catching the attention of traders with its clear falling wedge pattern, a technical formation often linked to strong bullish reversals. This setup signals that the asset has been consolidating within narrowing trendlines and may soon break out with significant momentum. With volume levels holding steady, the conditions are aligning for a potential explosive move that could deliver an impressive 290% to 300% gain for investors who position themselves early.
The HYPER project is starting to build a name for itself in the crypto space, attracting investors interested in its unique blockchain applications and real-world utility. As awareness of the project grows and its community expands, more market participants are likely to accumulate HYPERUSDT, providing further fuel for a breakout. The increased interest is reflected not just in price action but also in the steady rise in trading activity, which often precedes major upswings.
Technically, the falling wedge is one of the most reliable patterns for identifying trend reversals. Once the price convincingly breaks above the descending resistance line with a surge in buying volume, it can trigger a wave of bullish momentum as traders and algorithms react to the breakout confirmation. It’s important to monitor this breakout closely and manage risk wisely to capitalize on this high-probability setup.
✅ Show your support by hitting the like button and
✅ Leaving a comment below! (What is You opinion about this Coin)
Your feedback and engagement keep me inspired to share more insightful market analysis with you!

HYPER ANALYSIS🔮 #HYPER Analysis - Update 🚀🚀
💲 We can see that there is a formation of Falling Wedge Wedge Pattern in #HYPER and we can see a bullish movement after a good breakout. Before that we would see a little retest and and then a bullish movement.
💸Current Price -- $0.1087
📈Target Price -- $0.1358
⁉️ What to do?
- We have marked crucial levels in the chart . We can trade according to the chart and make some profits. 🚀💸
#HYPER #Cryptocurrency #Breakout #DYOR

HYPERUSDT Forming Strong Bullish ReversalHYPERUSDT is currently trading within a classic falling wedge pattern — a formation known for signaling strong bullish reversals once a breakout occurs. This structure is typically a sign of seller exhaustion and accumulation by smart money, particularly when accompanied by steady or rising volume, as we see now. With bullish divergence becoming more apparent on momentum indicators, the technical conditions are aligning for a significant price rally.
This setup suggests the potential for an explosive breakout to the upside, with a projected gain range of 80% to 90%+ once the upper resistance of the wedge is decisively breached. The falling wedge is forming at the tail end of a sustained downtrend, which often serves as a base for major upward reversals. A breakout above key resistance could bring a sharp bullish wave, pushing HYPERUSDT back toward previous supply zones and even forming new local highs.
Investor interest in the HYPER project is gaining traction, with increasing mentions across social platforms and a noticeable uptick in trading activity. As new capital flows into smaller-cap altcoins showing promising technicals, HYPER appears to be on many watchlists, especially among swing traders and early-stage investors looking for asymmetric risk/reward setups.
Overall, HYPERUSDT is offering a compelling opportunity based on this pattern. A confirmed breakout from the wedge may trigger strong momentum in the days ahead, particularly as market sentiment leans increasingly risk-on.
✅ Show your support by hitting the like button and
✅ Leaving a comment below! (What is You opinion about this Coin)
Your feedback and engagement keep me inspired to share more insightful market analysis with you!
Hyperlane Short-Term (134% Profits Potential)Hyperlane (HYPERUSDT) produced a v shaped bottom recently as it broke out of a major downtrend. This chart is not very strong as there isn't much volume but the action is already happening above EMA55 which is a strong bullish signal.
The low volume signal can be ignored because price action is more important when it comes to reading a chart. Volume can be low, or high, for a number of reasons. The volume indicator can be a great tool but it doesn't work without a context and it can be easily misinterpreted.
We can use it to support other signals but never in isolation nor to make a decision based on what the trading volume of a pair is doing.
Current price action, the break above this mid-term moving average, marketwide action and Bitcoin trading above $100,000 are all bullish signal. So we can easily make the assumption that HYPERUSDT will continue to grow. Not that it will grow, but that this is the most likely scenario in the coming weeks and months.
Market conditions can always change and they already changed from bearish to bullish last month. it will take a while before the market goes back into bearish mode. A bullish cycle can last anywhere between 6 to 12 months.
Namaste.

HYPER Analysis (4H)From where we placed the red arrow on the chart, the HYPER correction has started.
This corrective pattern might be diametric, with wave E near completion.
By maintaining the green box, it could move toward the targets, which are marked on the chart.
A daily candle closing below the invalidation level will invalidate this analysis.
For risk management, please don't forget stop loss and capital management
When we reach the first target, save some profit and then change the stop to entry
Comment if you have any questions
Thank You
