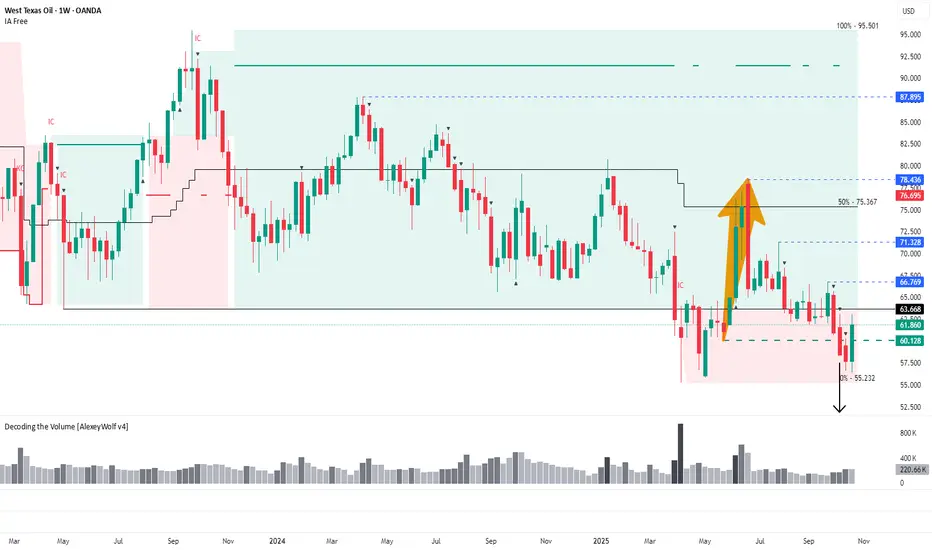
WTI: Possible reversal after false breakout of 60.128Weekly range structure may define oil’s direction for the coming months — buyers defend key support, while targets above 66.769 remain in focus.
Hi traders and investors!
This analysis is based on the Initiative Analysis (IA) concept.
On the weekly timeframe, a sideways range has been in place since April 2023, followed by a transitional phase.
Sellers managed to push the price below the lower boundary of this range — the first breakout occurred in March 2025.
After that, buyers brought the price back inside the range and reached the 50% level of the trading zone, from where sellers resumed control and once again pushed the price below the lower boundary at 63.668.
What’s interesting here is that earlier there was a buyer’s move returning the price into the range, with its base around 60.128.
We now see a seller candle attacking this level on high volume, followed by another seller candle with even higher volume, after which the price returned above 60.128.
This behavior may signal a false breakout (manipulation) of that level.
If this interpretation holds, the next potential upside targets are:
66.769 — first target,
71.328 — second target,
78.436 — third target,
followed by 87.895 and possibly 95.501.
Key points to watch:
whether buyers defend the 60.128 level if the price pulls back,
and whether they manage to break through the range boundary at 63.668, and then 66.769
.
If buyers succeed in holding above these two levels, the buyer’s vector is likely to continue developing toward the mentioned upside targets.
Wishing you profitable trades!
Iafree
Gold buyers showing signs of activityHi traders and investors!
This analysis is based on the Initiative Analysis (IA) concept.
Daily Timeframe
We can see that volume is starting to appear from the buyer zone located at the base of the last buyer initiative.
Yesterday’s seller activity didn’t bring any visible result — the candle closed inside the previous one.
Still, this leaves hope that there is a buyer active in this area, and we may soon see a move from their side.
1-hour timeframe
On the 1-hour timeframe, a sideways range has formed.
The buyer initiative currently has a target at 4127 — let’s watch how this movement develops.
Inside this initiative, we now have a key seller bar - IC on the chart, which was absorbed by the buyer.
There has already been a first attempt of a rebound from this buyer zone, and it’s currently unfolding. We’ll see how it plays out.
If the first attempt fails, we can look for local long opportunities from the support level around 4065 or 4004.
Wishing you profitable trades!

Double Fakeout on GoldHi traders and investors!
This analysis is based on the Initiative Analysis (IA) concept.
Gold has corrected by 6.5% from its peak and so far shows no signs of recovery.
On the 1-hour timeframe, the market is in a sideways range.
First, there was a false breakout below the lower boundary, and then a false breakout above the upper boundary of the range.
Now the seller has broken through the lower boundary of the sideways range, and the price has dropped below the 50% level of the daily buyer initiative.
At the base of the last buyer initiative on the daily timeframe, there is a buyer zone between 4058 and 3944 — a good area to look for potential trade setups.
Wishing you profitable trades!

Gold: First signs of a correction after a strong rallyHi traders and investors!
This analysis is based on the Initiative Analysis (IA) concept.
For the past nine weeks, gold has been flying upward — and now we’re starting to see signs of a pause in growth or even the beginning of a correction.
Friday’s candle showed very high volume, and this volume came from the seller side.
A similar, though smaller, volume was seen on August 8.
This could indicate that we may enter a correction or sideways phase.
The range of the most recent buyer initiative on the daily timeframe is quite wide.
Yesterday, the price came close to the 50% level of that initiative, but didn’t quite reach it.
The key levels to watch for potential buys are:
50% level of the buyer initiative — 4162,
upper boundary of the previous buyer initiative — 4059.
By the way, on the weekly timeframe, last week’s trading volume was the highest since March 2022.
All these signs point to a possible pause in growth.
Wishing you profitable trades!

Bitcoin: key buyer levels may lie lowerHi traders and investors!
This analysis is based on the Initiative Analysis concept (IA).
Let me remind you that on the weekly timeframe, Bitcoin still hasn’t managed to launch an upward trend after breaking out of the sideways range. The market is currently in a transitional phase, with buyer initiative above and seller initiative below.
Price has already attempted to break upward from the buyer initiative twice — during the weeks of August 11 and September 29. Now, the price has returned back into the range.
We also see declining volumes on the monthly chart, showing that the buyer clearly lacks strength.
At the moment, sellers are facing support around 105,100 — the base of the July 2025 monthly candle. It’s not a bad context for looking for buys, if only the candle had strong volume.
We’ll see how things develop on the daily timeframe. If the price consolidates below 107,255 (the breakout test level on the weekly TF) and then buyers absorb the seller’s candle from October 17, that could create a reason to look for longs.
On the weekly timeframe, there are also interesting levels to watch for potential buys:
— 50% of the trading range — 100,353 (which also aligns with the 50% monthly level);
— the base of the breakout move from the range — 98,200.
Of course, this all depends on whether the buyer actually shows up — with volume and spread.
This 100,500–98,000 zone remains an important buyer defense area if they intend to keep the price from dropping below 90,000.
Wishing you profitable trades!

DXY: Sellers Take ControlHi traders and investors!
This analysis is based on the Initiative Analysis concept (IA).
The US Dollar Index (DXY) formed a sideways range on the daily timeframe at the end of June. The seller’s initiative is now active, with a target at 96.767.
Before that, there was a buyer initiative, and we can see that at the end of it, there was a manipulation around the 98.640 level.
A buyer attack occurred on high volume, but the sellers absorbed the buyer’s attack candle and pushed the price downward on October 15.
The price may return to retest either 98.65 - 98.35 area. However, the main movement on the Dollar Index remains downward.
Wishing you profitable trades!
