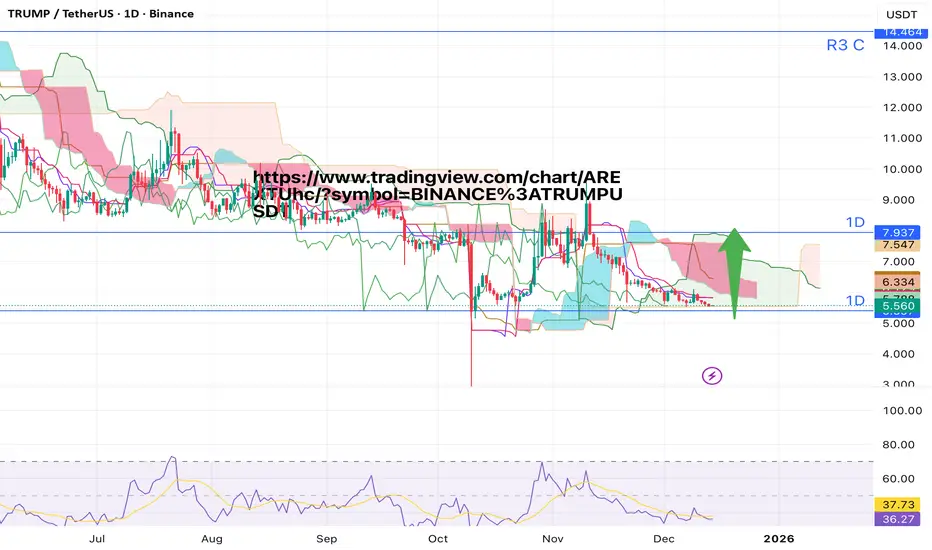
Trump Possible Bottom on 1D & 3D Cloud Structure- I'm just noticed we literally testing the 1st ever cloud support for Trump Coin1D chart (since it's been released).
I also noticed if you look at the 3D with long term and short term settings it's also sitting right on its first ever 3D support line.
www.tradingview.com
Ichimoku_trader
XAUUSD Daily AnalysisBased on ichimoku's data XAUUSD long-term trend is still bulish.
Xauusd is in the short-term downward trend.
if it cannot break through the support level (3962) with ichimoku elements, it will change its direction to resistence levels, but if it can, it will continue to highlighted support levels which are very important for gold and you can consider it as long-term support zones.

BTC Daily Analysisbased on our previous analysis bitcon made an announced ATHs and drop down from that point.
it is near our important support levels. we expect BTC ranges between its support and resistance levels.
in weekly timeframe we can't see any signs of downward movement.
if any of these levels breaks with ichimoku confirmation, i will update the analysis.

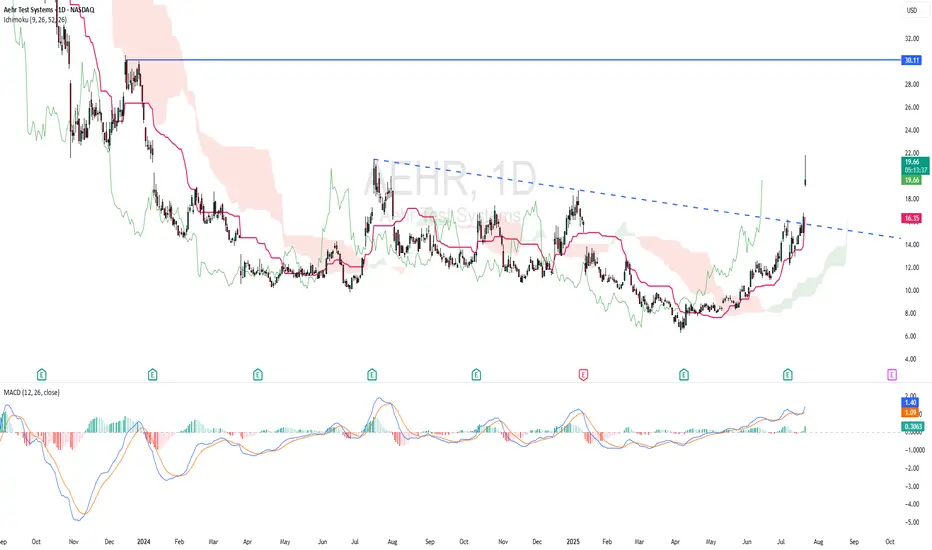
AEHR - RISING WINDOWTechnically AEHR is bullish as the stock made a strong rising window. Based on ICHIMOKU CLOUD, price is above cloud and chikou span is above candlestick - indicating bullish scenario. Kijun Sen is rising. MACD indicator showing bullish momentum.
ENTRY PRICE : 19.30 - 19.70
TARGET : 30.00 (potential almost 50% roi)
SUPPORT : 14.72
Bullish flag The bullish flag pattern has formed .
and based on FiboNachi and Ichimiko data, it can also rise.

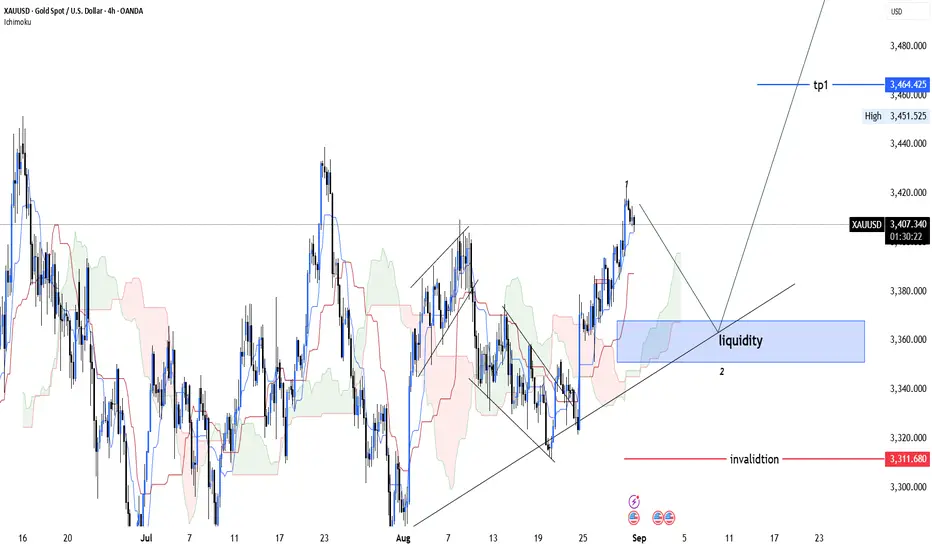
xauusd daily📊 XAU/USD – Wave Analysis
Gold is likely finishing Wave 1 and could correct down to 3352–3370 to complete Wave 2.
🔎 Analysis based on Fundamentals + Ichimoku + Elliott Wave
XAUUSD Daily AnalysisWe expect correction to highlighted support levels.
based on ichimoku 3166.5 is an important one.
after reaction to these levels, analysis will be updated.

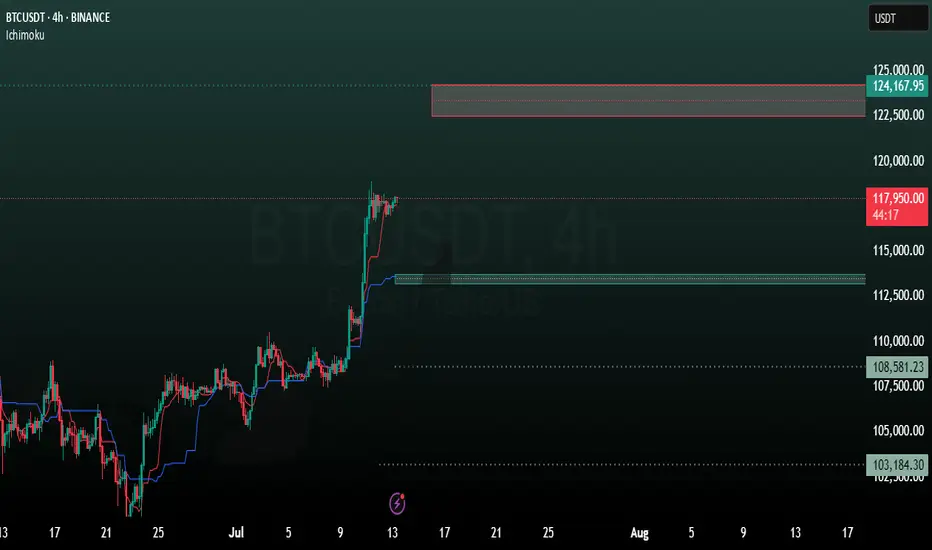
BTC Daily AnalysisBased on ichimoku, we mentioned 124474 as resistance level and 110858 and 113181 as support zone ,the price ranging between these two levels. we expect corretion after breaking out this zone.
all important levels are highlighted on the chart.
as usuall, you can trade on every single levels.

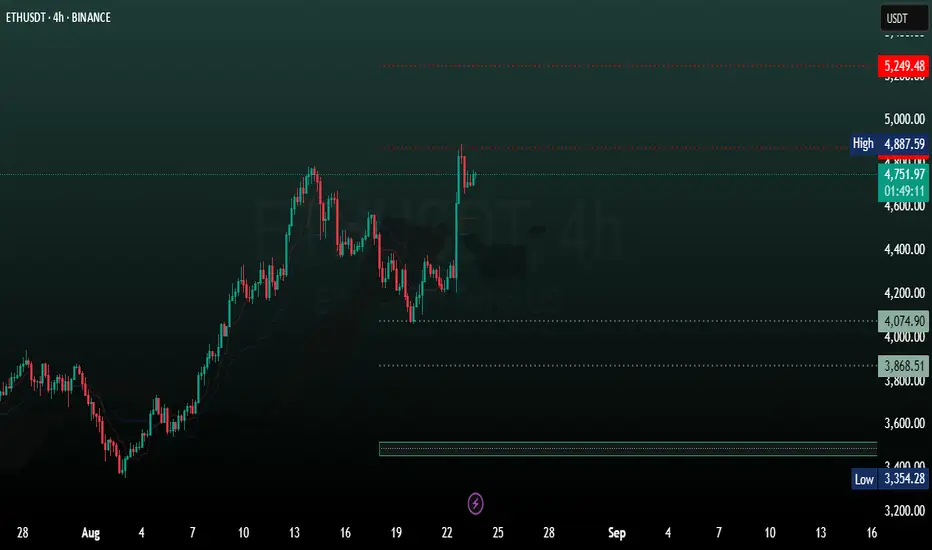
Ethereum 4H AnalysisBased on ichimoku data, the ethereum long-term trend is upward.
we are expecting new ATHs!
Resistence levels:
5249
5773
Support levels:
3500
3118
HSSEB - ASCENDING TRIANGLE BREAKOUT !HSSEB - CURRENT PRICE : RM0.710
HSSEB is bullish because :
The stock is above 50-day EMA.
The share price is above ICHIMOKU CLOUD
CHIKOU SPAN is above CANDLESTICK
RSI is above 50
Today (20 August 2025) the stock broke out ASCENDING TRIANGLE pattern with high trading volume - indicating strong bullish momentum. The stock may trend higher in near term.
ENTRY PRICE : RM0.700 - RM0.710
TARGET : RM0.780 and RM0.845
SUPPORT : 50-day EMA (CUTLOSS if price close below 50-day EMA)

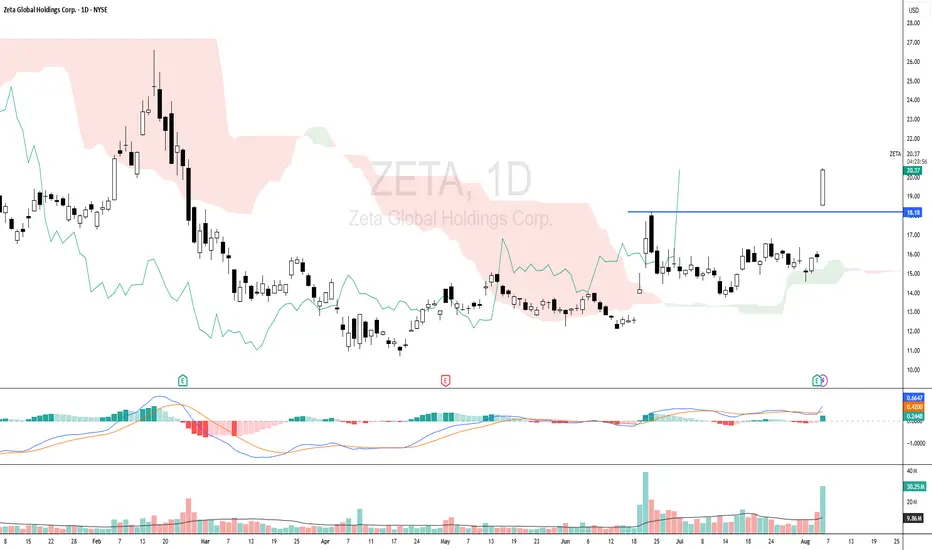
ZETA - BREAKOUT NEAREST RESISTANCEZETA - CURRENT PRICE : 20.10 - 20.25
ZETA broke out its nearest resistance 18.18 after the company announced its Quarter Earnings. For more details regarding earnings, investors/traders may visit company's website.
This bullish price action is supported by high trading volume - indicating strong buying interest from investors/traders. MACD is bullish. For ICHIMOKU CHARTS TRADERS, take note that CHIKOU SPAN is moving above candlestick which give a bullish outlook.
ENTRY PRICE : 20.00 - 20.30
TARGET : 21.50 , 23.00 and 24.50
SUPPORT : Below 18.18 (CUT LOSS below 18.18 on closing basis)
The cloud with the help of the Tenkan we will rise!!Shit is about to get real.
I was telling folk to look at BTC @ $19....
This could be the time.
NOT FINANCIAL ADVICE

XAUUSD 4H AnalysisXauusd breaks the downward trendline and changes its direction toward important resistence levels 3369-3374. This zone is very important based on ichimoku, so we expect good reaction. after the reaction, the chart will be updated.
important support level is 3317.

Trend Exhaustion Detected – Bearish Structure AheadUS100 (NASDAQ) 30-minute chart as of July 26, 2025, with technical insights based on the visible elements.
🔍 1. Trend Analysis
Primary Trend: Uptrend (bullish structure)
The price has been respecting a rising parallel channel, marked by:
Ascending support (lower boundary)
Ascending resistance (upper boundary)
Market structure shows:
Higher Highs (HH)
Higher Lows (HL)
✅ This indicates continuation of bullish momentum until structure breaks.
📐 2. Market Structure Elements
Structure Type Label on Chart Price Zone (approx.)
Break of Structure (BOS) BOS (center-left) ~22,950
Higher Low (HL) HL (2x) ~22,700 (1st), ~23,050 (2nd)
Higher High (HH) HH (2x) ~23,150 and ~23,300
Resistance Labelled ~23,300–23,320
Demand Zones Labelled ~22,450–22,700
🔁 Break of Structure (BOS)
The BOS occurred after a prior swing low was broken, followed by a new higher high, confirming a bullish shift.
🧱 3. Support / Resistance Analysis
🔼 Resistance Zone
The price is testing strong resistance around 23,300–23,320
Multiple rejections in this area
Trendline resistance also aligns here
A rejection arrow is drawn, indicating potential bearish reaction
🔽 Support Zone (Immediate)
23,180–23,220: highlighted green box is a local support block
If broken, likely to revisit 23,000–23,050, or even down to 22,900 range
🟩 4. Demand Zones
Zone 1:
22,450–22,600: Strong bullish reaction historically — likely to act as a key demand if a deeper pullback occurs
Zone 2:
22,850–22,950: Validated with prior accumulation & BOS event
🧠 5. Key Observations
Price is at a critical inflection zone:
Testing a resistance zone
At the upper trendline of an ascending channel
A bearish reaction is projected (black arrow)
Possibly targeting the green support zone around 23,180–23,220
If that fails, demand at ~23,000 will likely be tested
Ichimoku Cloud:
Currently price is above the cloud → still bullish
Cloud is thin → potential weakness or upcoming consolidation
⚠️ 6. Trading Bias & Setup Ideas
✅ Bullish Bias (if price holds above ~23,180)
Long entries can be considered on bullish reaction from support
Target: retest of 23,300–23,350 or even breakout continuation
❌ Bearish Bias (if breakdown below support)
Short entry valid below 23,180 with:
TP1: 23,050
TP2: 22,900
A breakdown from the ascending channel would signal trend exhaustion
🔚 Conclusion
Current Price: 23,298.4
Trend: Bullish, but at resistance
Next move: Watch for reaction at resistance and support box below
Bias: Neutral-to-bullish unless the structure breaks below ~23,180

Fart Ichimoku Breakout Test📈 Checking bullish signals on the chart
✅ Positive signs:
- The price is stable above the cloud and the candles show the strength of buyers.
- Indicators such as RSI and trading volume are in a good position.
- The cloud broke with the body
First profit limit 1/451
Second profit limit 1/551
Limit of loss 1/320

BTC 4H analysisBased on our previous analysis, BTC trend is still bullish. It reacts to our mentioned support level (98699) and moving to new resistance levels.
ICHIMOKU shows these levels as resistance:
122500
124000
137000
And these as support:
113788
113181
108581
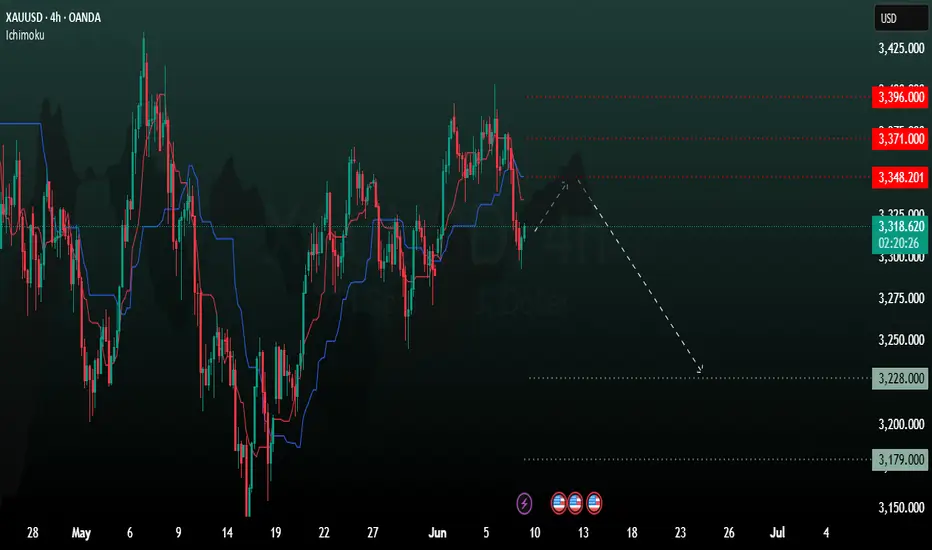
XAUUSD 4H AnalysisBased on Ichimoku, we expect short-term uptrend toward 3348 and after that we expect rejection from these levels and starting downward movement to support levels (3228-3179).
we consider all these levels as valuable zones for our trading so be cautious about the reaction of XAUUSD.
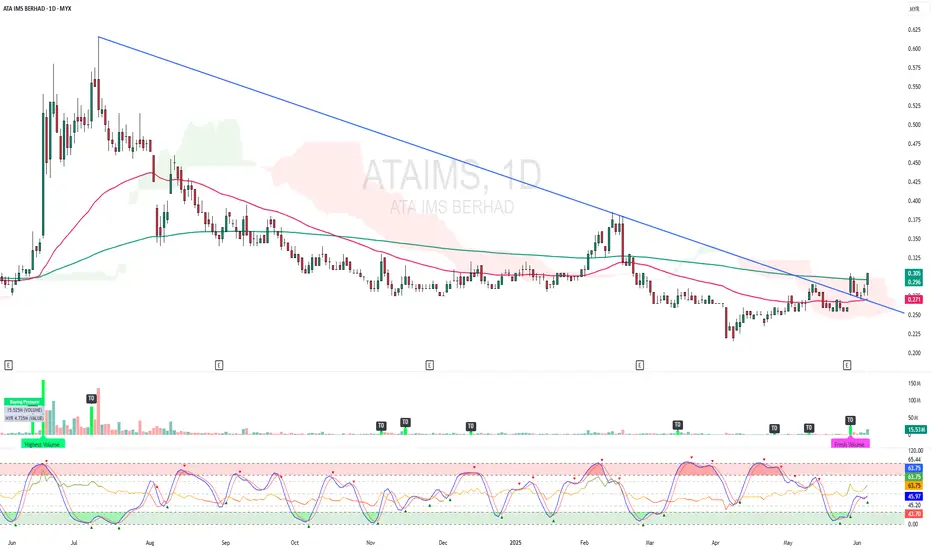
ATAIMS - BREAKOUT EMA 200 and CLOUD !ATAIMS - CURRENT PRICE : RM0.305
ATAIMS is bullish as the price is above EMA 50 and 200. The stock broke above EMA 200 and ICHIMOKU CLOUD on last FRIDAY (06 JUNE 2025) with high volume. Supported by technical reading in RSI heading upward, the stock may continue to move higher in the upcoming session.
ENTRY PRICE : RM0.300 - RM0.305
TARGET PRICE : RM0.340 and RM0.370
SUPPORT : RM0.270
MRDIY - Low RISK ?MRDIY - CURRENT PRICE : RM1.62
MRDIY is BULLISH because :
1. Price is above EMA 50
2. Price is above ICHIMOKU CLOUD
3. RSI is above 50
4. The high is getting higher and the low also getting higher
ENTRY PRICE : RM1.60 - RM1.62
TARGET PRICE : RM1.72 , RM1.80 , RM1.90
SUPPORT : RM1.51 (The low of bullish HAMMER candle)

XAUUSD 4H AnalysisGold is in its own correction wave.
The important resistance levels for gold is 3272-3353.
Based on ichimoku , we expect it to touch the support levels 3002-2977

ACHR - KUMO BREAKOUTACHR broke nearest resistance. There is a bullish divergence in MACD. Based on ICHIMOKU CHART, the stock is BULLISH because :
i) Price breakout cloud
ii) Tenkan sen already cross above Kijun sen recently
iii) Chikou Span is above candlestick
ENTRY PRICE : 9.33 - 9.40
TARGET : 10.37 and 12.75
STOP LOSS : 8.16

BTC 4H analysisIn the previous analysis, the zone of 70 was determining level for us, whether it was a correction or a downward trend.
BTC continued it's upward movement from near that area.
Now Bitcoin is near it's historical resistance area, this time the zone of 110 to 114 plays this role for us.
According to ICHIMOKU and according to previous analysis, Bitcoin tends to move to higher levels marked on the chart.

XAUUSDThe long-term trend of gold is completely bullish according to previous analyses, which still shows a strong bullish trend on monthly time frames.
We expect a correction in the chart during next week , but The long term trend of Gold is still bullish and we couldn't see any ICHIMOKU based divergence.
important support and resistance levels on the chart is highlighted.
