“ICICI Bank: Where Smart Money Steps InICICI Bank has been trading inside a long-term uptrend channel for the past 3 years. Within this structure, two clear zones are visible:
Higher Value Area (Supply Zone): Sellers dominate → price faces rejection here.
Lower Value Area (Demand Zone): Buyers dominate → price consistently bounces from here.
👉 Every time price approaches the Lower Value Area around 15 times :
(1) Buyers step in aggressively,
(2) Price reverses strongly,
(3) Risk–Reward becomes highly favorable.
(4) This makes the current setup a good accumulation point.
Now once again, price is testing the Strong Demand Zone (₹1340–1320).
Risk–Reward Setup
Buy Zone: ₹1340–1320
Immediate Resistance: ₹1390–1400
Upside Target: ₹1500–1550 (upper channel boundary)
Risk: Breakdown below ₹1320 may lead to ₹1200.
Fundamental Strength
✔️ Healthy Balance Sheet: Strong capital adequacy, well-managed NPAs.
✔️ Consistent Profit Growth: Strong momentum in NII & PAT over the years.
✔️ Retail & Digital Leadership: Leading share in retail loans + strong digital adoption.
✔️ Sector Tailwind: Indian banking credit growth projected at 14–16%, a positive for ICICI.
✔️ Valuation Comfort: Reasonable PE & PB compared to peers (HDFC Bank, Axis Bank).
Icici
Emerging Markets & BRICS Impact1. Introduction
The world economy today is not shaped only by the traditional powerhouses like the United States, Western Europe, or Japan. Instead, a large share of global growth is now being driven by emerging markets, countries that are rapidly industrializing, expanding their middle class, and gaining importance in trade and investment.
Among these, the BRICS group (Brazil, Russia, India, China, and South Africa) has become a major symbol of the rise of the Global South. Together, these countries account for over 40% of the world’s population and around 25% of global GDP (and growing). Their rise has significant implications for trade, geopolitics, technology, finance, and global governance.
This essay explores what emerging markets are, why they matter, how BRICS is shaping the global landscape, and what the future may hold.
2. What Are Emerging Markets?
An emerging market is an economy that is transitioning from being low-income, less developed, and heavily reliant on agriculture or resource exports, toward being more industrialized, technologically advanced, and integrated with the global economy.
Key Characteristics
Rapid economic growth (higher than developed nations)
Industrialization & urbanization
Expanding middle class and consumption base
Integration with global financial markets
Structural reforms and policy changes
Examples
Asia: India, China, Indonesia, Vietnam, Philippines
Latin America: Brazil, Mexico, Chile, Colombia
Africa: South Africa, Nigeria, Egypt, Kenya
Eastern Europe: Poland, Turkey
These nations are often seen as the growth engines of the 21st century. Investors view them as high-risk, high-reward markets, because while they promise rapid returns, they also face risks like political instability, weak institutions, or volatility.
3. Drivers of Growth in Emerging Markets
Why are emerging markets so important? Because they offer new sources of demand, labor, and innovation.
Demographics: Young populations compared to aging Western societies. India, for instance, has a median age of just 28.
Urbanization: Millions moving from rural to urban centers, fueling demand for housing, infrastructure, and consumer goods.
Technology adoption: Leapfrogging old models—Africa went straight to mobile banking (like M-Pesa), skipping traditional banking.
Globalization: Integration into global supply chains, manufacturing hubs, and service outsourcing (e.g., India in IT, Vietnam in electronics).
Natural resources: Rich deposits of oil, gas, minerals, and agricultural products.
Domestic reforms: Liberalization of trade, privatization, financial reforms, attracting foreign direct investment (FDI).
4. Challenges Facing Emerging Markets
Despite opportunities, emerging markets face significant hurdles:
Political risks: Corruption, unstable governments, populism.
Debt burdens: Many borrow in foreign currency, making them vulnerable to US dollar strength.
Geopolitical tensions: Sanctions, wars, trade wars, supply chain disruptions.
Infrastructure gaps: Lack of roads, power, digital connectivity.
Climate risks: Extreme weather impacts agriculture and coastal cities.
Thus, emerging markets are not a straight growth story—they are volatile yet transformative.
5. BRICS: The Symbol of Emerging Market Power
The term BRIC was first coined in 2001 by economist Jim O’Neill of Goldman Sachs to highlight the economic potential of Brazil, Russia, India, and China. In 2010, South Africa joined, making it BRICS.
Key Features
Represent ~40% of global population
Combined GDP: Over $28 trillion (2024 est.)
Hold significant natural resources (oil, gas, minerals, agriculture)
Increasing role in global politics
The group is not a formal union like the EU but a coalition of cooperation on economic, trade, and geopolitical issues.
6. Economic Contributions of BRICS
China: The manufacturing hub of the world, second-largest economy, key player in AI, green energy, and Belt & Road Initiative.
India: IT powerhouse, pharmaceutical leader, fastest-growing large economy, huge young labor force.
Brazil: Agricultural superpower (soybeans, coffee, beef), energy producer, growing fintech sector.
Russia: Major exporter of oil, natural gas, defense technology, though under Western sanctions.
South Africa: Gateway to Africa, strong in mining (gold, platinum), growing financial services sector.
Together, these economies contribute to global demand, innovation, and diversification of trade flows.
7. BRICS & Global Trade
One of the main goals of BRICS is to reduce dependency on Western markets and currencies. Key initiatives include:
Trade in local currencies instead of relying on the US dollar.
New Development Bank (NDB), founded in 2014, to finance infrastructure and sustainable projects in developing nations.
Expansion of intra-BRICS trade—for example, India-China trade in goods and services, Brazil-China agricultural exports, Russia-India defense trade.
The BRICS grouping is also seen as a counterweight to Western institutions like the IMF and World Bank.
8. Geopolitical Impact of BRICS
BRICS is more than economics—it is geopolitics.
Multipolar world order: Challenging US/EU dominance in global decision-making.
Alternative institutions: NDB as an alternative to IMF/World Bank, BRICS Summits as rival platforms to G7.
South-South cooperation: Giving developing nations more bargaining power in WTO, UN, and climate talks.
Strategic partnerships: India-Russia defense, China-Brazil trade, South Africa-China infrastructure.
BRICS has even discussed creating a common currency to reduce dollar dominance, though this remains a long-term idea.
9. Sectoral Impact of BRICS
Energy: Russia and Brazil are oil & gas exporters, China and India are importers—this creates synergy.
Agriculture: Brazil & Russia supply food to China & India.
Technology: China leads in 5G, AI, semiconductors; India excels in software & digital services.
Finance: BRICS is building payment systems outside of SWIFT to bypass Western sanctions.
Climate & Green Energy: Joint investments in solar, wind, and electric vehicles.
10. Criticism & Limitations of BRICS
BRICS is not without challenges:
Internal differences: India vs. China border disputes, Russia vs. West sanctions, Brazil’s political volatility.
Economic imbalance: China dominates the group—its GDP is bigger than all others combined.
Lack of cohesion: Different political systems (democracies, authoritarian states) and conflicting foreign policies.
Slow institutional development: NDB is still small compared to IMF/World Bank.
Despite these, BRICS has survived and expanded its influence.
Conclusion
Emerging markets are no longer just “developing nations.” They are active shapers of the global order, with BRICS as their most visible symbol. The rise of these economies is rebalancing global power from West to East and North to South.
While challenges remain—geopolitical rivalries, financial instability, governance issues—the long-term trajectory is clear: emerging markets and BRICS will be central to the 21st-century economy.
They represent not only new opportunities for investors, businesses, and policymakers but also a more multipolar, inclusive, and diverse global system.

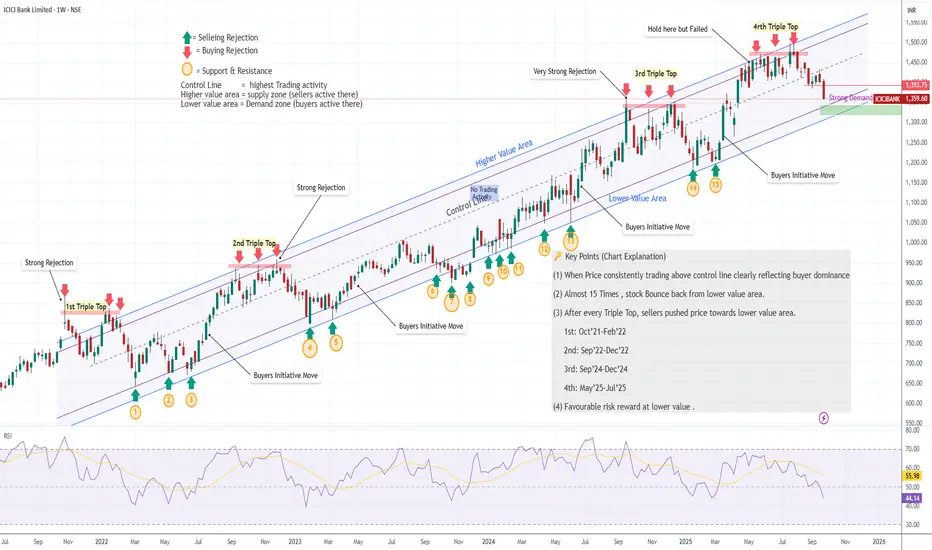
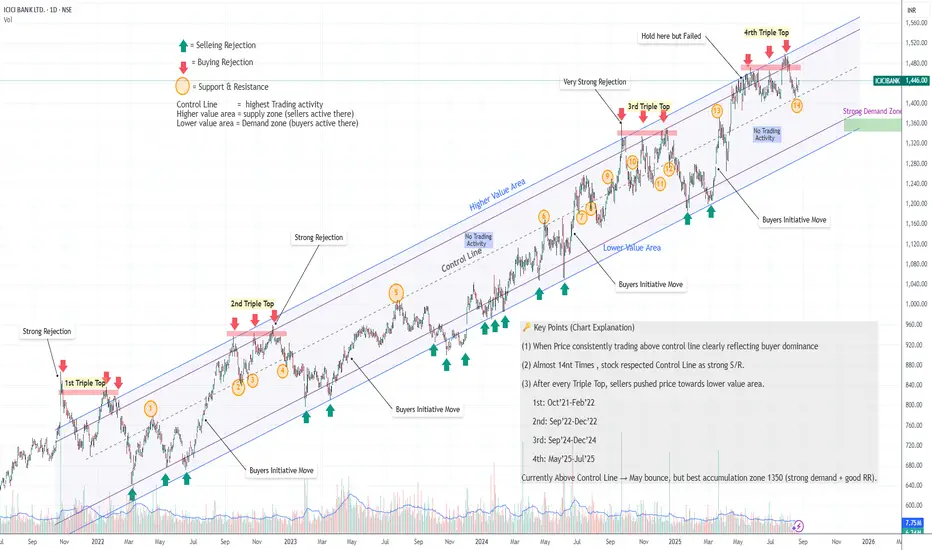
“ICICI Bank – Triple Tops Rejected, Demand Zone in Focus”🔑 ICICI Bank – Key Technical Points
📌Multiple Times → Control Line acted as S/R (around 14nth Times)
price respected the Control Line – price took support & resistance near Control Line → confirms its importance.
📌 Repeated Triple Tops → Seller Pressure
Every time the stock formed a Triple Top, sellers pushed it down towards the lower value area.
🔺 1st: Oct’21 – Feb’22
🔺 2nd: Sep’22 – Dec’22
🔺 3rd: Sep’24 – Dec’24
🔺 4th: May’25 – Jul’25
📌 Current Situation
Price is trading near the Control Line → short-term bounce is possible here but Don't forget Triple top recently forming here.
📌 Demand Zone (Near 1350 or Lower Vale area)
The strongest buying opportunity lies in this zone at 1350 – historically a key demand area offers the best risk–reward setup.
No indicator, no oscillator, No Moving Average, No Fundamental factor included: - Theory is just based on Price action breakdown.
ICICI BANK LTD (IBN) WEAKNESS COULD DRAG PRICE TO ITS MEAN!The price of IBN is now showing weakness, all that is left is a pullback above 29 followed by rejection...
N.B!
- IBN price might not follow the drawn lines . Actual price movements may likely differ from the forecast.
- Let emotions and sentiments work for you
- ALWAYS Use Proper Risk Management In Your Trades
#IBN
#NASDAQ
#SP500
#NYSE

ICICI Lombard GIC Ltd. - Technical AnalysisPrice Action:
The stock recently took support near the 0.5 Fibonacci retracement level around ₹1,892, bouncing back with strong momentum. This aligns with a visible bullish RSI divergence as the price formed lower lows while the RSI made higher lows, signaling a potential reversal.
Key Levels (from Fibonacci):
Resistance 1: ₹1,987 (61.8% Fibonacci level)
Resistance 2: ₹2,127 (78.6% Fibonacci level)
Final Target: ₹2,299 (Fibonacci extension, previous high)
Support 1: ₹1,892 (0.5 Fibonacci level, current support)
Support 2: ₹1,796 (38.2% Fibonacci level)
Support 3: ₹1,677 (23.6% Fibonacci level)
Entry, Stop Loss, and Targets:
Entry: Around ₹1,940-₹1,950 (post breakout confirmation above ₹1,950).
Stop Loss: ₹1,875 (below the 0.5 Fibonacci level and near recent support).
Targets:
Target 1: ₹1,987 (61.8% Fibonacci level)
Target 2: ₹2,127 (78.6% Fibonacci level)
Target 3: ₹2,299 (previous swing high)
Volume and RSI Observations:
The volume profile shows increased participation near ₹1,900 levels, confirming accumulation.
RSI is recovering from oversold levels and shows divergence, supporting a potential bullish continuation.
Conclusion:
If the stock holds above ₹1,892, the bullish trend might continue toward ₹1,987 and higher targets. Maintain discipline with the stop-loss to manage risk effectively.

ICICI Bank Long Setup - Swing TradeICICI Bank has bullish engulfing setup and already 15m candle has sustained above the price - 1241.47 for more than 10 seconds.
Disclaimer: This is for educational purpose only and not any financial advice

TIME TO BUY ICICI BANK ?ICICI BANK has recently surpassed the 1250 resistance level, which also marked an all-time high for the stock. It is currently trading above this level. You can consider entering now or wait for a pullback to 1250-1255 for a potentially better entry point.

ISEC - ICICI Securities - Uptrend - Long1. Head and Shoulder Pattern
2. BoS
3. ADX - started to show the trend strength

SWING IDEA - ICICI LOMBARD GENIn this analysis, we will explore key technical indicators and chart patterns that suggest ICICI Lombard GEN may be poised for a favorable uptrend. We'll delve into the factors contributing to the positive sentiment surrounding the stock.
Reasons are listed below :
The 1410 levels underwent multiple tests before the price eventually broke through. Currently, the price is in the process of retesting those levels.
Hammer candle (positive sign) on a very crucial support zone.
50EMA support on daily timeframe.
0.382 Fibonacci support.
Stock price is above 50 and 200EMA i.e the trend is intact.
Target - 1490 // 1611
StopLoss - Daily close below 1370

ICICI Bank 4H Timeframe Projection ICICI Bank 4H Timeframe Projection
Allover trend is Bullish
Expanding Flag Formed here.


Icici Ending DiagonalIcici may have completed a log ending diagonal & can fall to lower line of ending diagonal for targets of 940 & 900..
Stop loss can be kept at 1050 levels.

ICICIBANKICICIBANK has formed an ending diagonal suggesting a reversal in price. We are likely to see a deep correction from these levels.

ICICI Bank is Retracing and can be Shorted 26/02/2021this tikker seems to me overvalued and retracing from its ATH, as we can see there are many reasons to believe this stock is falling and will correct some of its rally and make the infrastructure for its upcoming rally.
we can see there is a Mild Bearish Divergence on MACD and Regular Bearish Divergence on MACD Histogram, which are the sign of trend reversal and retracement.
MACD and Signal lines are over crossing from top which is again an other sign of overbought and shall distribute some volume which will cause the trend reversal and surplus of supply and price correction and fall.
as we can see the price was ranging in an ascending Paralel Channel and it has already tried to break above the top boundary but could not hold the bull run and fall drastically with Big Red Bearish Candles, which is again another confirmation for the Bearish Divergence and trend correction or retracement.
there are total of 3 TP for the retracement which are having confluences with Fibonacci retracement golden Zones 38.2%,48.6% 61.8% Levels, amd past Support areas.
obviously after this retracement we should look in to the market sentiment in order to decide about the longing or rebuying it but yet there are good chances that there would come some packages from the RBI to infuse some blood to the banks wanes and pump them back up and make the new ATH where it can be 127% and 161.8% of the same fibonacci expansions.
the other scenario after the retracement can be a renge and the fall more as we can see the Cryptocurrencies are growing heavily and of course their growth is very dangerous for the centralized banking system and soon these systems are going to loos the battle to the crypos if they don't adapt a survival mechanism on time for saving some time and loses and it can be an end if the prices fall below the red accumulation zone...
please comment you opinions about this analysis

ICICI 15 min Chart prediction- trading in critical support ICICI is trading into the support (already hit 4 time on support if its is broked the downside the will go to 2% down ...so trade safely into ICICI Chart (avoid the Option Trade)

ICICIBANK Buy Idea 11 May 2023 NSE:ICICIBANK is trading in a range. As per my analysis, if any 15 min candle closed and sustained above level of 942.00, it could be best opportunity to buy with stop loss of 925.
My expected upside target will be 973.00
Note: This is my personal analysis, only to learn stock market behavior. Thanks.

Long opportunity in ICICI BANKPositional Long Opportunity in ICICIBANK.
1. Positive RSI
2. MFI Breakout
3. 200 EMA Support Level
4. Will retest psychological level of 900 before exiting the 800 range on the downside
5. Price trying to make a HUGE HEAD AND SHOULDER pattern. Currently developing the right shoulder.

ICICI Bank 4H analysisICICI Bank analysis in 4H timeframe. ICICI Bank was in nice uptrend and following the trend line. But now it looks bearish after deviation from high of 942.90 . And now market structure is also shifted to downside After breaking the trend line and orange zone. Now I would like to short it only if it it comes back for a retest of Orange zone. Just wait for some rejection from the zone and then get into the trade. Stop loss at 936 and take profits are marked in green and full take profit at 837.
Not a financial advisor. This idea is just for educational purposes only. Do your own research. #DYOR. Hit the like if you like the idea.

downside possible This banking scrip is looking week after result and there is a high possibility that it may go further down.


Intraday Setup #ICICI Bank The scrip has formed an pole and flag type pattern in 15 Min TF. Keep this in radar. on breakout we may see a good upside move.

Consolidating in a tight rangeThis major banking stock is consolidating in a tight range and there is a high possibility of moving up. keep this in radar.

icici bank demand zonesthese are some zones on basis of demand n supply analysis which may give bounce back for small swing trade altough these levels are tested once so would be broken so risk reward is important. its my study only dont trade on this basis share yours
