ICICI Bank | Gann Square of 9 Intraday Case Study | 06 Apr 2023This chart presents a classical WD Gann Square of 9 intraday setup, where price completed its normal capacity early in time, leading to a high-probability reversal.
On 06 April 2023, ICICI Bank started gaining upside momentum from the third 15-minute candle.
The intraday low at ₹875 was selected as the 0-degree (0°) reference point, following standard Gann methodology.
Using the Gann Square of 9, the stock’s normal intraday upside level was projected at:
45° → ₹890
Price reached the 45-degree level around 11:15 AM, which is significantly earlier than the ideal Gann time window near 2:30 PM.
As per Gann’s time–price relationship, early completion of a degree level often indicates temporary exhaustion.
The stock reacted precisely from this zone and reversed lower, offering clear intraday downside movement.
This case highlights how price geometry combined with time analysis helps traders identify logical reaction zones, rather than depending on indicators or assumptions.
📌 Key Gann Levels
0° → 875
45° → 890
🔍 Learning Points
Square of 9 defines price capacity
Time determines when that capacity becomes effective
Early completion = higher probability of reaction
Structure > indicators
Disclaimer:
This idea is shared for educational and analytical purposes only. It is not a trading or investment recommendation.
ICICIBANK

ICICIBANK "W" Pattern Reversal at Multi-Week Support | Bullish SICICIBANK "W" Pattern Reversal at Multi-Week Support | Bullish Reversal Setup
━━━━━━━━━━━━━━━━━━━━━━━━━━━━━━━━━━━━━━━━━━━
📊 TECHNICAL SETUP
Current Price: 1,343.90 (+0.44%)
Timeframe: Weekly (1W)
Symbol: ICICIBANK (ICICI Bank Limited)
Exchange: NSE
Category: Stock / Banking Sector
━━━━━━━━━━━━━━━━━━━━━━━━━━━━━━━━━━━━━━━━━━━
🎯 PATTERN ANALYSIS - "W" DOUBLE BOTTOM REVERSAL (Formation in Progress)
ICICIBANK is currently forming a CLASSIC "W" (DOUBLE BOTTOM) REVERSAL PATTERN at critical multi-week support levels:
✅ First Bottom: Established several weeks ago, creating strong support foundation
✅ Retest of Support: Price has retested this level, confirming support strength and institutional buying
✅ "W" Formation: The dual-bottom structure indicates accumulation and exhaustion of selling pressure
✅ Volume Profile: Volume analysis shows healthy institutional participation at support levels
✅ Support Confirmation: Multi-week support zone acting as strong anchor and reversal point
The "W" pattern is one of the most reliable reversal patterns in technical analysis. When price tests support twice and holds, it indicates exhaustion of selling and high probability reversal.
━━━━━━━━━━━━━━━━━━━━━━━━━━━━━━━━━━━━━━━━━━━
📈 REVERSAL TARGETS & OBJECTIVES
Based on the "W" pattern formation, the upside targets would be:
Immediate Resistance (Midpoint of W): 1,365-1,380 (First reversal confirmation zone) - CRITICAL
1st Target: 1,400-1,410 (Previous consolidation break)
2nd Target: 1,440-1,450 (Key resistance zone)
3rd Target: 1,480-1,500 (Swing high resistance)
Extended Target: 1,520-1,540 (Major resistance level)
Each level provides strategic exit points for partial position management.
━━━━━━━━━━━━━━━━━━━━━━━━━━━━━━━━━━━━━━━━━━━
🛡️ RISK MANAGEMENT FRAMEWORK
Entry Strategy:
- Conservative Entry: Wait for confirmation above midpoint of W (above 1,365)
- Aggressive Entry: Small positions now at support, adding on breakouts
- Scale-In Approach: Build positions in stages rather than all-in
Stoploss Placement:
- Aggressive Stoploss: 1,330 (Just below support level)
- Conservative Stoploss: 1,320 (Below multi-week support with margin)
- Key Level: 1,330-1,344 (The support level) - if breaks, pattern fails
Risk/Reward Ratio:
- From current (1,343.90) to 1st target (1,400): 56 points upside
- Risk to support break: 24 points
- Ratio: 1:2.3 (Very Favorable)
Position Sizing: Risk only 1-2% of capital per trade
━━━━━━━━━━━━━━━━━━━━━━━━━━━━━━━━━━━━━━━━━━━
📍 KEY SUPPORT & RESISTANCE LEVELS
Major Support: 1,330-1,344.00 (Multi-week support - the W bottom)
Secondary Support: 1,320.00 (Weekly support zone)
First Resistance: 1,365-1,380 (Midpoint of W - CRITICAL for confirmation)
Medium Resistance: 1,400-1,410 (Previous consolidation level)
Major Resistance: 1,440-1,450 (Key swing resistance)
The 1,365-1,380 level is CRITICAL - once price breaks above with conviction, it confirms the W reversal and triggers buying.
━━━━━━━━━━━━━━━━━━━━━━━━━━━━━━━━━━━━━━━━━━━
🔍 WHY THIS W PATTERN IS SIGNIFICANT
1. Double Bottom Strength: Two tests without breaking below = institutional defense
2. Support/Resistance Flip: Once above midpoint, previous lows become strong support
3. Favorable Risk/Reward: Clear risk with large reward potential
4. Psychological Importance: Banking investors use these levels, creating strong buying
5. Trend Reversal Catalyst: W patterns historically precede significant uptrends
━━━━━━━━━━━━━━━━━━━━━━━━━━━━━━━━━━━━━━━━━━━
🎉 TECHNICAL OBSERVATIONS
• W pattern nearly complete with only upside breakout needed
• Support at 1,330 to 1,344 region has held through multiple tests
• Volume shows institutional buying interest at support
• No breakdown below support despite recent weakness
• RSI and momentum show oversold levels, suggesting reversal potential
• Daily chart shows positive divergence (lower price but higher indicators)
• Weekly structure intact with W formation
• Sector rotation into banks favors this reversal setup
━━━━━━━━━━━━━━━━━━━━━━━━━━━━━━━━━━━━━━━━━━━
💡 INVESTMENT THESIS (BULLISH)
ICICI Bank presents a HIGH-PROBABILITY REVERSAL setup at multi-week support with a classic W pattern. The combination of:
1. Technical Pattern Strength (Double bottom W)
2. Support Confirmation (Multiple tests, no break)
3. Favorable Risk/Reward (1:2.3+)
4. Sector Tailwinds (Banking strength)
5. Institutional Accumulation (Volume evidence)
6. Fundamental Stability (Banking fundamentals solid)
The next 50-100 points of upside appears well-supported. The KEY TRIGGER will be a close above 1,365, confirming the W reversal and attracting fresh buying.
━━━━━━━━━━━━━━━━━━━━━━━━━━━━━━━━━━━━━━━━━━━
⚠️ CRITICAL DISCLAIMER
🔴 THIS IS TECHNICAL ANALYSIS FOR EDUCATIONAL PURPOSES ONLY
🔴 THIS IS NOT FINANCIAL ADVICE OR AN INVESTMENT RECOMMENDATION
This analysis: Is based on historical price patterns, Does NOT constitute investment advice, Is my personal observation, Should NOT be sole basis for investment decision
━━━━━━━━━━━━━━━━━━━━━━━━━━━━━━━━━━━━━━━━━━━
⚠️ IMPORTANT RISKS
✓ Past performance does NOT guarantee future results
✓ Technical patterns can FAIL and trends can reverse
✓ Market conditions can change rapidly
✓ Stock investments carry significant risk of loss
✓ You may lose your ENTIRE investment amount
✓ Consult a qualified financial advisor before trading
✓ Do your own independent research (DYOR)
✓ Use strict position sizing and risk management
✓ RBI policy changes can impact banking stocks
✓ Interest rate fluctuations affect bank stocks
✓ Economic indicators and earnings can invalidate patterns
━━━━━━━━━━━━━━━━━━━━━━━━━━━━━━━━━━━━━━━━━━━
🔴 FINAL RISK ACKNOWLEDGMENT
TRADING AND INVESTING IN STOCKS INVOLVES SUBSTANTIAL RISK OF LOSS.
I am NOT a financial advisor. This analysis is for educational purposes only.
BEFORE MAKING ANY INVESTMENT DECISION:
✓ Conduct your own thorough research
✓ Check RBI policies and interest rate environment
✓ Verify your risk appetite and capital availability
✓ Consult with a qualified financial advisor
✓ Only invest capital you can afford to lose
✓ Never follow this as a guaranteed strategy
Your investment decisions are YOUR responsibility. Use proper risk management, stop losses, and position sizing.
━━━━━━━━━━━━━━━━━━━━━━━━━━━━━━━━━━━━━━━━━━━
Trade responsibly. Risk management is paramount.

ICICI Bank Ltd for 17th Oct #ICICIBANK ICICI Bank Ltd for 17th Oct #ICICIBANK
Resistance 1420 Watching above 1422 for upside momentum.
Support area 1400 Below 1400 gnoring upside momentum for intraday
Watching below 1398 for downside movement...
Above 1420 ignoring downside move for intraday
Charts for Educational purposes only.
Please follow strict stop loss and risk reward if you follow the level.
Thanks,
V Trade Point

“ICICI Bank: Where Smart Money Steps InICICI Bank has been trading inside a long-term uptrend channel for the past 3 years. Within this structure, two clear zones are visible:
Higher Value Area (Supply Zone): Sellers dominate → price faces rejection here.
Lower Value Area (Demand Zone): Buyers dominate → price consistently bounces from here.
👉 Every time price approaches the Lower Value Area around 15 times :
(1) Buyers step in aggressively,
(2) Price reverses strongly,
(3) Risk–Reward becomes highly favorable.
(4) This makes the current setup a good accumulation point.
Now once again, price is testing the Strong Demand Zone (₹1340–1320).
Risk–Reward Setup
Buy Zone: ₹1340–1320
Immediate Resistance: ₹1390–1400
Upside Target: ₹1500–1550 (upper channel boundary)
Risk: Breakdown below ₹1320 may lead to ₹1200.
Fundamental Strength
✔️ Healthy Balance Sheet: Strong capital adequacy, well-managed NPAs.
✔️ Consistent Profit Growth: Strong momentum in NII & PAT over the years.
✔️ Retail & Digital Leadership: Leading share in retail loans + strong digital adoption.
✔️ Sector Tailwind: Indian banking credit growth projected at 14–16%, a positive for ICICI.
✔️ Valuation Comfort: Reasonable PE & PB compared to peers (HDFC Bank, Axis Bank).
ICICIBANK: Support Zone & Hidden Setup UnfoldingICICI Bank – Technical Outlook
On the daily and 1-hour charts, ICICI Bank is showing strength near a key support zone of 1370–1390.
On the 1-hour timeframe, the stock is forming a diamond pattern around the 1380–1400 range.
A sustained move above this support zone may trigger upside momentum and lead to higher price levels in the coming sessions.
Conclusion: ICICI Bank is currently at a crucial support area with a developing bullish structure. Traders and investors should monitor these levels closely for potential opportunities.

Emerging Markets & BRICS Impact1. Introduction
The world economy today is not shaped only by the traditional powerhouses like the United States, Western Europe, or Japan. Instead, a large share of global growth is now being driven by emerging markets, countries that are rapidly industrializing, expanding their middle class, and gaining importance in trade and investment.
Among these, the BRICS group (Brazil, Russia, India, China, and South Africa) has become a major symbol of the rise of the Global South. Together, these countries account for over 40% of the world’s population and around 25% of global GDP (and growing). Their rise has significant implications for trade, geopolitics, technology, finance, and global governance.
This essay explores what emerging markets are, why they matter, how BRICS is shaping the global landscape, and what the future may hold.
2. What Are Emerging Markets?
An emerging market is an economy that is transitioning from being low-income, less developed, and heavily reliant on agriculture or resource exports, toward being more industrialized, technologically advanced, and integrated with the global economy.
Key Characteristics
Rapid economic growth (higher than developed nations)
Industrialization & urbanization
Expanding middle class and consumption base
Integration with global financial markets
Structural reforms and policy changes
Examples
Asia: India, China, Indonesia, Vietnam, Philippines
Latin America: Brazil, Mexico, Chile, Colombia
Africa: South Africa, Nigeria, Egypt, Kenya
Eastern Europe: Poland, Turkey
These nations are often seen as the growth engines of the 21st century. Investors view them as high-risk, high-reward markets, because while they promise rapid returns, they also face risks like political instability, weak institutions, or volatility.
3. Drivers of Growth in Emerging Markets
Why are emerging markets so important? Because they offer new sources of demand, labor, and innovation.
Demographics: Young populations compared to aging Western societies. India, for instance, has a median age of just 28.
Urbanization: Millions moving from rural to urban centers, fueling demand for housing, infrastructure, and consumer goods.
Technology adoption: Leapfrogging old models—Africa went straight to mobile banking (like M-Pesa), skipping traditional banking.
Globalization: Integration into global supply chains, manufacturing hubs, and service outsourcing (e.g., India in IT, Vietnam in electronics).
Natural resources: Rich deposits of oil, gas, minerals, and agricultural products.
Domestic reforms: Liberalization of trade, privatization, financial reforms, attracting foreign direct investment (FDI).
4. Challenges Facing Emerging Markets
Despite opportunities, emerging markets face significant hurdles:
Political risks: Corruption, unstable governments, populism.
Debt burdens: Many borrow in foreign currency, making them vulnerable to US dollar strength.
Geopolitical tensions: Sanctions, wars, trade wars, supply chain disruptions.
Infrastructure gaps: Lack of roads, power, digital connectivity.
Climate risks: Extreme weather impacts agriculture and coastal cities.
Thus, emerging markets are not a straight growth story—they are volatile yet transformative.
5. BRICS: The Symbol of Emerging Market Power
The term BRIC was first coined in 2001 by economist Jim O’Neill of Goldman Sachs to highlight the economic potential of Brazil, Russia, India, and China. In 2010, South Africa joined, making it BRICS.
Key Features
Represent ~40% of global population
Combined GDP: Over $28 trillion (2024 est.)
Hold significant natural resources (oil, gas, minerals, agriculture)
Increasing role in global politics
The group is not a formal union like the EU but a coalition of cooperation on economic, trade, and geopolitical issues.
6. Economic Contributions of BRICS
China: The manufacturing hub of the world, second-largest economy, key player in AI, green energy, and Belt & Road Initiative.
India: IT powerhouse, pharmaceutical leader, fastest-growing large economy, huge young labor force.
Brazil: Agricultural superpower (soybeans, coffee, beef), energy producer, growing fintech sector.
Russia: Major exporter of oil, natural gas, defense technology, though under Western sanctions.
South Africa: Gateway to Africa, strong in mining (gold, platinum), growing financial services sector.
Together, these economies contribute to global demand, innovation, and diversification of trade flows.
7. BRICS & Global Trade
One of the main goals of BRICS is to reduce dependency on Western markets and currencies. Key initiatives include:
Trade in local currencies instead of relying on the US dollar.
New Development Bank (NDB), founded in 2014, to finance infrastructure and sustainable projects in developing nations.
Expansion of intra-BRICS trade—for example, India-China trade in goods and services, Brazil-China agricultural exports, Russia-India defense trade.
The BRICS grouping is also seen as a counterweight to Western institutions like the IMF and World Bank.
8. Geopolitical Impact of BRICS
BRICS is more than economics—it is geopolitics.
Multipolar world order: Challenging US/EU dominance in global decision-making.
Alternative institutions: NDB as an alternative to IMF/World Bank, BRICS Summits as rival platforms to G7.
South-South cooperation: Giving developing nations more bargaining power in WTO, UN, and climate talks.
Strategic partnerships: India-Russia defense, China-Brazil trade, South Africa-China infrastructure.
BRICS has even discussed creating a common currency to reduce dollar dominance, though this remains a long-term idea.
9. Sectoral Impact of BRICS
Energy: Russia and Brazil are oil & gas exporters, China and India are importers—this creates synergy.
Agriculture: Brazil & Russia supply food to China & India.
Technology: China leads in 5G, AI, semiconductors; India excels in software & digital services.
Finance: BRICS is building payment systems outside of SWIFT to bypass Western sanctions.
Climate & Green Energy: Joint investments in solar, wind, and electric vehicles.
10. Criticism & Limitations of BRICS
BRICS is not without challenges:
Internal differences: India vs. China border disputes, Russia vs. West sanctions, Brazil’s political volatility.
Economic imbalance: China dominates the group—its GDP is bigger than all others combined.
Lack of cohesion: Different political systems (democracies, authoritarian states) and conflicting foreign policies.
Slow institutional development: NDB is still small compared to IMF/World Bank.
Despite these, BRICS has survived and expanded its influence.
Conclusion
Emerging markets are no longer just “developing nations.” They are active shapers of the global order, with BRICS as their most visible symbol. The rise of these economies is rebalancing global power from West to East and North to South.
While challenges remain—geopolitical rivalries, financial instability, governance issues—the long-term trajectory is clear: emerging markets and BRICS will be central to the 21st-century economy.
They represent not only new opportunities for investors, businesses, and policymakers but also a more multipolar, inclusive, and diverse global system.

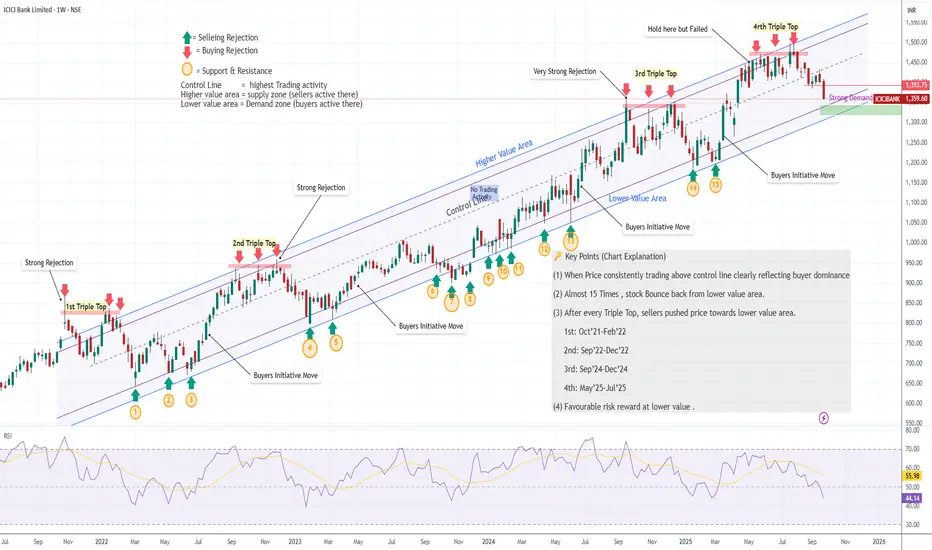
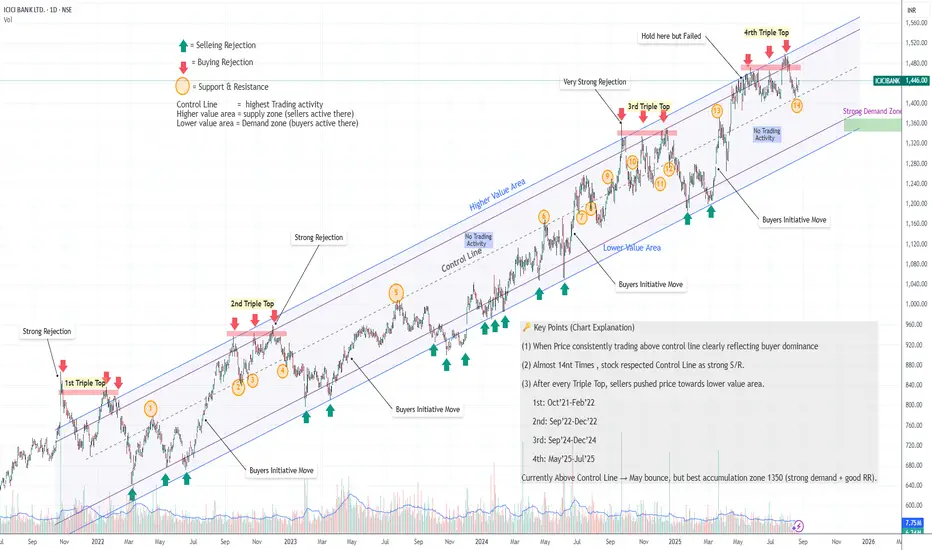
“ICICI Bank – Triple Tops Rejected, Demand Zone in Focus”🔑 ICICI Bank – Key Technical Points
📌Multiple Times → Control Line acted as S/R (around 14nth Times)
price respected the Control Line – price took support & resistance near Control Line → confirms its importance.
📌 Repeated Triple Tops → Seller Pressure
Every time the stock formed a Triple Top, sellers pushed it down towards the lower value area.
🔺 1st: Oct’21 – Feb’22
🔺 2nd: Sep’22 – Dec’22
🔺 3rd: Sep’24 – Dec’24
🔺 4th: May’25 – Jul’25
📌 Current Situation
Price is trading near the Control Line → short-term bounce is possible here but Don't forget Triple top recently forming here.
📌 Demand Zone (Near 1350 or Lower Vale area)
The strongest buying opportunity lies in this zone at 1350 – historically a key demand area offers the best risk–reward setup.
No indicator, no oscillator, No Moving Average, No Fundamental factor included: - Theory is just based on Price action breakdown.
ICICI Bank on the move! A strong buy opportunity spotted.There are two charts of ICICI Bank—one on the 1-hour timeframe and the other on the 4-hour timeframe.
On the 4-hour chart, ICICI Bank is trading within a well-defined parallel channel, with strong support in the 1400–1410 zone.
“On the 1-hour chart, ICICI Bank is forming a Symmetrical Triangle pattern with support near 1424. The weekly pivot level at 1423 may also act as strong support, while the monthly pivot at 1450 is acting as resistance. The pattern breakout indicates a potential target of 1465.
If this support level holds, the stock may witness higher price levels.
Thank You !!

Review and plan for 22nd April 2025 Nifty future and banknifty future analysis and intraday plan in kannada.
This video is for information/education purpose only. you are 100% responsible for any actions you take by reading/viewing this post.
please consult your financial advisor before taking any action.
----Vinaykumar hiremath, CMT

Review and plan for 21st April 2025Nifty future and banknifty future analysis and intraday plan in kannada.
Quarterly results.
This video is for information/education purpose only. you are 100% responsible for any actions you take by reading/viewing this post.
please consult your financial advisor before taking any action.
----Vinaykumar hiremath, CMT

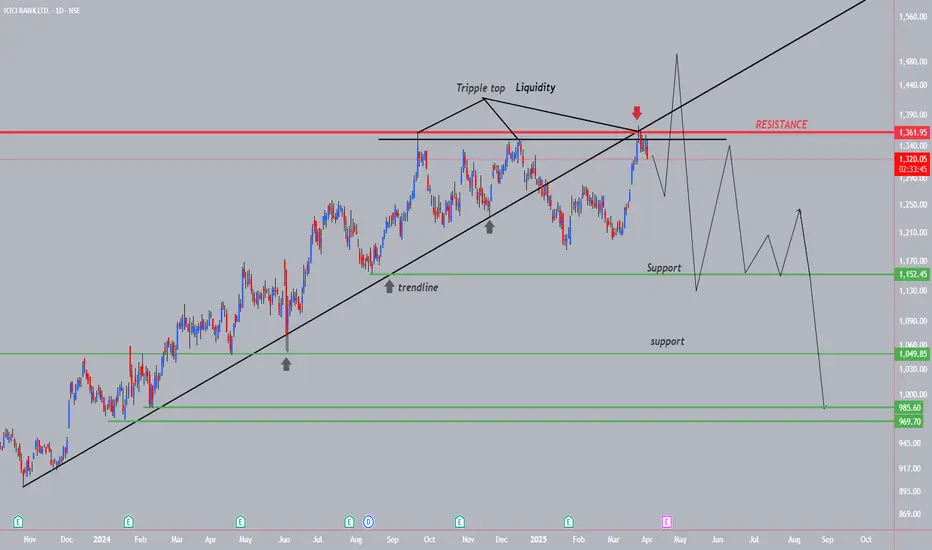
ICICIBANK--Tripple Top Liquidity+Down??This banking sector stock has broken the trendline strongly...
recently price taken the double top liquidity, creating an another liquidity....
do not make any attempt of short from this levels, still we don't have a sign of bearishness....
wait for one more liquidity on topside with strong upside move as exhaustion
then will observe a strong fall, after the liquidity...
then will go for short side...
on the bottom side we have a lot of trendline liquidity lies at support levels.
we have to look for buy at these levels for an investing point of view.
ICICI BANK LTD (IBN) WEAKNESS COULD DRAG PRICE TO ITS MEAN!The price of IBN is now showing weakness, all that is left is a pullback above 29 followed by rejection...
N.B!
- IBN price might not follow the drawn lines . Actual price movements may likely differ from the forecast.
- Let emotions and sentiments work for you
- ALWAYS Use Proper Risk Management In Your Trades
#IBN
#NASDAQ
#SP500
#NYSE

ICICIBANK Option Buy Trade (January 2025)I plan to buy the ICICIBANK 1290 Put Option (January Contract)
CMP: 25.90 | Best buy below 15.00
STOPLOSS: 7.50
TARGET: 1260 January future level.
Validity: Till 27th January 2025 Trading session.
Disclaimer: This is not a trade recommendation, for educational purposes only.

ICICIBANK !! Broke Trianlge Pattern on Monthly ChartICICIBANK !! Broke Trianlge Pattern on Monthly Chart
Along with that recently it made Bullish Engluf candle with good volume support. can be considered for swing trading with SL of 1200.

ICICIBANK 1D TFNSE:ICICIBANK has formed and is moving inside a triangular pattern. This can be traded on breakout
Disclaimer:- This analysis is only for educational purpose. Please always do your own analysis or consult with your financial advisor before taking any kind of trades

ICICI bank on angle 6 going up with selling in the short termWe have RED UMVD and RED TrapZone. With Red bar starting to form again. lets see if we gain selling momentum or not. Will post the daily after this.

icicibank for swing/poisitional
buy near 1210
avg at 1185-80
sl at 1160 sl 4% strictly follow sl
use capital 25k to 50 k
overall risk 1k to 2k only
tgt 4% 8%12%16%20%
hold 3-6 week

ICICI Bank in BreakoutICICI Bank NSE:ICICIBANK in Breakout. ICICI Bank in uptrend as we could see higher highs and lows in all timeframe. Buy above 1190 and Target would be 1350

ICICI Bank Showing Bullish Breakout!#ICICIBANK CMP: ₹1,318
➡️ Bullish breakout observed from an ascending channel
➡️ Volume rise supporting the breakout
➡️ Next targets: ₹1,380 on the upside

ICICI Bank Long Setup - Swing TradeICICI Bank has bullish engulfing setup and already 15m candle has sustained above the price - 1241.47 for more than 10 seconds.
Disclaimer: This is for educational purpose only and not any financial advice

ICICIBank Intraday Levels: 18-Sep-24Stock made high upto 1272, then sideways momentum in last trading session. Upside Breakout drag price for up, Trendline Breakout for down side momentum. Wait for prope Price Action on levels for Entry.
Bullish> 1273
Bearish < 1263

TIME TO BUY ICICI BANK ?ICICI BANK has recently surpassed the 1250 resistance level, which also marked an all-time high for the stock. It is currently trading above this level. You can consider entering now or wait for a pullback to 1250-1255 for a potentially better entry point.

ICICI Bank LtdImportant points marked.
*****Education purpose only*****
*****Investing in Equity is subjected to market risk do own research before investing*****
