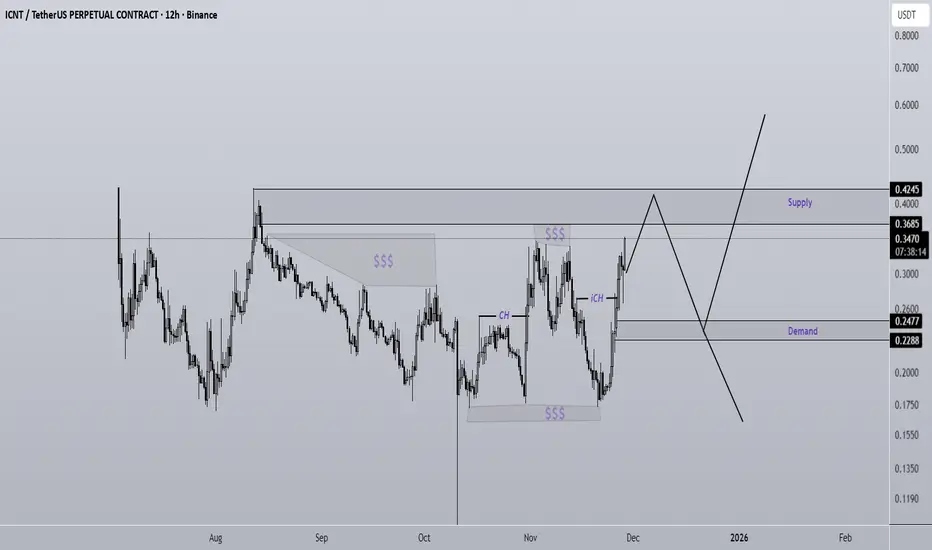
ICNT Analysis (12H)Considering the large liquidity pools that have been collected and the price reaching an origin of movement, the probability of a rejection from the supply zone is high.
Since there is liquidity at the bottom of the chart as well, if the price breaks the demand zone, it may move toward the lower liquidity pools. However, if the demand zone holds as support, we could potentially see a new ATH.
Let’s wait and see what happens
Do not enter the position without capital management and stop setting
Comment if you have any questions
thank you
ICNT
ICNT - Range Accumulation Before a Breakout MoveThe coin is currently in a clear accumulation range. Once the upper boundary is broken, the next target zone sits at $0.80–$1.00.
If the lower boundary breaks instead, the price may head toward $0.095–$0.08.
For now, it's important to wait for a breakout of either side of the range — this will likely determine the next strong directional move toward the respective targets.

ICNT Analysis (4H)It appears that a triangle is forming. We are currently completing wave D of this triangle — in fact, we are in the middle of wave D.
To complete wave D, the price may make deeper drops.
The best area for entering a sell/short position is the red zone. If the price reaches this zone, we can open a sell/short position.
The targets are marked on the chart.
A daily candle closing below the invalidation level will invalidate this analysis.
For risk management, please don't forget stop loss and capital management
When we reach the first target, save some profit and then change the stop to entry
Comment if you have any questions
Thank You
