SPK/USDT – Final Pressure Before a Major Breakout?The market is watching SPK/USDT closely as it approaches a make-or-break zone.
After months of steady decline under a well-defined downtrend line, price is now testing the critical demand zone at 0.034–0.030 — the same level that previously triggered a massive rally earlier this year.
The current structure hints at a potential shift in momentum, but failure to hold this area could invite a deeper sell-off.
---
Pattern & Technical Structure
SPK is shaping a descending wedge / descending triangle pattern — a classic formation that often precedes a trend reversal when sellers lose steam and buyers begin to accumulate around a key support area.
The 0.034–0.030 zone acts as a strong defensive wall.
If this zone holds and price breaks above the yellow downtrend line, it could signal the start of a medium-term bullish reversal.
However, a clean break below this level would confirm bearish continuation, likely driving price down toward the 0.0225 support zone.
---
🟢 Bullish Scenario
A daily candle close above the downtrend line confirms a momentum shift.
Breakout must be supported by increasing volume for validation.
Upside targets:
0.0465 → first key resistance
0.0565 → confirmation of a trend reversal
0.0885 → extended bullish target if sentiment strengthens
Watch for the formation of a higher low post-breakout — a reliable sign of a structural reversal.
---
🔴 Bearish Scenario
A daily close below 0.030 confirms bearish dominance.
Potential for accelerated drop toward 0.0225 (previous major low).
If breakdown occurs on high volume, it may signal the final phase of capitulation before a deeper accumulation phase.
---
💡 Market Outlook & Sentiment
SPK is standing at a major inflection point.
The 0.034–0.030 zone is not just a support range — it’s a battlefield between accumulation and continuation.
A breakout above the trendline would ignite a new chapter in SPK’s price structure, while a breakdown could extend its bearish cycle into year-end.
Smart traders will wait for daily candle + volume confirmation, not emotional reactions.
The next decisive move here could define the market direction for months ahead.
---
🎯 Key Technical Levels
Main Support: 0.034 – 0.030
Next Support: 0.0225
Immediate Resistance: 0.0465
Major Resistances: 0.0565 / 0.0885 / 0.1250
---
🧭 Market Perspective
Although SPK remains within a downtrend, the slowing bearish momentum near this demand zone might indicate early accumulation by smart money.
If a breakout occurs, expect a possible short squeeze rally toward 0.05–0.06 as short positions unwind above the descending trendline.
---
#SPK #SPKUSDT #CryptoAnalysis #Breakout #Downtrend #TechnicalAnalysis #PriceAction #AltcoinSetup #CryptoTrading #ReversalZone #SupportResistance
ICP

ICPUSDT Forming Falling WedgeICPUSDT is forming a classic falling wedge pattern, a bullish reversal signal that often indicates a potential trend change after a prolonged downtrend. The current market structure shows narrowing price action with strong support levels being defended by buyers. With a good volume backing recent moves, this setup suggests that ICP could be gearing up for a significant breakout to the upside. Technical traders are closely watching this zone for confirmation, as a breakout from the wedge could unlock an impressive 90% to 100% gain potential.
Investor sentiment toward ICP has been improving as the project continues to show resilience in market volatility. The falling wedge pattern aligns with a possible phase of accumulation where strong hands are positioning themselves before a new bullish cycle begins. The increasing trading activity around key price zones highlights growing confidence from both retail and institutional participants. Once the resistance line is breached, it may spark strong momentum toward higher levels.
The overall technical landscape for ICPUSDT points toward a bullish reversal supported by rising volume and steady investor interest. The pattern’s tightening structure shows reduced selling pressure and indicates that bulls are preparing for a potential breakout rally. Traders watching this pair should stay alert for confirmation candles or a volume surge, as these are often the first signs of an impending trend shift that could deliver the expected gains.
✅ Show your support by hitting the like button and
✅ Leaving a comment below! (What is You opinion about this Coin)
Your feedback and engagement keep me inspired to share more insightful market analysis with you!

ICP Short ideaoverall market is bearish nut BINANCE:ICPUSDT.P pumped 40% for no reason!
we have a major resistance in this area and we can sell from this point at least now

ICPUSDT Forming Falling WedgeICPUSDT is forming a classic falling wedge pattern, a bullish reversal signal that often indicates a potential trend change after a prolonged downtrend. The current market structure shows narrowing price action with strong support levels being defended by buyers. With a good volume backing recent moves, this setup suggests that ICP could be gearing up for a significant breakout to the upside. Technical traders are closely watching this zone for confirmation, as a breakout from the wedge could unlock an impressive 90% to 100% gain potential.
Investor sentiment toward ICP has been improving as the project continues to show resilience in market volatility. The falling wedge pattern aligns with a possible phase of accumulation where strong hands are positioning themselves before a new bullish cycle begins. The increasing trading activity around key price zones highlights growing confidence from both retail and institutional participants. Once the resistance line is breached, it may spark strong momentum toward higher levels.
The overall technical landscape for ICPUSDT points toward a bullish reversal supported by rising volume and steady investor interest. The pattern’s tightening structure shows reduced selling pressure and indicates that bulls are preparing for a potential breakout rally. Traders watching this pair should stay alert for confirmation candles or a volume surge, as these are often the first signs of an impending trend shift that could deliver the expected gains.
✅ Show your support by hitting the like button and
✅ Leaving a comment below! (What is You opinion about this Coin)
Your feedback and engagement keep me inspired to share more insightful market analysis with you!

Just In: Decred ($DCR) Spike Nearly 100% Today Amidst Market DipThe price of Decred ( PSX:DCR ) saw a noteworthy uptick of nearly 100% today albeit market bloodbirth. Tokens like $ZCASH, NASDAQ:DASH , and CRYPTOCAP:ICP followed the same pattern too.
As of the time of writing, PSX:DCR is up 43% trading within a broken symmetrical triangle with an RSI of 67 as per the 4-hour price chart.
Momentum is still going up, however, caution should be taken in the case of a pullback.
About Decred
Decred, launched in 2016, represents a significant evolution in the cryptocurrency space, emphasizing a blend of security, user empowerment, and adaptability. It stands out due to its innovative consensus mechanism that combines Proof-of-Work (PoW) and Proof-of-Stake (PoS), a method designed to ensure that both miners and coin holders contribute to the network's decision-making process.

Internet Computer ($ICP) Set For 300% Surge Amidst Falling WedgeThe price of the notable altcoin -Internet Computer ( CRYPTOCAP:ICP ) is gearing for 300% surge after breaking out of a falling wedge pattern constituting to a 40% breakout today.
The asset has been on a falling wedge for long oscillating between the $4- $5 region. present market metrics points to a bullish continuation pattern with eyes on the $20 resistant.
As of the time of writing the asset is up 33.% with a 4 hour RSI of 80 albeit bullish, connotes a temporary pullback before the spike in price.
In another event, Internet Computer Launches Self-Writing Caffeine AI Platform.
The launch signifies a leap towards decentralized self-written applications, invigorating ICP’s market with a 4% increase, underscoring significant shifts in blockchain technology infrastructure.
About Internet Computer
The Internet Computer blockchain incorporates a radical rethink of blockchain design, powered by innovations in cryptography. It provides the first “World Computer” blockchain that can be used to build almost any online system or service, including demanding web social media, without need for traditional IT such as cloud computing services. As such it can enable full end-to-end decentralization.

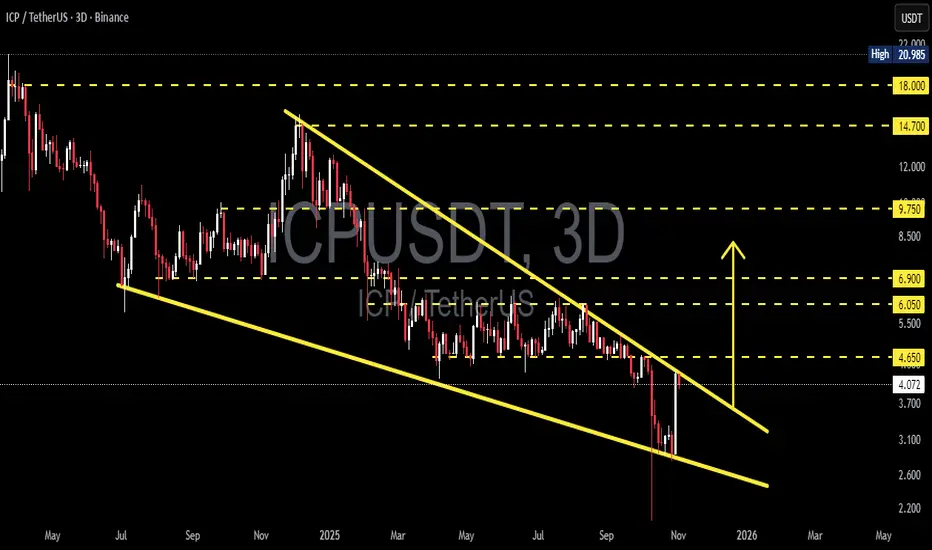
ICPUSDT – Major Reversal Setup Forming! Ready for Breakout Move?The ICP/USDT chart is currently displaying a highly critical structure as price continues to compress within a Falling Wedge pattern that has been developing since early 2025.
This formation is often seen as a bullish reversal signal — typically marking the end of a prolonged downtrend and the start of an accumulation or reversal phase.
At the current price level around $4.09, selling pressure has started to weaken, while buying pressure is gradually building up. Price is reacting positively from the lower wedge boundary and is now challenging the upper trendline resistance.
A confirmed breakout above this zone, especially with strong volume, could spark a major bullish momentum — opening the door for a move toward the next resistance targets at $4.65, $6.05, and $6.90.
However, if the price faces rejection once again from the upper wedge boundary, consolidation or another retest of the $3.10–$2.60 support zone remains possible.
This area marks a decisive moment for ICP’s mid-term direction.
---
Pattern Description
A clear Falling Wedge (Bullish Reversal Pattern) is visible through two downward-sloping and converging trendlines.
Key characteristics: lower lows are slowing down, highs continue to descend, and trading volume decreases over time.
Technical implication: selling pressure is fading, and accumulation is likely occurring before a potential reversal.
---
Bullish Scenario
A confirmed bullish breakout would occur once the price closes decisively above the upper wedge line and the $4.65 resistance on the 3-day timeframe, accompanied by a surge in trading volume.
If validated, upside targets could include:
Target 1: $6.05 (initial resistance and profit-taking area)
Target 2: $6.90 (mid-range wedge resistance)
Target 3: $9.75 (major resistance zone and possible momentum expansion)**
Breakouts from large falling wedges on higher timeframes often trigger strong mid- to long-term reversals, particularly when supported by high volume.
---
Bearish Scenario
If the breakout attempt fails and price gets rejected around the $4.65–$4.80 region, selling pressure could drag ICP back down toward the $3.10 – $2.60 support zone.
A breakdown below this area would invalidate the bullish setup and likely resume the macro bearish trend.
The $3.10 level is the key structural support — losing it would confirm renewed weakness.
---
Overall Outlook
ICP is currently at a make-or-break level, where a confirmed breakout could shift market sentiment from bearish to neutral–bullish.
The technical structure favors a potential trend reversal, but confirmation is crucial before positioning aggressively.
False breakouts remain possible, so risk management and patience are essential.
Psychologically, reclaiming $4.65 would be the first sign of a sentiment shift, potentially leading to renewed investor confidence in ICP’s mid-term recovery.
---
Summary
Pattern: Falling Wedge (Bullish Reversal Pattern)
Status: Approaching breakout area
Bullish Trigger Zone: Above $4.65
Bullish Targets: $6.05 → $6.90 → $9.75
Critical Support Zone: $3.10 – $2.60
Dominant Bias: Neutral turning bullish upon breakout confirmation
---
#ICP #ICPUSDT #ICPTether #CryptoAnalysis #TechnicalAnalysis #FallingWedge #ReversalPattern #BreakoutSetup #SwingTrade #CryptoChart #AltcoinWatch #MarketStructure
ICPUSDT Forming Falling WedgeICPUSDT is currently forming a classic falling wedge pattern, which is widely recognized as a bullish reversal setup in technical analysis. This structure indicates that selling pressure is gradually weakening while buyers are beginning to accumulate positions. As the wedge narrows, momentum is likely to shift in favor of the bulls, suggesting a potential upside breakout in the near term. With the current volume holding strong, the setup hints at growing investor participation and confidence in a possible price recovery.
The coin has been consolidating for some time, creating a base of support that could serve as a launchpad for the next bullish move. A breakout above the wedge’s resistance line would confirm the trend reversal, potentially driving prices toward the projected gain of 90% to 100%. Traders keeping an eye on momentum indicators like RSI and MACD may find early signs of strength, reinforcing the bullish outlook for ICPUSDT.
Investor interest has been steadily increasing as the project continues to gain visibility in the crypto market. The combination of a strong technical pattern, supportive volume, and improving sentiment positions ICPUSDT for a significant move upward once the breakout is confirmed. This could mark the beginning of a fresh uptrend for the coin as it attracts more short- and medium-term investors looking for momentum-driven opportunities.
✅ Show your support by hitting the like button and
✅ Leaving a comment below! (What is You opinion about this Coin)
Your feedback and engagement keep me inspired to share more insightful market analysis with you!
$ICP and Altcoins bottom against $BTCICP looks to be completing a 5 wave corrective Elliot wave count. We may be bottoming here putting in a higher low which will establish a trend change to the upside from a long term downtrend. It will be its first higher low.
ICP is also at the bottom of the channel that we have been trading in since early 2024, the move up after breaking channel has been aggressive the previous times, it should be just as explosive this time. The bar pattern is taken from the ICP drop from 2021 inverted. If alt season begins, likely ICP will go up as vertically as it fell down.
Interest in ICP needs to return as very low volume allows for price manipulation and keeping the price down. Whales have been accumulating more ICP which may indicate smart money is buying.
The bar pattern showing possible scenario and its time period is just my idea, not financial advice.

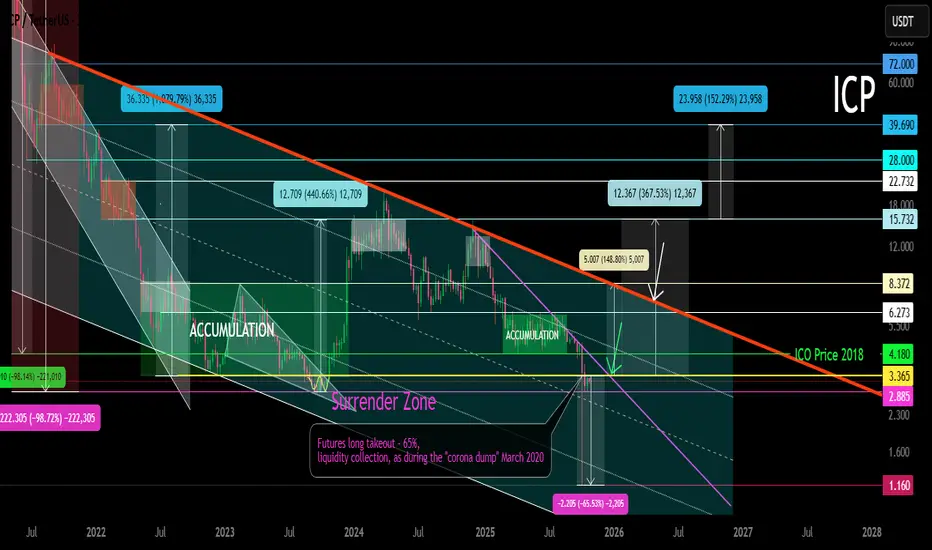
ICP Main Trend 10 2025Logarithm. Timeframe: 1 week. I'm updating my previous trading idea for the primary and secondary trends (it achieved its goals with pinpoint accuracy), published 2.5 years ago.
A patient and consistent person will be rewarded, while a restless person will not.
Locally, this reversal zone is after a futures long takeout:
Low-liquidity instruments and huge leverage (targeted by the main information traffic of "easy money" lures) are incompatible... logically... But, it's profitable for exchanges to create such futures trading instruments, as people will leave their money there. There's no real supply or demand, and exchange algorithms completely control the price (volatility), which is why "traders" are doomed.
That's why we've recently seen cascading collapses in futures liquidity and mass liquidations, which have been reflected in the spot market. Spike prices on many instruments reached -40-80%, practically in a completely empty order book.
It's quite easy to direct the price to such a massive liquidation up or down on a large exchange by manipulating the entire trading volume, given low supply and demand. However, this is impossible (considered blatant manipulation) on a single instrument, and there will be many questions and lawsuits. But if this is done on hundreds of cryptocurrencies simultaneously and across all exchanges, under a correspondingly negative news backdrop, everything is fine; it's the market and the negative news.
My point of view for ICPDear Follower
I got a multi request to analyze ICP
I see ICP most likely will hit $45 as a final target
I recommend liquidate 50% of your fund at that price then start use a trilling stop under each last new bottom for the rest of the fund
Good luck everyone

ICP Big Oppotunity Don't Miss Out!Hey Guys!
Wether you're an early investor of ICP or not, the current situation is different!
As you know ICP has been going on a downtrend since the day it has been launched and a lot of early investors lost their money betting on a real project like ICP thinking it will be the next $Eth.
But with Tragedy comes opportunity ! ICP's Price is about to touch down on the monthly lower Bollinger Bandat 0.6$ which is a historical event in my opinion and with it should come a big reaction by the devs or the investor's community.
I expect a big volume candle followed by a bullish news to breakout from the accumilation zone which will finally end the downtrend for ICP that lasted for years now.
Either way don't be greedy and keep in mind that ICP has an unlimited supply at this time (might change if the project community vote on it) but do the math and don't risk it.
I'm looking forward to hear your thoughts on this and feel free to leave a comment.

ICPUSD - Falling Wedge Falling Wedge pattern on this daily chart for ICPUSD
Bullish breakouts usually result from these patterns
Thinking the right side up might match the left side down with the vertical line being the middle of the structure

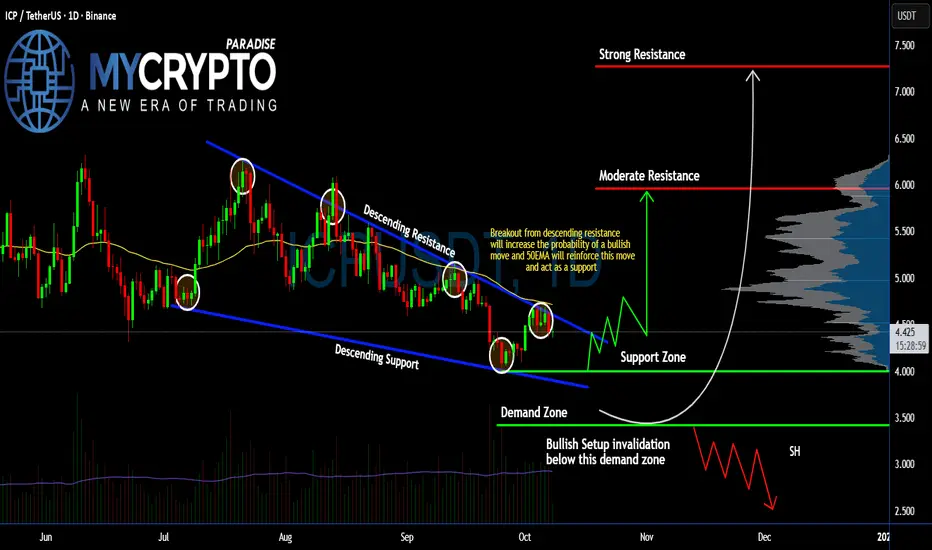
Is #ICP Ready to Make a Bullish Move? Watch it Closely Bulls Yello Paradisers! Will #ICP finally break out of this long-standing downtrend, or is a brutal shakeout brewing just below the surface? Let’s dive deep into #InternetComputer setup:
💎#ICPUSDT has been stuck inside a falling wedge since mid-July, bouncing precisely between descending resistance and support. Currently, the price is coiling right beneath that descending resistance line, and the squeeze is getting tighter. A breakout from this zone would significantly increase the probability of a bullish reversal, especially with the 50EMA right above acting as dynamic resistance-turned-support if the breakout is confirmed.
💎The support zone around $4.0 has already triggered multiple bounces in recent sessions, showing strong buyer interest. If bulls can hold this level and push through the channel resistance, the first key upside target is the moderate resistance at $5.96.
💎A successful break above $5.96 would open the door to the strong resistance at $7.27, where we expect significant selling pressure. For the #ICPUSD, volume confirmation on the breakout will be crucial, and without it, any move may turn into a bull trap.
💎On the flip side, if #ICP fails to hold the $4.00 support and breaks below the demand zone at $3.42, the bullish scenario will be invalidated. That would likely lead to a continuation of the downtrend with a sharp leg lower, potentially printing new short-term lows. This is the final line of defense — if lost, we expect stop-hunts and heavy liquidations to follow.
Strive for consistency, wait for clear confirmations, and remember that discipline always beats chasing quick profits.
MyCryptoParadise
iFeel the success🌴
ICPUSDT — Retesting Demand Zone: Capitulation or Major Reversal?Weekly Overview
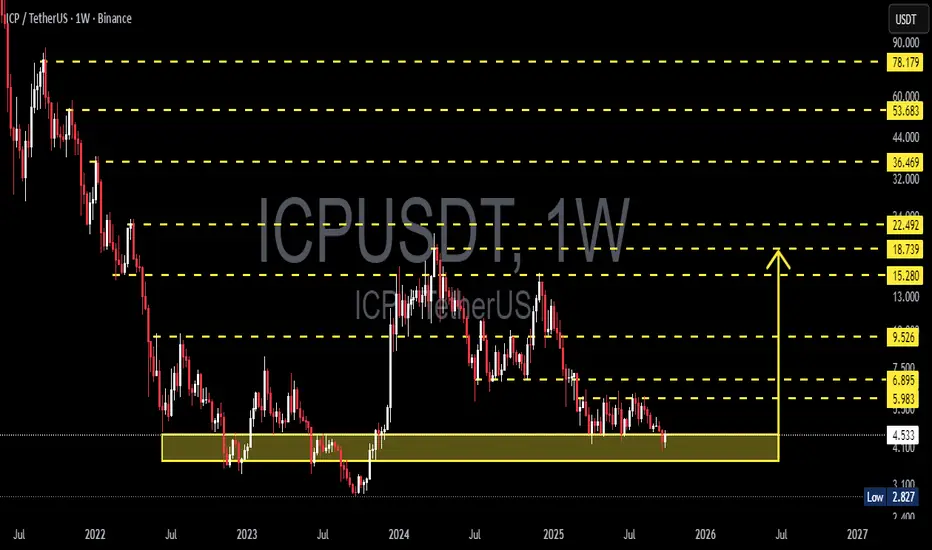
Internet Computer (ICP) is now entering a critical test phase at its long-standing historical demand zone between 2.80 and 4.53 USDT — an area that has repeatedly acted as the last line of defense for buyers since mid-2022.
This zone is not just another technical level. It represents a multi-year accumulation range where institutional money has historically shown interest, triggering two major reversals in the past (early 2023 and early 2024).
Now, the market is testing it for the third time, and the outcome of this retest may decide ICP’s direction for the next several months — or even years.
---
Structure and Pattern Context
Since its peak in 2021, ICP has been in a long-term structural downtrend, forming a sequence of consistent lower highs.
However, it’s also built a horizontal accumulation base below 5 USDT.
The 2.80–4.53 zone acts as a compressed demand layer, where selling pressure weakens every time this range is revisited.
On the weekly timeframe, recent candles show:
Smaller body sizes,
Long lower wicks,
And declining bearish volume — clear signs of seller exhaustion.
In short, the market stands at a crossroads between “the final breakdown” and “the birth of a long-term reversal.”
---
Bullish Scenario — Potential Reversal Phase
If this demand zone holds once again, ICP could enter a medium-term reversal cycle.
Here’s what would confirm a bullish structure shift:
1. Bullish Reversal Candle — a weekly engulfing, hammer, or morning star pattern appearing inside 2.80–4.53.
2. Volume Confirmation — a noticeable increase in bullish volume, signaling smart money accumulation.
3. Structure Break — a successful weekly close above 5.98 USDT, forming a new higher high.
If these confirmations occur, ICP could initiate a gradual expansion phase toward key resistance targets:
Target 1: 5.98 USDT – structure validation
Target 2: 6.90 USDT – breakout confirmation
Target 3: 9.53 USDT – major swing resistance
Mid-term target: 15.28–18.73 USDT if momentum persists
Each step upward will depend on overall crypto sentiment and volume strength across the market.
---
Bearish Scenario — Breakdown & Capitulation Risk
If bearish pressure continues and ICP closes a weekly candle below 2.80, the accumulation base built over the last two years would become invalidated.
Such a breakdown could trigger final capitulation, characterized by panic selling and heavy volume.
Below 2.80, there’s no major historical support, meaning the price could enter a free-fall zone toward 2.00 or lower before stabilizing.
Ironically, such capitulation events often mark the true bottom of a cycle — a classic pattern seen before every major crypto bull run.
---
Structural Perspective — End of the Downtrend?
Some longer-term signals suggest ICP may be approaching trend exhaustion:
Weekly RSI has remained in oversold territory for a prolonged time, while price fails to make new lows — indicating bullish divergence.
Major distribution phases occurred between 2022–2023, implying most selling pressure is likely done.
Price action resembles a late-stage accumulation phase, where smart money prepares for long-term positions (12–24 months ahead).
If this demand holds, the 2.80–4.53 range could become ICP’s legendary bottom, much like ETH’s 2020 base or ADA’s 2020–2021 accumulation.
---
Conclusion
ICP stands at a make-or-break point — the most decisive level it has seen in two years.
Holding 2.80–4.53 → opens the door for a potential major reversal.
Breaking below 2.80 → signals a final capitulation phase before a new cycle emerges.
Until proven otherwise, the reaction and weekly close inside this demand zone remain the key factor to watch.
As long as 2.80 holds, the bullish probability still exists.
#ICP #ICPUSDT #InternetComputer #Crypto #TechnicalAnalysis #PriceAction #DemandZone #SwingTrade #CryptoMarket #WeeklyChart #ReversalSetup #CryptoTA #Accumulation
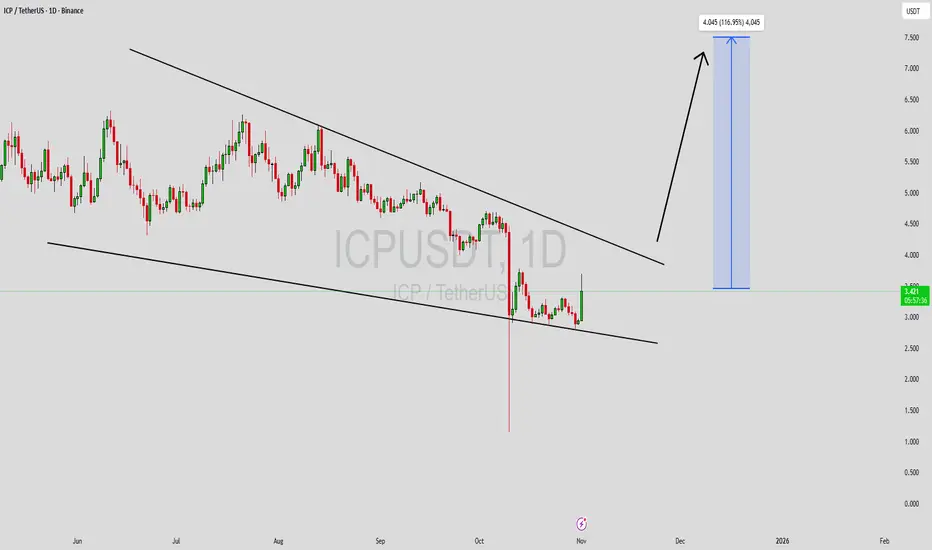
ICP: False Break, Bullish Reversal in PlaySince the low from early April, ICP has traded within a well-defined range between $4.5 and $6.0.
Recently, the price broke below the range support, reaching as low as $4.0, but this move lacked follow-through. Instead, ICP quickly rebounded — a classic false break signal.
This rebound also resulted in a break above the descending trendline that started in mid-August, giving the chart a decisively bullish tone.
At this stage, all signals point toward further upside continuation, with the upper boundary near $6.0 as the first natural target.
However, considering that false breaks in one direction often lead to real breaks in the opposite, there’s a strong possibility that ICP could break above $6.0 in the medium term, potentially accelerating toward the key $10.0 zone.
________________________________________
✅ Key Takeaways:
• Range: $4.5 – $6.0
• False break below $4.0 reversed quickly
• Trendline from August broken to the upside
• Bullish outlook → targets $6.0 and possibly $10.0

ICPUSD – Trading the Range with PrecisionSince December last year, ICP has been in a persistent downtrend, sliding from 15 USD to below 5 USD. Sellers have clearly dominated the longer-term picture.
However, after establishing April’s low, the market transitioned into a well-defined sideways range between 4.5 and 6.2 USD. This type of consolidation after a heavy decline often signals a pause – and can present trading opportunities within the boundaries.
Right now, ICPUSD is once again testing the bottom of this range near 4.5. From a tactical perspective, this creates a favorable setup: by entering long positions at the range low, we can aim for the upper boundary with a 1:3.5 risk-to-reward ratio.
Trading Plan:
• ✅ Favor long positions near 4.5 USD
• 🛑 Place a tight stop-loss just below range support
• 🎯 First target: 6.0 – 6.2 USD, the upper range resistance
Conclusion: Until ICPUSD breaks decisively below support, the range remains intact. I favor buying dips with disciplined risk management, targeting the 6 USD area for a clean swing trade setup. 🚀

ICP Market Update📊 FWB:ICP Market Update
Watching FWB:ICP around $4.920 🟢
👉 Key zone for potential bounce + long entry 🚀
⚡ Trade smarter, not hope 🔑

ICP LONG SET-UPBINANCE:ICPUSDT
ICP Looking good to long at cmp
a small dip possible , will add rest 50%
using low leverage only
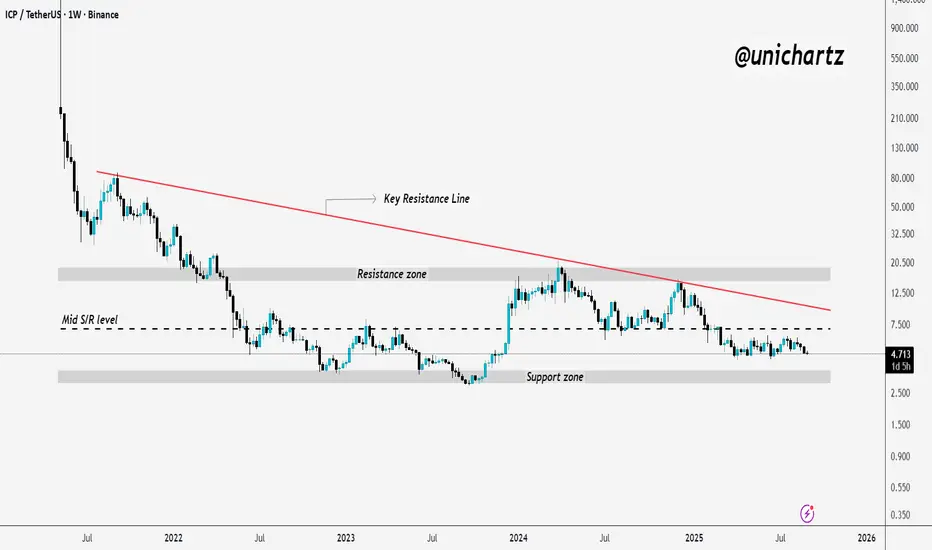
ICP Chart Update: Bearish Bias Until Proven OtherwiseFWB:ICP has been stuck in a long downtrend and still hasn’t managed to break past its resistance. Right now it’s sitting near a key support zone, where buyers need to show up if there’s going to be any bounce toward higher levels.
If that support cracks, more downside is likely. For the moment, the chart leans bearish, so it’s better to stay patient until real strength shows.
DYOR, NFA
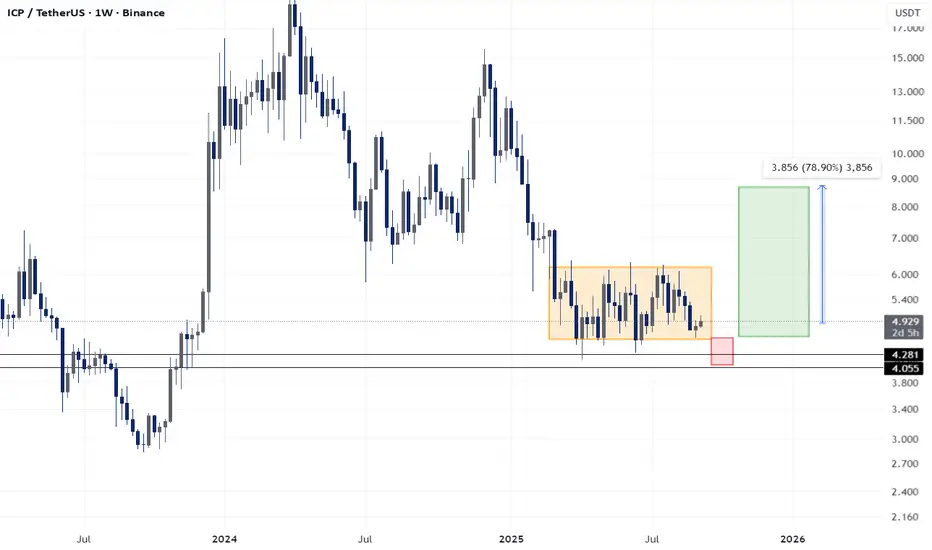
ICP/USDT — Major Demand Zone Retest: Rebound or Breakdown Ahead?At the moment, ICP is standing at a very critical crossroads. The weekly chart shows the price retesting the historical demand zone around $4.10 – $4.79. This area has repeatedly acted as a strong accumulation base in the past, triggering significant rallies. However, the more often this zone gets tested without a breakout to the upside, the higher the risk of a breakdown.
---
🔎 Key Technical Structure
1. Long-Term Trend: ICP remains in a broad downtrend since launch, with failed mid-term rallies along the way.
2. Demand Zone $4.1 – $4.8: A psychological and historical support area, holding the price since 2022.
3. Layered Resistances: Key levels to watch are $5.98, $6.90, $9.53, followed by $15.28, $18.74, and $22.49. Breaking through these would confirm a larger bullish reversal.
4. Final Support Below: If breakdown occurs, the next major level sits at $2.827 — a historical low.
---
📈 Bullish Scenario
Validation: A strong weekly bullish close within or above $4.1–$4.8, supported by rising volume, would signal potential accumulation.
Short-Term Target: $5.98 – $6.90 → reclaiming this range could push ICP toward $9.53.
Mid-Term Target: If momentum continues, ICP could revisit $15.28 – $18.74, and even $22.49.
Potential Pattern: A double bottom / W pattern would form if price closes above the $6.9 neckline.
---
📉 Bearish Scenario
Breakdown Confirmation: A weekly close below $4.10 = strong bearish continuation signal.
Downside Target: Price may slide toward $2.827 (historical low).
Seller Dominance: A breakdown with rising sell volume would confirm extended bearish control.
Risk Factor: Losing this demand zone would likely extend ICP’s bear cycle significantly.
---
📊 Price Action & Patterns
Sideways Range in Demand Zone: Currently, price is moving sideways within demand → this is a classic setup for accumulation or distribution.
Breakout Above: Signals accumulation → start of a potential uptrend.
Breakdown Below: Signals distribution → likely deeper decline.
---
⚖️ Conclusion
ICP is at a make-or-break zone:
Holding above $4.1–$4.8 could spark a strong reversal rally back toward $6.9 – $9.5, with higher targets possible.
A breakdown below $4.1 would expose ICP to a retest of the $2.8 low, keeping the long-term bearish structure intact.
📌 For traders, this is the time to wait for weekly candle confirmation & volume before committing.
📌 For long-term investors, this zone offers a high-risk but high-reward accumulation area — strict stop losses are essential.
---
#ICP #ICPUSDT #CryptoAnalysis #WeeklyChart #SupportResistance #TechnicalAnalysis #SwingTrading #Altcoins #CryptoStrategy

Bullish Setup: ICP Eyes 70% Gain if Resistance BreaksAfter the strong drop that started in December last year — a move of almost 70%, from 15.5 down to around 4 — ICP entered a 4-month consolidation/accumulation phase.
The range is well defined:
• Support: around 4.5
• Resistance: slightly above 6
With Total3 showing a bullish outlook, there’s a high probability that ICP will finally break above 6 and accelerate towards the 10 USD key zone.
That would mean roughly a 70% upside, and with a 1:3 risk-to-reward ratio, this setup deserves your attention.
📌 Plan : Watch for a confirmed breakout above 6 and manage risk according to your trading rules.
🚀

ICPUSD on Buying ZoneInternet Computer Protocol, a giant sleept, has a big potential to up + 1000% , but being objective, right now is probably that go down little bit more before the big up .
The best long oportunity would be at 4.340 - 3.385 USD but is probably that never going there, because we are on the buying zone . The real target is on 40-50 USD per crypto
But actually, ICP has the potential to be a top 3 markep cap crypto
