#ICP/USDT The price is moving in a descending channel#ICP
The price is moving within a descending channel on the hourly timeframe. It has reached the lower boundary and is heading towards a breakout, with a retest of the upper boundary expected.
The Relative Strength Index (RSI) is showing a downward trend, approaching the lower boundary, and an upward bounce is anticipated.
There is a key support zone in green at 2.54, and the price has bounced from this level several times. Another bounce is expected.
The indicator is showing a trend towards consolidation above the 100-period moving average, which we are approaching, supporting the upward move.
Entry Price: 2.75
First Target: 2.85
Second Target: 3.00
Third Target: 3.18
Stop Loss: Below the green support zone.
Remember this simple thing: Money management.
For any questions, please leave a comment.
Thank you.
ICPBTC

#ICP/USDT The price is moving in a descending channel#ICP
The price is moving within a descending channel on the hourly timeframe. It has reached the lower boundary and is heading towards a breakout, with a retest of the upper boundary expected.
The Relative Strength Index (RSI) is showing a downward trend, approaching the lower boundary, and an upward bounce is anticipated.
There is a key support zone in green at 3.16, and the price has bounced from this level several times. Another bounce is expected.
The indicator is showing a trend towards consolidation above the 100-period moving average, which we are approaching, supporting the upward move.
Entry Price: 3.32
First Target: 3.42
Second Target: 3.54
Third Target: 3.70
Stop Loss: Below the green support zone.
Remember this simple thing: Money management.
For any questions, please leave a comment.
Thank you.

ICP Bullish Structure | Smart DCA Entries at Key Support ZonesThe overall market structure of ICP is clearly bullish, with buyers actively stepping in at key support zones. This behavior shows strong demand, and it would be wise for us to align ourselves with the dominant trend by placing our buy orders within these support areas, allowing us to enter positions in the direction of the prevailing flow.
We are seeing consecutive bullish CH (Change of Character) and BOS (Break of Structure), which are strong confirmations of a potential continuation to the upside. The bullish impulse waves are powerful and impulsive, while the corrective moves are weak, shallow, and composed of small candles, indicating that sellers lack strength and that momentum remains in favor of the bulls.
There are two planned entry zones, and the position should be built using a DCA (Dollar-Cost Averaging) approach to manage risk and improve the average entry price. This strategy allows flexibility in case of short-term pullbacks while maintaining exposure to the bullish trend.
All targets are clearly marked on the chart, based on structure, liquidity zones, and higher-timeframe levels.
⚠️ Risk Management:
This bullish scenario will be invalidated if a daily candle closes below the invalidation level. Such a move would indicate a breakdown in structure and require reassessment of the setup.
As always, proper risk management is essential, and traders should manage position size according to their own strategy.
If you would like us to analyze a coin or altcoin for you, first like this post, then comment the name of your altcoin below.

ICPUSDT Forming Bullish WaveICPUSDT is forming a clear bullish wave pattern, a classic bullish reversal signal that often indicates an upcoming breakout. The price has been consolidating within a narrowing range, suggesting that selling pressure is weakening while buyers are beginning to regain control. With consistent volume confirming accumulation at lower levels, the setup hints at a potential bullish breakout soon. The projected move could lead to an impressive gain of around 140% to 150% once the price breaks above the wedge resistance.
This falling wedge pattern is typically seen at the end of downtrends or corrective phases, and it represents a potential shift in market sentiment from bearish to bullish. Traders closely watching ICPUSDT are noting the strengthening momentum as it nears a breakout zone. The good trading volume adds confidence to this pattern, showing that market participants are positioning early in anticipation of a reversal.
Investors’ growing interest in ICPUSDT reflects rising confidence in the project’s long-term fundamentals and current technical strength. If the breakout confirms with sustained volume, this could mark the start of a fresh bullish leg. Traders might find this a valuable setup for medium-term gains, especially as the wedge pattern completes and buying momentum accelerates.
✅ Show your support by hitting the like button and
✅ Leaving a comment below! (What is your opinion about this Coin?)
Your feedback and engagement keep me inspired to share more insightful market analysis with you!

#ICP/USDT Short 1 H#ICP
The price is moving within a descending channel on the hourly timeframe. It has reached the upper boundary and is heading towards breaking it. A retest of this boundary is expected.
The Relative Strength Index (RSI) is showing an upward trend, as it has approached the upper boundary. A bearish reversal is expected.
There is a key support zone in green at 3.51. The price has bounced from this zone several times and is expected to bounce again.
A consolidation trend is observed above the 100-period moving average, which we are approaching. This trend supports a decline towards this level.
Entry Price: 3.22
Target 1: 3.15
Target 2: 3.047
Target 3: 2.94
Stop Loss: Above the green support zone.
Remember this simple thing: Money management.
For any questions, please leave a comment.
Thank you.

#ICP/USDT The price is moving in a descending channel#ICP
The price is moving in a descending channel on the 1-hour timeframe. It has reached the lower boundary and is heading towards a breakout, with a retest of the upper boundary expected.
We are seeing a bearish trend in the Relative Strength Index (RSI), which has reached near the lower boundary, and an upward bounce is expected.
There is a key support zone in green at 3.03, and the price has bounced from this level several times. Another bounce is expected.
We are seeing a trend towards stabilizing above the 100-period moving average, which we are approaching, supporting the upward trend.
Entry Price: 3.11
First Target: 3.13
Second Target: 3.22
Third Target: 3.33
Place your stop-loss order below the green support zone.
Remember a simple principle: Money Management.
For any questions, please leave a comment.
Thank you.

#ICP/USDT The price is moving in a descending channel#ICP
The price is moving in a descending channel on the 1-hour timeframe. It has reached the lower boundary and is heading towards breaking above it, with a retest of the upper boundary expected.
We have a downtrend on the RSI indicator, which has reached near the lower boundary, and an upward rebound is expected.
There is a key support zone in green at 2.77. The price has bounced from this zone multiple times and is expected to bounce again.
We have a trend towards stability above the 100-period moving average, as we are moving close to it, which supports the upward movement.
Entry price: 2.82
First target: 2.87
Second target: 2.94
Third target: 3.03
Stop loss: Below the support zone in green.
Don't forget a simple thing: capital management.
For inquiries, please leave a comment.
Thank you.

#ICP/USDT The price is moving in a descending channel#ICP
The price is moving in a descending channel on the 1-hour timeframe. It has reached the lower boundary and is heading towards breaking above it, with a retest of the upper boundary expected.
We have a downtrend on the RSI indicator, which has reached near the lower boundary, and an upward rebound is expected.
There is a key support zone in green at 3.10. The price has bounced from this zone multiple times and is expected to bounce again.
We have a trend towards consolidation above the 100-period moving average, as we are moving close to it, which supports the upward movement.
Entry price: 3.18
First target: 3.25
Second target: 3.37
Third target: 3.51
Don't forget a simple principle: money management.
Place your stop-loss below the support zone in green.
For any questions, please leave a comment.
Thank you.

#ICP/USDT The price is moving in a descending channel#ICP
The price is moving in a descending channel on the 1-hour timeframe. It has reached the lower boundary and is heading towards breaking above it, with a retest of the upper boundary expected.
We have a downtrend on the RSI indicator, which has reached near the lower boundary, and an upward rebound is expected.
There is a key support zone in green at 3.25. The price has bounced from this zone multiple times and is expected to bounce again.
We have a trend towards consolidation above the 100-period moving average, as we are moving close to it, which supports the upward movement.
Entry price: 3.30
First target: 3.35
Second target: 3.43
Third target: 3.50
Don't forget a simple principle: money management.
Place your stop-loss below the support zone in green.
For any questions, please leave a comment.
Thank you.

#ICP/USDT The price is moving in a descending channel#ICP
The price is moving in a descending channel on the 1-hour timeframe. It has reached the lower boundary and is heading towards breaking above it, with a retest of the upper boundary expected.
We have a downtrend on the RSI indicator, which has reached near the lower boundary, and an upward rebound is expected.
There is a key support zone in green at 2.80. The price has bounced from this zone multiple times and is expected to bounce again.
We have a trend towards consolidation above the 100-period moving average, as we are moving close to it, which supports the upward movement.
Entry price: 2.88
First target: 2.92
Second target: 2.98
Third target: 3.06
Don't forget a simple principle: money management.
Place your stop-loss below the support zone in green.
For any questions, please leave a comment.
Thank you.

#ICP/USDT #ICP The price is moving in a descending channel #ICP
The price is moving in a descending channel on the 1-hour timeframe. It has reached the lower boundary and is heading towards breaking above it, with a retest of the upper boundary expected.
We have a downtrend on the RSI indicator, which has reached near the lower boundary, and an upward rebound is expected.
There is a key support zone in green at 3.40. The price has bounced from this zone multiple times and is expected to bounce again.
We have a trend towards consolidation above the 100-period moving average, as we are moving close to it, which supports the upward move.
Entry price: 3.43
First target: 3.48
Second target: 3.55
Third target: 3.63
Don't forget a simple principle: money management.
Place your stop-loss below the green support zone.
For any questions, please leave a comment.
Thank you.
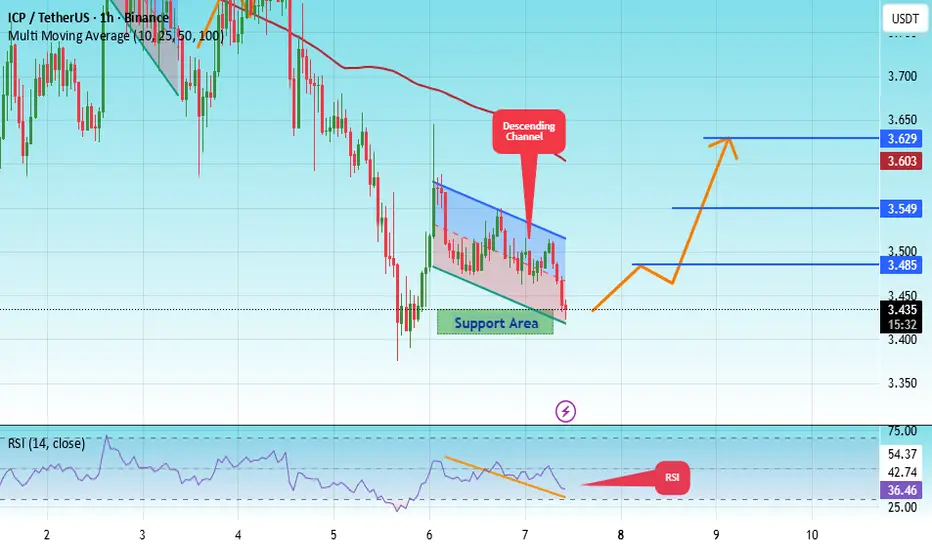
#ICP/USDT Ready for a Breakout — Double Digits Possible#ICP
The price is moving in a descending channel on the 1-hour timeframe. It has reached the lower boundary and is heading towards breaking above it, with a retest of the upper boundary expected.
We have a downtrend on the RSI indicator, which has reached near the lower boundary, and an upward rebound is expected.
There is a key support zone in green at 3.70. The price has bounced from this zone multiple times and is expected to bounce again.
We have a trend towards stability above the 100-period moving average, as we are moving close to it, which supports the upward movement.
Entry price: 3.74
First target: 3.82
Second target: 3.90
Third target: 4.00
Don't forget a simple principle: money management.
Place your stop-loss below the green support zone.
For any questions, please leave a comment.
Thank you.
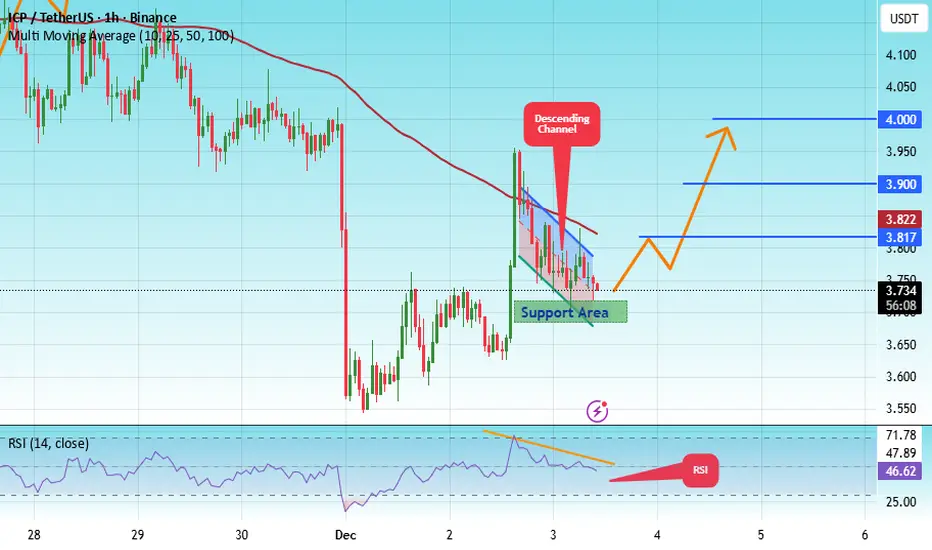
#ICP/USDT Ready for a Breakout — Double Digits Possible#ICP
The price is moving in a descending channel on the 1-hour timeframe. It has reached the lower boundary and is heading towards breaking above it, with a retest of the upper boundary expected.
We have a downtrend on the RSI indicator, which has reached near the lower boundary, and an upward rebound is expected.
There is a key support zone in green at 4.04. The price has bounced from this zone multiple times and is expected to bounce again.
We have a trend towards consolidation above the 100-period moving average, as we are moving close to it, which supports the upward movement.
Entry price: 4.12
First target: 4.22
Second target: 4.37
Third target: 4.55
Don't forget a simple money management rule:
Place your stop-loss order below the green support zone.
Once you reach the first target, save some money and then change your stop-loss order to an entry order.
For any questions, please leave a comment.
Thank you.

#ICP/USDT Ready for a Breakout — Double Digits Possible#ICP
The price is moving within an ascending channel on the 1-hour timeframe and is adhering to it well. It is poised to break out strongly and retest the channel.
We have a downtrend line on the RSI indicator that is about to break and retest, which supports the upward move.
There is a key support zone in green at the 4.90 price, representing a strong support point.
We have a trend of consolidation above the 100-period moving average.
Entry price: 5.05
First target: 5.20
Second target: 5.42
Third target: 5.70
Don't forget a simple money management tip:
Place your stop-loss order below the green support zone.
Once you reach the first target, save some money and then change your stop-loss order to an entry order.
For any questions, please leave a comment.
Thank you.

#ICP/USDT wakes up from the dead!#ICP
The price is moving within an ascending channel on the 1-hour timeframe and is adhering to it well. It is poised to break out strongly and retest the channel.
We have a downtrend line on the RSI indicator that is about to break and retest, which supports the upward move.
There is a key support zone in green at the 5.70 price level, representing a strong support point.
We have a trend of consolidation above the 100-period moving average.
Entry price: 6.30
First target: 6.70
Second target: 7.23
Third target: 7.97
Don't forget a simple money management tip:
Place your stop-loss order below the green support zone.
Once you reach the first target, save some money and then change your stop-loss order to an entry order.
For any questions, please leave a comment.
Thank you.

ICPUSDT Forming Falling WedgeICPUSDT is forming a clear falling wedge pattern, a classic bullish reversal signal that often indicates an upcoming breakout in crypto trading pairs like this one. The price has been consolidating within a narrowing range after recent dips to the multi-year support zone around $4-$5, suggesting that selling pressure is weakening while buyers are beginning to regain control near key levels like $5.13-$6. With good volume confirming accumulation at these lower levels amid surging network activity and AI integrations, the setup hints at a potential bullish breakout soon, especially as Internet Computer's decentralized infrastructure and recent Caffeine AI launch fuel renewed momentum. The projected move could lead to an impressive gain of 160% to 170%+ once the price breaks above the wedge resistance, targeting zones up to $13-$15 and beyond in this altcoin price action.
This falling wedge pattern is typically seen at the end of downtrends or corrective phases, and it represents a potential shift in market sentiment from bearish to bullish for ICPUSDT. Traders closely watching this crypto pair are noting the strengthening momentum as it nears a breakout zone around $6.75-$7.8, with technical indicators like RSI showing oversold bounces and fib retracement levels holding firm on the daily and weekly charts. The good trading volume adds confidence to this pattern, showing that market participants are positioning early in anticipation of a reversal, particularly with recent 43% surges and whale accumulations signaling ecosystem growth.
Investors’ growing interest in ICPUSDT reflects rising confidence in the project’s long-term fundamentals, including its layer-one blockchain for AI, DeFi, and web3 scalability, alongside current technical strength in this falling wedge setup. As of November 2025, trading activity spikes, top wallet holdings up 30%, and institutional bets underscore real demand, making this a high-conviction opportunity for those hunting bullish reversal patterns in altcoins. If the breakout confirms with sustained volume, this could mark the start of a fresh bullish leg, with projections eyeing $10-$12 for substantial medium-term gains as buying momentum accelerates in the broader crypto recovery.
✅ Show your support by hitting the like button and ✅ Leaving a comment below! (What is You opinion about this Coin) Your feedback and engagement keep me inspired to share more insightful market analysis with you!

ICPUSDT - many positive indicators!The coin ICP has pumped nearly 160% in just one week, and believe it or not — all that move happened without even breaking out of the accumulation range it’s been forming for over 275 days.
So imagine what will happen once it finally breaks out!
The high volume and bullish indicators on the chart suggest that this coin’s minimum target is around $30, meaning roughly a 5x potential from the current level.
It has already broken above the 0.618 Fibonacci resistance, broken the main trendline (marked in blue), and even formed a Golden Cross pattern.
It’s still inside the accumulation zone for now, so this is your early entry opportunity — because once it breaks out, you won’t catch it again.
Mark my words.
Best Regards:
Ceciliones🎯

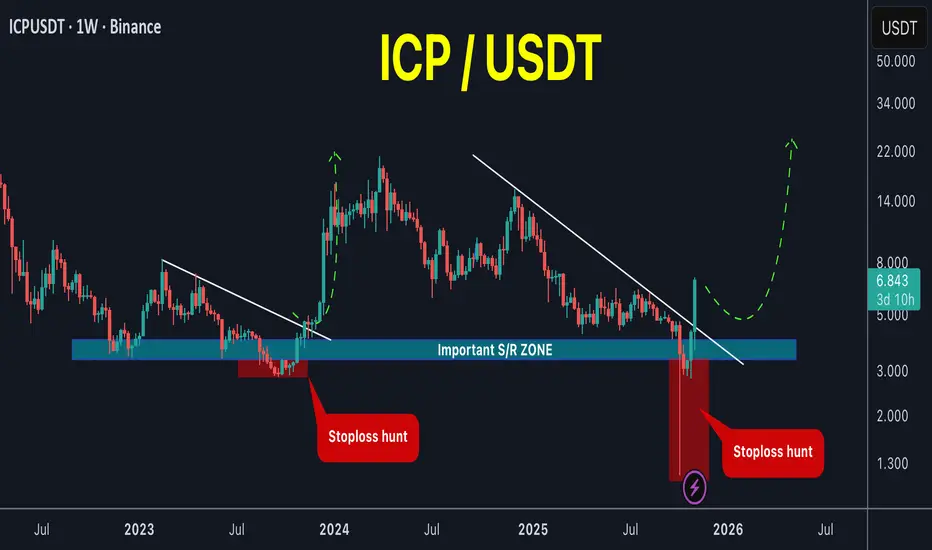
ICP wakes up from the dead!#ICP / USDT
After being useless for several months this coin made a similar movements like the one in late 2023
Price dropped below the most important S/R zone in chart taking the liquidity and after that massive volume started to enter the coin
Such movement in late 2023 ends up in X5 increase in its price in next months (after restoring the S/R)… price can make the similar movement here … ICP is waking up from the dead !
ICPUSDT Forming Falling WedgeICPUSDT is forming a classic falling wedge pattern, a bullish reversal signal that often indicates a potential trend change after a prolonged downtrend. The current market structure shows narrowing price action with strong support levels being defended by buyers. With a good volume backing recent moves, this setup suggests that ICP could be gearing up for a significant breakout to the upside. Technical traders are closely watching this zone for confirmation, as a breakout from the wedge could unlock an impressive 90% to 100% gain potential.
Investor sentiment toward ICP has been improving as the project continues to show resilience in market volatility. The falling wedge pattern aligns with a possible phase of accumulation where strong hands are positioning themselves before a new bullish cycle begins. The increasing trading activity around key price zones highlights growing confidence from both retail and institutional participants. Once the resistance line is breached, it may spark strong momentum toward higher levels.
The overall technical landscape for ICPUSDT points toward a bullish reversal supported by rising volume and steady investor interest. The pattern’s tightening structure shows reduced selling pressure and indicates that bulls are preparing for a potential breakout rally. Traders watching this pair should stay alert for confirmation candles or a volume surge, as these are often the first signs of an impending trend shift that could deliver the expected gains.
✅ Show your support by hitting the like button and
✅ Leaving a comment below! (What is You opinion about this Coin)
Your feedback and engagement keep me inspired to share more insightful market analysis with you!

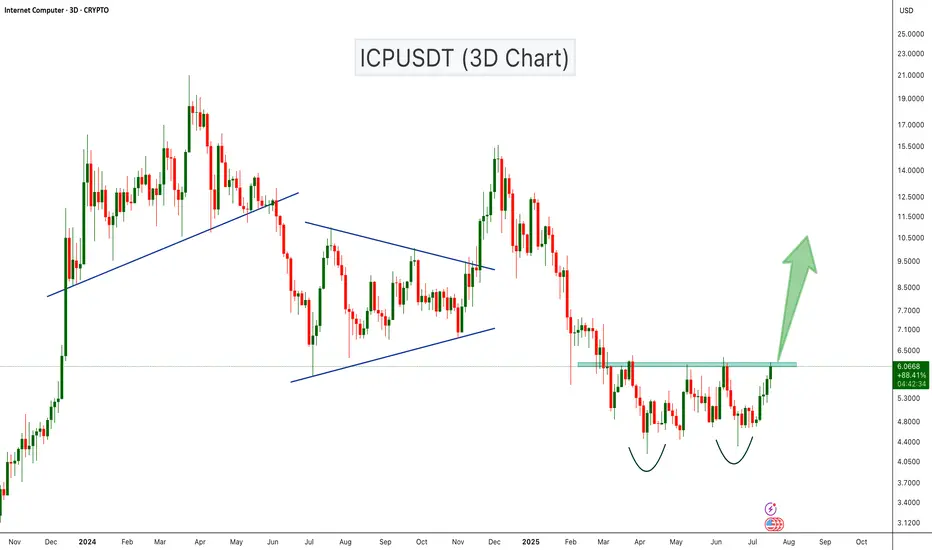
ICPUSDT Double Bottom Breakout Loading?ICPUSDT is showing a strong bullish setup with a classic double bottom pattern forming on the 3-day chart. The price has tested the support zone twice and is now approaching the neckline resistance around the $6.10 level. A confirmed breakout above this resistance could trigger a strong bullish move toward the next key resistance levels near $9.50 and $15.
Cheers
Hexa
#ICP/USDT#ICP
The price is moving within a descending channel on the 1-hour frame, adhering well to it, and is heading towards a strong breakout and retest.
We are experiencing a rebound from the lower boundary of the descending channel, which is support at 5.85.
We are experiencing a downtrend on the RSI indicator that is about to be broken and retested, supporting the upward trend.
We are heading towards stability above the 100 Moving Average.
Entry price: 6.04
First target: 6.13
Second target: 6.28
Third target: 6.50

$ICP: Internet Computercup and handle on the weekly timeframe with a trend line breakout, double retest, oversold rsi, and bullish looking mac d. do whatever you like with this information. not financial advice, gaming advice 🎮
CRYPTOCAP:ICP
BINANCE:ICPUSDT
COINBASE:ICPUSD
BINANCE:ICPUSD
