#ICP/USDT The price is moving in a descending channel#ICP
The price is moving in a descending channel on the 1-hour timeframe. It has reached the lower boundary and is heading towards breaking above it, with a retest of the upper boundary expected.
We have a downtrend on the RSI indicator, which has reached near the lower boundary, and an upward rebound is expected.
There is a key support zone in green at 2.80. The price has bounced from this zone multiple times and is expected to bounce again.
We have a trend towards consolidation above the 100-period moving average, as we are moving close to it, which supports the upward movement.
Entry price: 2.88
First target: 2.92
Second target: 2.98
Third target: 3.06
Don't forget a simple principle: money management.
Place your stop-loss below the support zone in green.
For any questions, please leave a comment.
Thank you.
Icpusdtanalysis

#ICP/USDT #ICP The price is moving in a descending channel #ICP
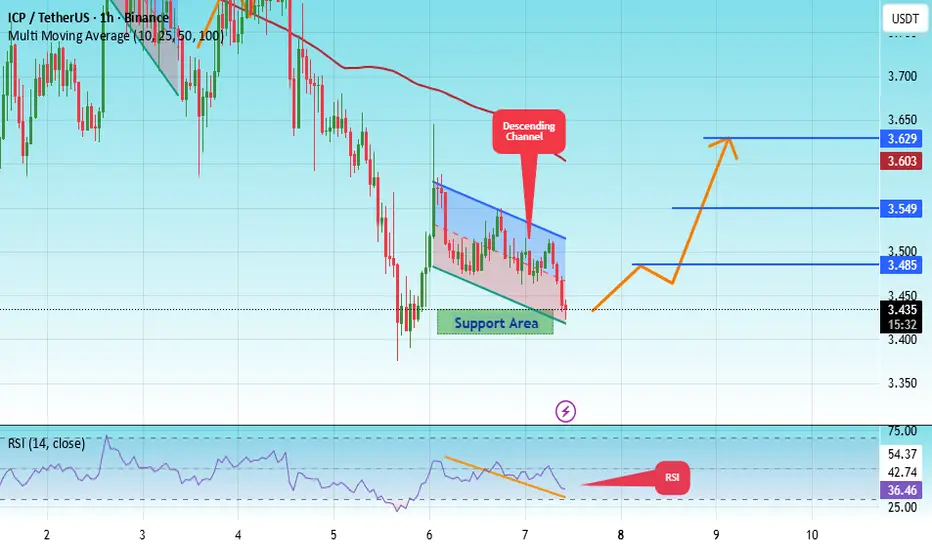
The price is moving in a descending channel on the 1-hour timeframe. It has reached the lower boundary and is heading towards breaking above it, with a retest of the upper boundary expected.
We have a downtrend on the RSI indicator, which has reached near the lower boundary, and an upward rebound is expected.
There is a key support zone in green at 3.40. The price has bounced from this zone multiple times and is expected to bounce again.
We have a trend towards consolidation above the 100-period moving average, as we are moving close to it, which supports the upward move.
Entry price: 3.43
First target: 3.48
Second target: 3.55
Third target: 3.63
Don't forget a simple principle: money management.
Place your stop-loss below the green support zone.
For any questions, please leave a comment.
Thank you.
ICP local trade for DecemberAfter the October 10 drop, ICP has recovered quite nicely! Showing growth from below $2 all the way up to nearly $10! BINANCE:ICPUSDT
Friendly reminder: Taking 50% profits (i.e., withdrawing your initial investment from the market) to leave the rest as "free" coins has never been a mistake!
Always calculate your risks and any possible outcomes after a rally!
We pulled back pretty quickly, and the buy line of the take-profit indicator is now sitting right at the marked levels! That same level lines up with the monthly open and could serve as a solid accumulation zone for the asset at the start of December!
The take-profit line from the same indicator is marked on the chart!
I'm expecting the direction to push back up toward a test of the yearly open!
In case of another dip, I'll be eyeing the 50% wick overlap level for adding spot positions! Everything else is pure speculation on futures plays!
Thanks for support

#ICP/USDT Ready for a Breakout — Double Digits Possible#ICP
The price is moving in a descending channel on the 1-hour timeframe. It has reached the lower boundary and is heading towards breaking above it, with a retest of the upper boundary expected.
We have a downtrend on the RSI indicator, which has reached near the lower boundary, and an upward rebound is expected.
There is a key support zone in green at 4.04. The price has bounced from this zone multiple times and is expected to bounce again.
We have a trend towards consolidation above the 100-period moving average, as we are moving close to it, which supports the upward movement.
Entry price: 4.12
First target: 4.22
Second target: 4.37
Third target: 4.55
Don't forget a simple money management rule:
Place your stop-loss order below the green support zone.
Once you reach the first target, save some money and then change your stop-loss order to an entry order.
For any questions, please leave a comment.
Thank you.

#ICP/USDT Ready for a Breakout — Double Digits Possible#ICP
The price is moving within an ascending channel on the 1-hour timeframe and is adhering to it well. It is poised to break out strongly and retest the channel.
We have a downtrend line on the RSI indicator that is about to break and retest, which supports the upward move.
There is a key support zone in green at the 4.90 price, representing a strong support point.
We have a trend of consolidation above the 100-period moving average.
Entry price: 5.05
First target: 5.20
Second target: 5.42
Third target: 5.70
Don't forget a simple money management tip:
Place your stop-loss order below the green support zone.
Once you reach the first target, save some money and then change your stop-loss order to an entry order.
For any questions, please leave a comment.
Thank you.

ICP range boundICP had a strong bounce off the 5.75 low and looks to be range bound between ~$5.75 and ~$6.60. It's experiencing some short term downtrend pressure at the moment, but should be moving towards high of $6.60 if the range holds.
Which way will the range break? Time Will tell.
ICPUSDT Forming Bullish MomentumICP/USDT (Internet Computer) is flashing strong bullish momentum and is worth paying close attention to. The token recently broke out of a consolidation phase and is now trading around the $6.00 mark, with a 24-hour trading volume that remains elevated and a market cap above $3 billion. This surge has been supported by a wave of speculation around AI integration and ecosystem upgrades, which is fueling renewed investor interest and search volume across social and trading platforms.
From a fundamentals angle, ICP is positioning itself as a next-gen blockchain that can host full-stack applications entirely on-chain, with claims of zero gas fees for users, 1-second finality, and true decentralised internet infrastructure. These are high-search keywords right now under the broader theme of Web3 infrastructure and AI plus blockchain convergence. Recent platform announcements include a new tool called Caffeine for easy dApp creation, and partnerships with cloud-tech names, which are helping to re-accelerate its narrative.
Technically, the break above key resistance near the $5.50-$6.00 zone and the retention of that level as support is a positive sign. If ICP holds above that breakout level and volume continues to climb, the next leg up could move toward the $8.00-$10.00 region or higher. Risk-reward appears favourable given the setup, but of course traders will need to monitor for confirmation and manage stops below the breakout level or recent support to protect downside.
In summary, ICP/USDT is combining structural breakout behaviour, significant fundamental updates, and improved market participation. For traders looking for a crypto with both narrative strength and technical alignment, this one ticks multiple boxes.

ICP — Golden Pocket Retest: Reversal or Continuation Down?After a long period of accumulation followed by an extreme capitulation phase, ICP is finally showing signs of life again. The recent sharp rally managed to break through several mid-term supply levels, but now the price is retesting the most critical zone on the chart — the Fibonacci Golden Pocket (0.5–0.618) range between $5.26–$5.98.
This yellow box is not just another technical bounce zone — it’s the decisive point for ICP’s mid-term direction:
will ICP continue its recovery toward the former distribution area at $9.20 to $14.70,
or will it fall back into the depths below $2.00?
---
Structure & Pattern
Phase 1: Sideways Accumulation (Early 2025)
The price moved sideways for months — a strong sign of silent accumulation by larger players.
Phase 2: Capitulation & Sharp Recovery
A deep breakdown followed by a vertical spike toward $15.58 shows a massive liquidity sweep — stop-losses were cleared out, and the market reacted with a relief rally.
Phase 3: Golden Pocket Retest (Now)
The price is retracing in a controlled manner back into the $5–$6 zone, now serving as a key confluence of horizontal structure and Fibonacci support.
---
Bullish Scenario (Potential Reversal)
If the price can hold the $5–$6 zone and form a strong 2D candle closing above $6.50–$7.20, a new Higher Low structure will be confirmed — signaling the possibility of the next bullish leg.
Confirmation: Break & Retest above $7.20
Targets:
Target 1 → $9.20 (minor supply zone)
Target 2 → $14.70 (major resistance & previous high)
Momentum Clues: Increasing volume on green candles and a developing bullish RSI divergence.
This could mark the beginning of a mid-term reversal for ICP, with potential upside exceeding +140% from the current price (~$6.07).
---
Bearish Scenario (Rejection Case)
However, if the Golden Pocket fails to hold and a 2D close below $5.00 occurs, the entire rally may turn out to be nothing more than a dead cat bounce.
In this case, ICP risks continuing its decline toward:
First support: $3.00
Major support: $1.80 (historical low and liquidity base)
A confirmed breakdown below $5.00 would indicate that the market structure remains fully under sellers’ control.
---
Conclusion
The $5.0–$6.0 range is the most decisive level for the coming months.
If it holds and forms a higher low, ICP may enter a new bullish cycle — but if it breaks down, a new distribution phase could begin.
📊 The golden pocket will decide the next chapter: is this the start of ICP’s rebirth, or just another bounce before another collapse?
---
Trading Plan
Aggressive Entry: Buy between 5.3–6.0, SL < 4.8
Conservative Entry: Wait for a Break & Retest above 7.20
Take Profit Targets: 9.20 → 14.70
Bullish Invalidation: 2D Close below 5.0
---
#ICP #ICPUSDT #CryptoAnalysis #GoldenPocket #Fibonacci #PriceAction #CryptoReversal #AltcoinSeason #TechnicalAnalysis #CryptoBreakout #MarketStructure

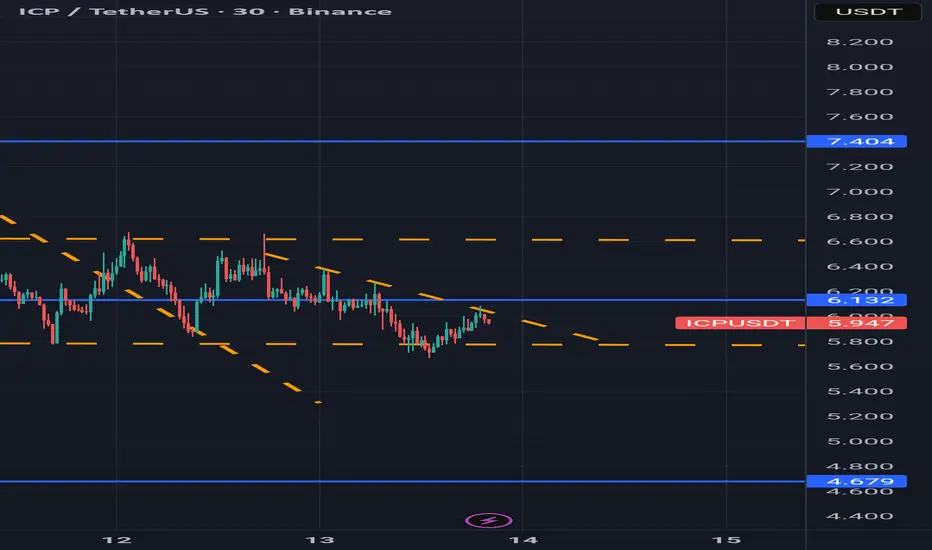
ICP @ 50% retracement ICP is at the 50% Fib retracement (~$6.15) from the November 7 high. If a floor forms here, then a potential rise in pricing could happen, potentially seeking previous highs ~$10. Failure to hold could see ~$5.20-4.70 support.
Solid floor here could be a buy signal. Failure to hold means further drop to old support.

ICPUSDT - many positive indicators!The coin ICP has pumped nearly 160% in just one week, and believe it or not — all that move happened without even breaking out of the accumulation range it’s been forming for over 275 days.
So imagine what will happen once it finally breaks out!
The high volume and bullish indicators on the chart suggest that this coin’s minimum target is around $30, meaning roughly a 5x potential from the current level.
It has already broken above the 0.618 Fibonacci resistance, broken the main trendline (marked in blue), and even formed a Golden Cross pattern.
It’s still inside the accumulation zone for now, so this is your early entry opportunity — because once it breaks out, you won’t catch it again.
Mark my words.
Best Regards:
Ceciliones🎯

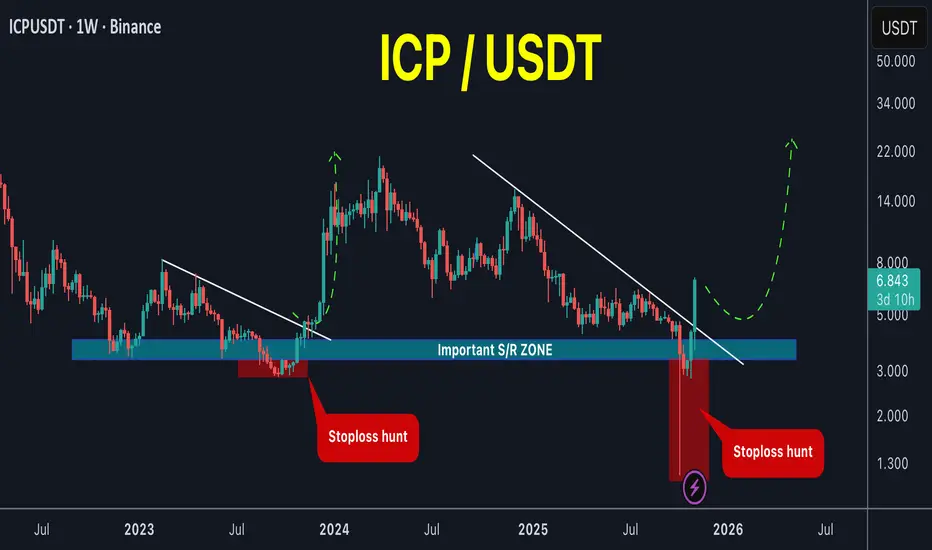
ICP wakes up from the dead!#ICP / USDT
After being useless for several months this coin made a similar movements like the one in late 2023
Price dropped below the most important S/R zone in chart taking the liquidity and after that massive volume started to enter the coin
Such movement in late 2023 ends up in X5 increase in its price in next months (after restoring the S/R)… price can make the similar movement here … ICP is waking up from the dead !
ICPUSDT - BUY OPPORTUNITYI predicted Solana to achieve its ATH when it was trending bearish and markets where in complete negative sentiment towards Solana, none the less, my Solana outlook and price forecast was based on the blockchain, its usability, and TPS etc. It hit through all the TP areas and is now fully trading at its fair value, and still growing...
Now I am back with my updated outlook on Internet Computer Protocol (ICP). This blockchain is by far the most advance and powerful blockchain I have come across and know. Literally nothing comes close to it. I have done my own thorough research and can honestly say, this blockchain is literally a steal at current market value. In fact I am in complete disbelief and amazed how this blockchain is not in the TOP 5, when compared to other blockchains out there, who don't offer any real value, and or utility but rather just a mere copy tokens, of ETH etc most cant even host a single bite size image on their blockchain. Yes even Solana can not compete with the tech of ICP. ICP is a super-powerful blockchain, that can host anything including Ai fully on-chain. YES Fully On-Chain.
The introduction of Caffeine Ai > sovereign self-writing apps, self writing internet etc You can find more about this on ICP or follow Dom on X @ DOMINIC_W
Caffeine Ai could bring a lot of Devs over, possibility of anyone becoming a Dev through Caffeine Ai, buildings Apps that will generate income, burn cycles on ICP, catalyst for ICP growth and value etc
The scale at which ICP can exponentially grow from there, with mass adoption can far exceed market cap of Solana and many other blockchains. In my opinion, its far more superior than ETH. It is the only true Ai Blockchain which can host Apps fully on-chain etc immune to tampering, hacks etc A full scale IT stack that can engineer Apps, rewrite the internet all within ICP Blockchain.
It will recover, and gain its true value, at least 3 digits, potentially 4. (I am not financial advisor, Pls DYOR).
The ICP launch was heavily manipulated , it posed a threat to other blockchains, big techs etc however the TEAM at ICP continues to deliver (biggest R&D in crypto space), work and progress ICP. Its only a matter of time, ICP will be MASSIVE n people will wake up to its true reality and what it offers!
Todays price will be Historical!!! Yes I have added more ICP with this Dip. DCA is a powerful strategy ;) Thanks for the Dip - I call it the Winter Sale.
Lets see where ICP leads from here now!
I am holding strong, Diamond!
Oh, if you have come this far, Don't forget BOB on ICP - An interesting one to watch out for!!! just saying ;)
Pls DYOR - I am not Financial Advisor. Crypto is highly volatile!
Trade Safe Habibis

Internet Computer ($ICP) Set For 300% Surge Amidst Falling WedgeThe price of the notable altcoin -Internet Computer ( CRYPTOCAP:ICP ) is gearing for 300% surge after breaking out of a falling wedge pattern constituting to a 40% breakout today.
The asset has been on a falling wedge for long oscillating between the $4- $5 region. present market metrics points to a bullish continuation pattern with eyes on the $20 resistant.
As of the time of writing the asset is up 33.% with a 4 hour RSI of 80 albeit bullish, connotes a temporary pullback before the spike in price.
In another event, Internet Computer Launches Self-Writing Caffeine AI Platform.
The launch signifies a leap towards decentralized self-written applications, invigorating ICP’s market with a 4% increase, underscoring significant shifts in blockchain technology infrastructure.
About Internet Computer
The Internet Computer blockchain incorporates a radical rethink of blockchain design, powered by innovations in cryptography. It provides the first “World Computer” blockchain that can be used to build almost any online system or service, including demanding web social media, without need for traditional IT such as cloud computing services. As such it can enable full end-to-end decentralization.

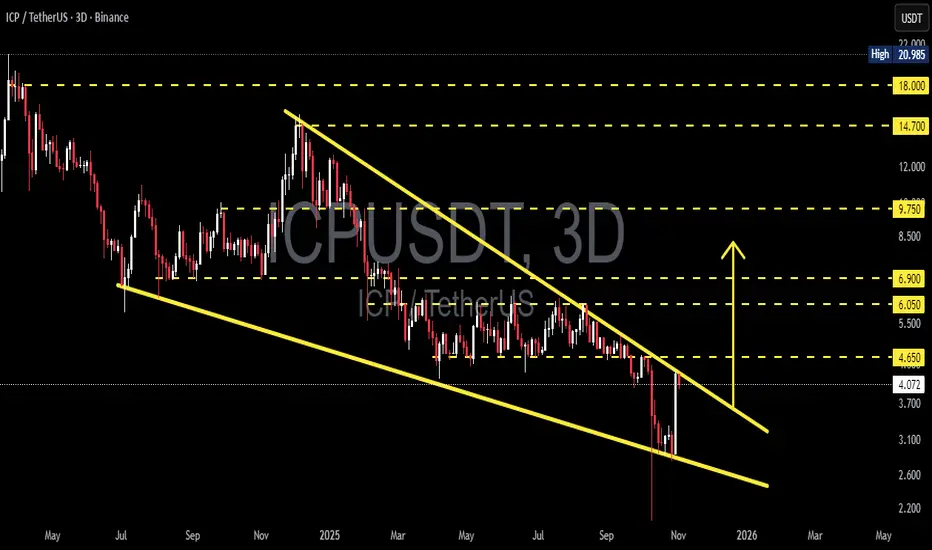
ICPUSDT – Major Reversal Setup Forming! Ready for Breakout Move?The ICP/USDT chart is currently displaying a highly critical structure as price continues to compress within a Falling Wedge pattern that has been developing since early 2025.
This formation is often seen as a bullish reversal signal — typically marking the end of a prolonged downtrend and the start of an accumulation or reversal phase.
At the current price level around $4.09, selling pressure has started to weaken, while buying pressure is gradually building up. Price is reacting positively from the lower wedge boundary and is now challenging the upper trendline resistance.
A confirmed breakout above this zone, especially with strong volume, could spark a major bullish momentum — opening the door for a move toward the next resistance targets at $4.65, $6.05, and $6.90.
However, if the price faces rejection once again from the upper wedge boundary, consolidation or another retest of the $3.10–$2.60 support zone remains possible.
This area marks a decisive moment for ICP’s mid-term direction.
---
Pattern Description
A clear Falling Wedge (Bullish Reversal Pattern) is visible through two downward-sloping and converging trendlines.
Key characteristics: lower lows are slowing down, highs continue to descend, and trading volume decreases over time.
Technical implication: selling pressure is fading, and accumulation is likely occurring before a potential reversal.
---
Bullish Scenario
A confirmed bullish breakout would occur once the price closes decisively above the upper wedge line and the $4.65 resistance on the 3-day timeframe, accompanied by a surge in trading volume.
If validated, upside targets could include:
Target 1: $6.05 (initial resistance and profit-taking area)
Target 2: $6.90 (mid-range wedge resistance)
Target 3: $9.75 (major resistance zone and possible momentum expansion)**
Breakouts from large falling wedges on higher timeframes often trigger strong mid- to long-term reversals, particularly when supported by high volume.
---
Bearish Scenario
If the breakout attempt fails and price gets rejected around the $4.65–$4.80 region, selling pressure could drag ICP back down toward the $3.10 – $2.60 support zone.
A breakdown below this area would invalidate the bullish setup and likely resume the macro bearish trend.
The $3.10 level is the key structural support — losing it would confirm renewed weakness.
---
Overall Outlook
ICP is currently at a make-or-break level, where a confirmed breakout could shift market sentiment from bearish to neutral–bullish.
The technical structure favors a potential trend reversal, but confirmation is crucial before positioning aggressively.
False breakouts remain possible, so risk management and patience are essential.
Psychologically, reclaiming $4.65 would be the first sign of a sentiment shift, potentially leading to renewed investor confidence in ICP’s mid-term recovery.
---
Summary
Pattern: Falling Wedge (Bullish Reversal Pattern)
Status: Approaching breakout area
Bullish Trigger Zone: Above $4.65
Bullish Targets: $6.05 → $6.90 → $9.75
Critical Support Zone: $3.10 – $2.60
Dominant Bias: Neutral turning bullish upon breakout confirmation
---
#ICP #ICPUSDT #ICPTether #CryptoAnalysis #TechnicalAnalysis #FallingWedge #ReversalPattern #BreakoutSetup #SwingTrade #CryptoChart #AltcoinWatch #MarketStructure
My point of view for ICPDear Follower
I got a multi request to analyze ICP
I see ICP most likely will hit $45 as a final target
I recommend liquidate 50% of your fund at that price then start use a trilling stop under each last new bottom for the rest of the fund
Good luck everyone

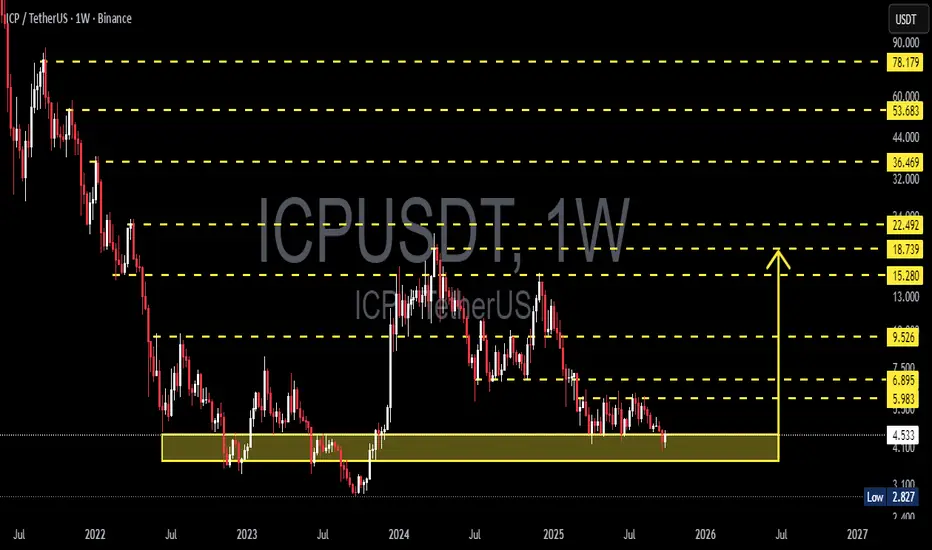
ICPUSDT — Retesting Demand Zone: Capitulation or Major Reversal?Weekly Overview
Internet Computer (ICP) is now entering a critical test phase at its long-standing historical demand zone between 2.80 and 4.53 USDT — an area that has repeatedly acted as the last line of defense for buyers since mid-2022.
This zone is not just another technical level. It represents a multi-year accumulation range where institutional money has historically shown interest, triggering two major reversals in the past (early 2023 and early 2024).
Now, the market is testing it for the third time, and the outcome of this retest may decide ICP’s direction for the next several months — or even years.
---
Structure and Pattern Context
Since its peak in 2021, ICP has been in a long-term structural downtrend, forming a sequence of consistent lower highs.
However, it’s also built a horizontal accumulation base below 5 USDT.
The 2.80–4.53 zone acts as a compressed demand layer, where selling pressure weakens every time this range is revisited.
On the weekly timeframe, recent candles show:
Smaller body sizes,
Long lower wicks,
And declining bearish volume — clear signs of seller exhaustion.
In short, the market stands at a crossroads between “the final breakdown” and “the birth of a long-term reversal.”
---
Bullish Scenario — Potential Reversal Phase
If this demand zone holds once again, ICP could enter a medium-term reversal cycle.
Here’s what would confirm a bullish structure shift:
1. Bullish Reversal Candle — a weekly engulfing, hammer, or morning star pattern appearing inside 2.80–4.53.
2. Volume Confirmation — a noticeable increase in bullish volume, signaling smart money accumulation.
3. Structure Break — a successful weekly close above 5.98 USDT, forming a new higher high.
If these confirmations occur, ICP could initiate a gradual expansion phase toward key resistance targets:
Target 1: 5.98 USDT – structure validation
Target 2: 6.90 USDT – breakout confirmation
Target 3: 9.53 USDT – major swing resistance
Mid-term target: 15.28–18.73 USDT if momentum persists
Each step upward will depend on overall crypto sentiment and volume strength across the market.
---
Bearish Scenario — Breakdown & Capitulation Risk
If bearish pressure continues and ICP closes a weekly candle below 2.80, the accumulation base built over the last two years would become invalidated.
Such a breakdown could trigger final capitulation, characterized by panic selling and heavy volume.
Below 2.80, there’s no major historical support, meaning the price could enter a free-fall zone toward 2.00 or lower before stabilizing.
Ironically, such capitulation events often mark the true bottom of a cycle — a classic pattern seen before every major crypto bull run.
---
Structural Perspective — End of the Downtrend?
Some longer-term signals suggest ICP may be approaching trend exhaustion:
Weekly RSI has remained in oversold territory for a prolonged time, while price fails to make new lows — indicating bullish divergence.
Major distribution phases occurred between 2022–2023, implying most selling pressure is likely done.
Price action resembles a late-stage accumulation phase, where smart money prepares for long-term positions (12–24 months ahead).
If this demand holds, the 2.80–4.53 range could become ICP’s legendary bottom, much like ETH’s 2020 base or ADA’s 2020–2021 accumulation.
---
Conclusion
ICP stands at a make-or-break point — the most decisive level it has seen in two years.
Holding 2.80–4.53 → opens the door for a potential major reversal.
Breaking below 2.80 → signals a final capitulation phase before a new cycle emerges.
Until proven otherwise, the reaction and weekly close inside this demand zone remain the key factor to watch.
As long as 2.80 holds, the bullish probability still exists.
#ICP #ICPUSDT #InternetComputer #Crypto #TechnicalAnalysis #PriceAction #DemandZone #SwingTrade #CryptoMarket #WeeklyChart #ReversalSetup #CryptoTA #Accumulation
ICP: False Break, Bullish Reversal in PlaySince the low from early April, ICP has traded within a well-defined range between $4.5 and $6.0.
Recently, the price broke below the range support, reaching as low as $4.0, but this move lacked follow-through. Instead, ICP quickly rebounded — a classic false break signal.
This rebound also resulted in a break above the descending trendline that started in mid-August, giving the chart a decisively bullish tone.
At this stage, all signals point toward further upside continuation, with the upper boundary near $6.0 as the first natural target.
However, considering that false breaks in one direction often lead to real breaks in the opposite, there’s a strong possibility that ICP could break above $6.0 in the medium term, potentially accelerating toward the key $10.0 zone.
________________________________________
✅ Key Takeaways:
• Range: $4.5 – $6.0
• False break below $4.0 reversed quickly
• Trendline from August broken to the upside
• Bullish outlook → targets $6.0 and possibly $10.0

ICPUSD – Trading the Range with PrecisionSince December last year, ICP has been in a persistent downtrend, sliding from 15 USD to below 5 USD. Sellers have clearly dominated the longer-term picture.
However, after establishing April’s low, the market transitioned into a well-defined sideways range between 4.5 and 6.2 USD. This type of consolidation after a heavy decline often signals a pause – and can present trading opportunities within the boundaries.
Right now, ICPUSD is once again testing the bottom of this range near 4.5. From a tactical perspective, this creates a favorable setup: by entering long positions at the range low, we can aim for the upper boundary with a 1:3.5 risk-to-reward ratio.
Trading Plan:
• ✅ Favor long positions near 4.5 USD
• 🛑 Place a tight stop-loss just below range support
• 🎯 First target: 6.0 – 6.2 USD, the upper range resistance
Conclusion: Until ICPUSD breaks decisively below support, the range remains intact. I favor buying dips with disciplined risk management, targeting the 6 USD area for a clean swing trade setup. 🚀

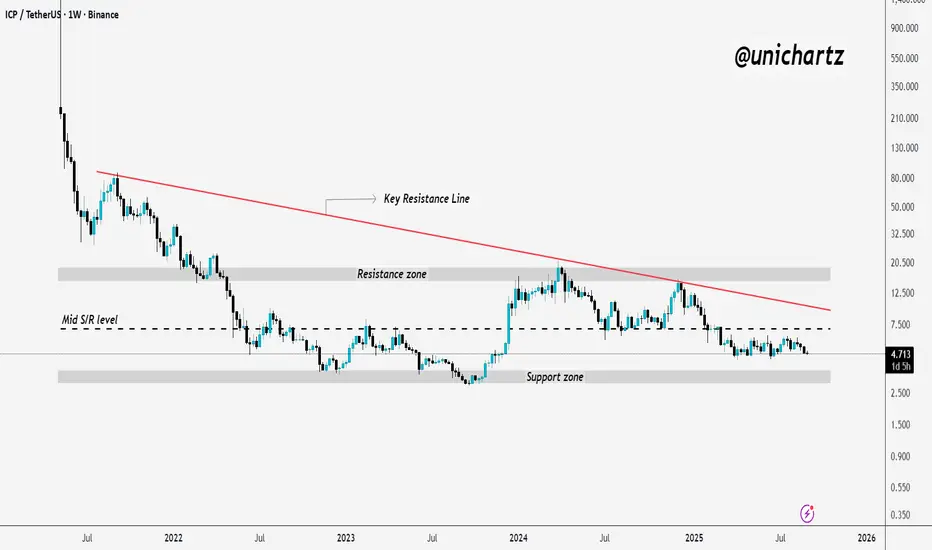
ICP Chart Update: Bearish Bias Until Proven OtherwiseFWB:ICP has been stuck in a long downtrend and still hasn’t managed to break past its resistance. Right now it’s sitting near a key support zone, where buyers need to show up if there’s going to be any bounce toward higher levels.
If that support cracks, more downside is likely. For the moment, the chart leans bearish, so it’s better to stay patient until real strength shows.
DYOR, NFA
ICP/USDT — Major Demand Zone Retest: Rebound or Breakdown Ahead?At the moment, ICP is standing at a very critical crossroads. The weekly chart shows the price retesting the historical demand zone around $4.10 – $4.79. This area has repeatedly acted as a strong accumulation base in the past, triggering significant rallies. However, the more often this zone gets tested without a breakout to the upside, the higher the risk of a breakdown.
---
🔎 Key Technical Structure
1. Long-Term Trend: ICP remains in a broad downtrend since launch, with failed mid-term rallies along the way.
2. Demand Zone $4.1 – $4.8: A psychological and historical support area, holding the price since 2022.
3. Layered Resistances: Key levels to watch are $5.98, $6.90, $9.53, followed by $15.28, $18.74, and $22.49. Breaking through these would confirm a larger bullish reversal.
4. Final Support Below: If breakdown occurs, the next major level sits at $2.827 — a historical low.
---
📈 Bullish Scenario
Validation: A strong weekly bullish close within or above $4.1–$4.8, supported by rising volume, would signal potential accumulation.
Short-Term Target: $5.98 – $6.90 → reclaiming this range could push ICP toward $9.53.
Mid-Term Target: If momentum continues, ICP could revisit $15.28 – $18.74, and even $22.49.
Potential Pattern: A double bottom / W pattern would form if price closes above the $6.9 neckline.
---
📉 Bearish Scenario
Breakdown Confirmation: A weekly close below $4.10 = strong bearish continuation signal.
Downside Target: Price may slide toward $2.827 (historical low).
Seller Dominance: A breakdown with rising sell volume would confirm extended bearish control.
Risk Factor: Losing this demand zone would likely extend ICP’s bear cycle significantly.
---
📊 Price Action & Patterns
Sideways Range in Demand Zone: Currently, price is moving sideways within demand → this is a classic setup for accumulation or distribution.
Breakout Above: Signals accumulation → start of a potential uptrend.
Breakdown Below: Signals distribution → likely deeper decline.
---
⚖️ Conclusion
ICP is at a make-or-break zone:
Holding above $4.1–$4.8 could spark a strong reversal rally back toward $6.9 – $9.5, with higher targets possible.
A breakdown below $4.1 would expose ICP to a retest of the $2.8 low, keeping the long-term bearish structure intact.
📌 For traders, this is the time to wait for weekly candle confirmation & volume before committing.
📌 For long-term investors, this zone offers a high-risk but high-reward accumulation area — strict stop losses are essential.
---
#ICP #ICPUSDT #CryptoAnalysis #WeeklyChart #SupportResistance #TechnicalAnalysis #SwingTrading #Altcoins #CryptoStrategy

Bullish Setup: ICP Eyes 70% Gain if Resistance BreaksAfter the strong drop that started in December last year — a move of almost 70%, from 15.5 down to around 4 — ICP entered a 4-month consolidation/accumulation phase.
The range is well defined:
• Support: around 4.5
• Resistance: slightly above 6
With Total3 showing a bullish outlook, there’s a high probability that ICP will finally break above 6 and accelerate towards the 10 USD key zone.
That would mean roughly a 70% upside, and with a 1:3 risk-to-reward ratio, this setup deserves your attention.
📌 Plan : Watch for a confirmed breakout above 6 and manage risk according to your trading rules.
🚀

ICP Closing in on Major Resistance – Eyes on Retest ZoneIf $ICP/USDT breaks above the marked resistance and successfully retests the zone, we could see a strong move to the upside.
It’s shaping up well — keep it on your radar.
DYOR, NFA

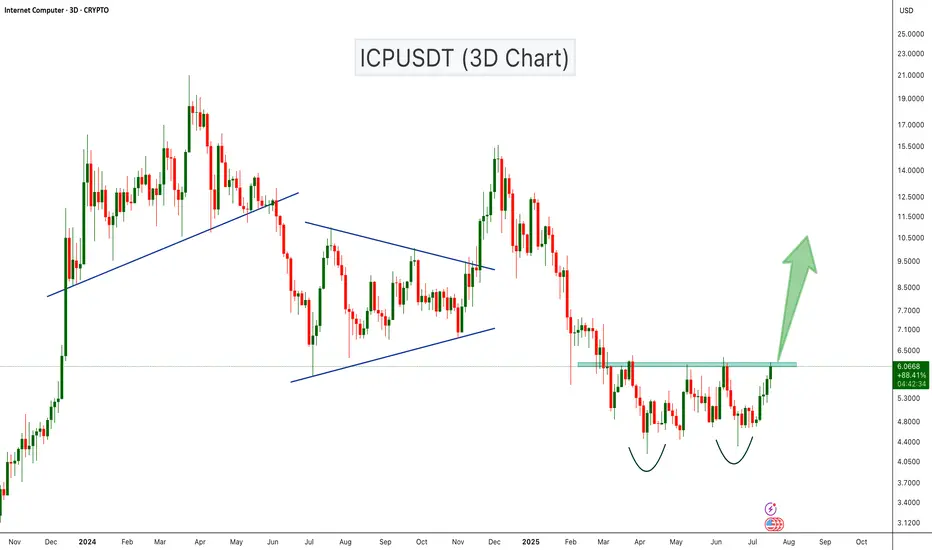
ICPUSDT Double Bottom Breakout Loading?ICPUSDT is showing a strong bullish setup with a classic double bottom pattern forming on the 3-day chart. The price has tested the support zone twice and is now approaching the neckline resistance around the $6.10 level. A confirmed breakout above this resistance could trigger a strong bullish move toward the next key resistance levels near $9.50 and $15.
Cheers
Hexa