LiamTrading – XAUUSD H1 | Monday Scenario LiamTrading – XAUUSD H1 | Monday Scenario
Wait for gold to retest the upper trendline before choosing a direction
Quick Overview
On the H1 chart, gold is still oscillating within a triangle pattern with a descending upper trendline and a gradually rising lower trendline. In my opinion, the price still needs an upward move to retest the upper trendline – coinciding with the FVG + POC Volume Profile area – before deciding to create a new trend (either breaking upwards or continuing to decline).
Regarding the USD, many Fed officials have started signaling a potential rate cut, but remain very cautious. UBS and Barclays both lean towards the scenario of the Fed cutting rates in December if upcoming data continues to be weak. This makes it difficult for the USD to break out too strongly, creating room for gold to technically rebound to resistance areas.
Technical Analysis H1
Current structure: price is moving sideways accumulating, with lower highs following the descending trendline, and lows supported by the lower trendline.
Area 4079–4081:
FVG + POC Volume Profile.
Coinciding with the upper trendline → a very strong resistance convergence area, suitable for a sell scenario based on reaction.
Nearest support area: around 4040–4035; if this area breaks, the likelihood of the price returning to test 4010–4000 is quite high.
A clear bullish reversal signal is only evident if the Dow structure increases again, at least when the price breaks above and holds above 4061 and then surpasses the descending trendline.
Reference Trading Scenario
Sell at FVG + POC + trendline (priority)
Entry: 4079–4081
SL: 4086
TP: 4060 → 4045 → 4010
Logic: The price is expected to be pushed up to fill the FVG and touch the POC/trendline before sellers return. This area converges many technical factors, so the win rate is better compared to selling in the middle of the sideways range.
Buy when the bullish structure is confirmed
Condition: price breaks above 4061 and closes the H1 candle holding above this area, while also escaping the descending trendline.
Reference Entry: 4061–4068 (retest the breakout area)
SL: 4050
TP: 4095 → 4130 → 4150
At that point, the triangle pattern is broken upwards, the Dow increase returns, prioritizing buying according to the new trend instead of trying to sell the top.
Trading Notes
Areas for short scalping: 4060, 4040, 4010, 4130 – always wait for clear candle reactions on M5–M15 before entering orders.
Each order should only risk 0.5–1% of the account; when the order reaches about 1R, move SL to breakeven to protect capital.
If you have a different scenario for XAUUSD H1 today, leave a comment and follow the LiamTrading channel to update the daily gold plan on TradingView.
Ictconcepts

LiamTrading – XAUUSD H1 | Gold breaks upward trend, short...LiamTrading – XAUUSD H1 | Gold breaks upward trend, short-term decline prevails
Gold has dropped more than $20 in a short time, down over 1% on the day and is approaching the area below 4,030. The previous upward structure has officially been broken, 4040 can no longer hold, today's focus continues to be on selling according to the trend until the support area 4000–398x shows a clear reaction.
Macro Analysis
Gold prices fall simultaneously with weakening expectations of a December rate cut: JPMorgan no longer forecasts the Fed will cut rates in December, unlike the previous scenario of a 25 bps cut.
Some other organizations still believe that rising unemployment and weak economic data may force the Fed to cut rates by 25 bps in the next meeting.
The market is pricing the possibility of a December rate cut at nearly "50–50", creating significant uncertainty and putting short-term pressure on gold, although in the long term it still benefits if the rate cut cycle occurs.
Technical Analysis H1 – Declining structure, price channel, and support area
After breaking 4040, the price creates a series of Lower High – Lower Low, confirming the Dow declining structure on H1.
A falling channel is forming; the upper boundary of the channel coincides with the short-term resistance area 4050–4060.
Area 4000: important psychological bottom. If decisively broken, the medium-term structure may shift to a deeper correction phase.
Buy zone 3987–3989:
Strong support confluence + Fibonacci extension area (1.618/2.272) of the current decline.
Optimal area to watch for a rebound if there is a clear reversal signal.
Main resistance of the day:
4052–4054: retest area of old support + upper boundary of the falling channel → suitable for a sell rebound scenario.
Today's Trading Scenario (LiamTrading)
Scenario 1 – SELL according to the downtrend (priority)
Entry: 4052–4054
SL: 4060
TP: 4030 → 4015 → 3990
Logic: Price rebounds to resistance area + upper boundary of the falling channel, suitable to continue selling according to the trend. Priority when M15 shows rejection candles (pin bar/bearish engulfing) around 405x.
Scenario 2 – BUY at strong support area 398x (catching the rebound)
Entry: 3987–3989
SL: 3980
TP: 3999 → 4014 → 4040 → 4080
Logic: Area 398x is a strong support confluence; only activate when there is a clear price reaction (long lower wick, reversal pattern on M15–H1). This is a counter-trend order, so reduce volume and take partial profits.
Note risks and invalidation
H1 closes above 4060: short-term declining structure weakens, need to pause all sell orders and reassess.
H1 closes below 3980: buy zone fails, risk of further decline to lower areas; at this point, only prioritize selling.
Always keep risk per order at 0.5–1% of the account, reaching about +1R should move SL to breakeven.
Are you leaning towards continuing to sell according to the trend or waiting to catch the bottom at 398x? Leave a comment and follow LiamTrading channel on TradingView for daily XAUUSD updates.

XAUUSD–FRIDAY BEFORE PMI: MAINTAINING HEAD AND SHOULDERS PATTERN💛 XAUUSD – FRIDAY BEFORE PMI: MAINTAINING HEAD AND SHOULDERS PATTERN, WAITING TO BREAK RANGE 4132–3998 🎯
🌤 1. Overview
Hello everyone, it's Lana here again 💬
Today is the last Friday of the week, the market is waiting for PMI and preparing to enter a phase with a lot of important data in December.
Meanwhile, BTC has been rising faster than XAU in recent weeks, indicating that speculative money is leaning towards crypto, while gold is temporarily moving sideways accumulating.
The US Department of Labor will release the November employment report on December 16, which is 6 days after the December Fed meeting. In other words, the Fed is in a "blackout" state regarding labor data for nearly another month – this forces the market to price in advance, making gold's volatility range wide but lacking a clear trend.
💹 2. Technical Analysis – Range & Head and Shoulders Pattern
On the H3/H4 frame, gold is fluctuating within the large range of 4132 – 3998.
The price wave is gradually narrowing towards the end of the triangle, represented by:
Lower highs,
Higher lows,
→ When one of the two boundaries is broken, a new trend is likely to explode in the direction of the breakout.
The inverse Head – Shoulders – Head pattern has not been broken:
Left shoulder – Head – Right shoulder are all above the rising trendline.
For the final wave of the pattern to follow the rhythm, the price needs to confirm surpassing 4109:
When closing a candle above 4109, the short-term uptrend is confirmed,
At that point, gold can aim for higher liquidity areas such as 4132 → 4145 → 4200.
Conversely, if gold breaks 3998, this will be both:
breaking the range bottom,
and negating the Head and Shoulders pattern,
→ opening the possibility of a deeper decline to the 3960–3920 area.
🎯 3. Reference Trading Scenarios
💖 BUY Scenario – following the pattern & range bottom support
1️⃣ Buy at support 3998–4000
Entry: 3998–4000
SL: below 3990 (depending on risk management)
TP: 4025 → 4040 → 4078
2️⃣ Buy when confirmed above 4109
Condition: Price closes a candle above 4109, confirming the Head and Shoulders pattern is maintained.
Entry: around 4100–4105
SL: 4090
TP: 4132 → 4145 → 4200
💢 SELL Scenario – trading the upper boundary of the range
Sell: 4130–4132
SL: 4138
TP: 4110 → 4095 → 4070 → 4045
Selling should only be considered as scalping against resistance within the range, not the main trend if the Head and Shoulders pattern is still valid.
⚠️ 4. Notes & Risk Management
Range 4132–3998 is still controlling the market:
Above 4109 → prioritize Buy according to the short-term uptrend.
Below 3998 → consider shifting bias to Sell following the breakout.
PMI, Fed expectations, and upcoming employment data may trigger unexpected volatility, therefore:
🌷Gold is at the intersection of technical patterns and macro stories 💛
Be patient and wait for reactions at 3998 and 4109, as these are the two key points that determine whether we enter a new upward wave or a deeper decline.
💛 Like – 💬 Comment – 🔔 Follow LanaM2 to follow gold with me every day ✨

LiamTrading – XAUUSD H1 | A bearish structure has formed...LiamTrading – XAUUSD H1 | A bearish structure has formed, waiting for confirmation signals in the European session
Overall, gold is in a corrective phase after the previous upward move. On H1, a clear Dow bearish structure (lower highs, lower lows) has formed, but the support area around 4,030 and the Fibonacci cluster below are still potential zones for a reversal buying force. Today's European session will be crucial to confirm: whether to continue a deep decline or bounce back according to the head and shoulders pattern forming on H4.
Macro – Fundamental Brief
The October Fed meeting minutes show a strong internal division:
One group opposes rate cuts, wanting to maintain the current level.
The other group supports cuts, even proposing further reductions in the December meeting.
This lack of consensus reflects a high degree of monetary policy uncertainty, keeping defensive capital flows interested in gold. In the long term, gold only surges when confidence in the financial system weakens – the peak gold price is not a sign of prosperity, but a warning signal.
Technical Analysis – H1 (trendline, Fibonacci, liquidity)
The price is fluctuating below the short-term descending trendline, confirming the bearish phase is still in effect.
The 4,082–4,090 zone is an “important liquidity zone” – where the price has reacted multiple times, currently acting as near resistance.
The 4,029–4,031 cluster is crucial support:
Coincides with technical support area + Fibonacci retracement level.
Start of a large FVG running down to the 3,985 zone (Fibo 1.618 + psychological support).
Above, the 4,129–4,130 zone is strong resistance (strong resistance on the chart); if the price surpasses and holds above this area, the Dow bearish structure will weaken significantly.
Trading Scenario Reference
BUY Scenario – buy at support / Fibonacci zone
Logic: Price holds above support – Fibonacci, bottom-fishing capital appears.
Entry BUY: 4,029–4,031
SL: 4,022
TP: 4,040 → 4,065 → 4,090 → 4,120
Only prioritize when the price reacts well at 4,029–4,031 (wick or clear reversal candle appears on M15–H1). If H1 closes below 4,022, this BUY scenario should be canceled.
SELL Scenario – follow the current bearish structure (prioritize when trendline is not broken)
Logic: Price retraces to retest resistance + descending trendline and is rejected.
Entry SELL: 4,098–4,100
SL: 4,105
TP: 4,088 → 4,070 → 4,035 → 4,000–3,985
Only enter when the price hits the 4,098–4,100 zone and a clear rejection signal appears (pin bar/bearish engulfing). If H1 closes above 4,105 and breaks the trendline, stop all sell orders and reassess the structure.
Notable Price Zones for Scalping
4,082 – 4,060 – 3,985 – 4,129
These zones can be used for short-term scalping based on price reactions, but reduce volume and close quickly.
Important Note
If the price is confirmed to close stably above the descending trendline and holds above the 4,090–4,100 zone, the priority will gradually shift to BUY setups, as a head and shoulders pattern (bullish reversal) is forming on H4.
Conversely, if the 4,029–4,022 support is decisively broken, gold is likely to continue falling towards the FVG and Fibonacci 1.618 zone around 3,985.
Which scenario are you leaning towards for gold today – retrace up to sell further or hold the bottom to bounce back? Leave a comment below the post and follow the LiamTrading channel for daily XAUUSD updates on TradingView.

XAUUSD – HEAD AND SHOULDERS PATTERN CLEARLY FORMED, CONTINUE ...💛 XAUUSD – HEAD AND SHOULDERS PATTERN CLEARLY FORMED, CONTINUE TO PRIORITIZE BUYING 🎯
🌤 1. Overview – Today's Picture
Hello everyone, it's Lana again 💬
In the Asian session this morning, gold has completed the right shoulder of the inverse Head and Shoulders pattern very clearly on the H3/H4 frame. Those who bought according to the previous scenario are currently in a favorable position, and in my opinion, this is still the time to hold the Buy order and prepare for additional opportunities if the market confirms the trend.
On the macro side, according to the FedWatch CME tool, the probability of the Fed cutting 25bp in December is only about 30–33%, while the likelihood of maintaining the interest rate still prevails. This prevents the USD from falling deeply, but at the same time, it is not strong enough to "suppress" gold – creating a strong fluctuation environment within the range, very suitable for trading according to technical patterns.
💹 2. Technical Analysis – Head and Shoulders Pattern & Price Structure
The inverse Head and Shoulders pattern has formed quite accurately:
Left shoulder → Head → Right shoulder all rest on the long-term upward trendline.
The bottom area around 4040–4050 is a liquidity box supporting the entire structure.
The neckline currently lies around the 4089–4090 area:
When the price breaks up and closes above 4089, we consider it a confirmation of a new upward trend.
After the breakout, gold can expand to the areas 4145 → 4200, where strong liquidity + FVG is concentrated above.
Area 4130–4132:
Is a large liquidity cluster – where short-term profit-taking & Sell orders are likely to appear.
Once this area is decisively broken, the likelihood of the price quickly bouncing to 4200 is quite high.
Area 4040:
Is both the bottom of the pattern and a key support.
The scenario will fail if gold closes the H4 candle below 4040, as the Head and Shoulders structure would be broken.
Overall, the price is compressing right below the neckline, and just a nice break can trigger the next upward wave.
🎯 3. Reference Trading Plan
💖 Main BUY Scenario – according to the pattern
1️⃣ Buy retracement to support
Entry: 4060–4063
SL: 4055
TP: 4088 → 4108 → 4130 → 4143 → 4200
2️⃣ Buy breakout neckline
Condition: Price breaks the downward trendline & neckline, closes above 4089.
Entry: around 4089–4092
SL: 4080
Reference TP: 4132 → 4145 → 4200
💢 Note on SELL
Currently, SELL is only against the pattern trend, not a priority scenario.
Only consider short Sell when:
Price reacts very strongly at 4132–4145,
And there is a clear reversal signal on M15–M30 (pin bar, bearish engulfing, increased selling volume).
⚠️ 4. Key Fundamental Factors to Watch
The probability of the Fed maintaining the interest rate is still high → the market is likely to "freeze" before the news, then explode with volatility.
During this period, gold is often sensitive to data: employment, inflation, Fed officials' speeches.
🌷 In summary, the inverse Head and Shoulders pattern on XAUUSD is supporting the upward scenario, as long as the price remains above 4040 💛
My strategy:
Prioritize Buy, first in the 4060–4063 area, then break 4089,
Closely monitor the 4132–4145 area – if broken, the opportunity to reach 4200 is very clear.
If you find the analysis useful, please 💛 Like – 💬 Comment – 🔔 Follow LanaM2 to update the gold perspective with me every day ✨

LiamTrading – XAUUSD H1 | Gold holds 0.618, prioritize ...💛 LiamTrading – XAUUSD H1 | Gold holds 0.618, prioritize bullish scenario for Wednesday 🎯
Gold continues to recover after the previous decline and is currently right at the 0.618 Fibonacci level on H1 – indicating that buyers still hold the advantage. The price is also clinging to the upward trendline and the thick Volume Profile area around 407x, so today I continue to prioritize the BUY scenario following the trend.
📰 Macro – news context
After the US government reopened, the market is preparing to receive a series of economic data today and tomorrow → USD and gold can both fluctuate strongly according to the news.
President Trump attacked Fed Chairman Powell, calling him "stupid and incompetent," expressing that he wanted to fire him immediately but was prevented by advisors.
👉 Therefore, market sentiment is quite sensitive: just a tilt towards a rate cut scenario in the data could further support gold.
📊 Technical – H1 with Fibonacci, Trendline & Volume Profile
Fibonacci 0.618: The price is at the 0.618 level of the most recent decline; if it holds above this level, the natural target will be the FVG area + resistance above 4120–4150.
Upward trendline H1: The trendline from the most recent bottom is supporting the price very well; each touch back to the trendline results in a rebound → this will be an ideal area to wait for a BUY.
Volume Profile & Liquidity:
Cluster 4075–4080 is the Buy Liquidity area – thick volume, many orders exchanged → very suitable as an entry point if the price retests.
VAL ~4040 and the Support + FVG area around 4020 are the next defense lines if the market is swept deeply.
Upside liquidity: The past FVG on H1 is still open to at least 4150, so if the bullish scenario succeeds, gold can fully extend to this area.
🎯 Reference trading scenario (LiamTrading)
1️⃣ BUY following the trend – main priority
Entry: 4078–4080 (retest trendline + strong volume cluster)
SL: 4073
TP: 4094 → 4120 → 4140 → 4175
💡 Note:
Wait for M5–M15 to have a nice reaction candle (long lower tail, pin bar, or bullish engulfing) around 4078–4080 before entering the order.
When the price moves ~1R, move SL to breakeven to protect the account.
2️⃣ Price area for short scalping
Support – quick buy: 4048 – 4023 (VAL + lower FVG area).
Resistance – quick sell: 4121 – 4151 (FVG + upper liquidity area).
This is just a scalping area, so:
Enter orders on small frames (M5–M15).
Close quickly, do not hold orders through strong news.
✅ Summary
Short-term trend: leaning towards bullish, as the price holds above the H1 trendline and the 0.618 area.
Main plan: wait for BUY 4078–4080, target direction 4120 → 4140 → 4175.
Do you think gold will go straight to 4150 today or will it be swept back to 404x first?
👉 Comment your perspective & Follow LiamTrading channel to receive daily XAUUSD plans on TradingView.

XAUUSD – HEAD AND SHOULDERS PATTERN FORMING ON H4💛 XAUUSD – HEAD AND SHOULDERS PATTERN FORMING ON H4 🎯
🌤 Overview
Hello everyone, it's Lana here again 💬
Gold, after a strong decline, is forming a clear Head and Shoulders structure on the H4 timeframe, following a long-term upward trendline. This pattern allows us to expect a rebound to the old peak area, but before that, the price may "dip" down to complete the structure.
💹 Technical Analysis (ICT Perspective)
The Left Shoulder – Head – Right Shoulder is gradually completing around the trendline + supporting FVG.
The area around the 50% Fibonacci above is a reasonable zone for the price to form the right shoulder, and if it breaks above the neckline, it could pave the way back to the strong liquidity area above 4200.
In the short term, the 4118–4120 area is both resistance + the neckline of the pattern, suitable for a technical Sell.
The 4040–4042 area coinciding with the trendline + OB is a nice support to watch for a Buy if the price adjusts deeply.
🎯 Reference Trading Plan
💢 SELL Scenario (scalping at resistance)
Sell 4118–4120 │ SL: 4125
TP: 4105 → 4086 → 4060 → 4040
💖 BUY Scenario (priority according to the pattern)
Buy 4042–4040 │ SL: 4034
TP: 4075 → 4090 → 4100 → 4140 → 4200
⚠️ Important Notes
Trading according to the pattern is just an expectation trade, so it should be combined with candle signals on smaller timeframes (M15–M30) before entering a trade.
The upcoming FOMC meeting and NFP report, after a prolonged US government shutdown, could lead to very unpredictable volatility.
Reduce volume, avoid holding large positions through major news events.
🌷 Conclusion with LanaM2
The Head and Shoulders pattern on H4 is opening up beautiful opportunities for both short Sell and Buy according to the larger trend 💛
Be patient and wait for the price to reach the marked areas, be disciplined with SL, and don't FOMO before the news.
If you find this useful, please 💛 Like – 💬 Comment – 🔔 Follow LanaM2 to update the gold perspective with me every day ✨

Bitcoin – A Gentle Slide Into A Strong ReactionBitcoin continues to trade inside a clean falling channel, moving lower in a controlled manner as it approaches a major support zone. The overall flow remains bearish in the short term, however the structure suggests we are nearing an area where a short term bullish reaction becomes highly probable. Momentum remains soft, but the market is clearly hunting liquidity beneath the channel, which aligns with the expectation of one more drive lower before a meaningful bounce forms.
Channel Structure And Liquidity Behavior
The descending channel is guiding price efficiently, with every lower high respecting the upper boundary and confirming that sellers are still in control for now. This controlled descent usually signals that the market is preparing for a sweep of the lows rather than a sudden break. As price presses toward the channel’s lower boundary and the highlighted support zone, liquidity becomes the focus. A sweep beneath the most recent lows is the type of inducement that often precedes a strong reversal.
Support Zone Reaction Expectations
The green support zone marked on the chart remains the key area of interest. It aligns with previous accumulation behaviour and prior reactive turning points, giving it weight as a zone where traders expect a bounce. Once price pierces into that zone, the probability of a short term bullish response is high. The ideal reaction would be a sharp rejection from the lows, followed by a move back into the body of the channel and a gradual push upward as the market begins absorbing sell orders.
Retest And First Resistance Layer
If the support holds and price bounces, the first significant obstacle will be the red resistance zone above. This area represents the first real test of whether buyers have the strength to absorb supply. A clean move into that zone, followed by a higher low, would confirm the shift in momentum and support the idea of a short term bullish continuation. Failure at this level would simply keep Bitcoin inside the same corrective structure.
Short Term Bullish Scenario
The most probable bullish path is simple: a liquidity sweep into the support zone, a strong rejection, a move back toward mid channel levels, and then a steady climb into the first resistance area. The market does not need to break any major structure immediately. A clean reaction from support is enough to anchor a short term bullish leg, even if the larger trend is still corrective.
Conclusion
Bitcoin is approaching the point where a short term bullish bounce becomes increasingly likely. The falling channel, the upcoming liquidity sweep, and the depth of the support zone all point to a reaction that should materialize soon. Patience remains important, as the bounce is expected only after the market completes its liquidity objective in the support area.
___________________________________
Thanks for your support!
If you found this idea helpful or learned something new, drop a like 👍 and leave a comment, I’d love to hear your thoughts! 🚀

LiamTrading – XAUUSD H1 | Gold on a downward trend, hitting...💛 LiamTrading – XAUUSD H1 | Gold on a downward trend, hitting strong support around 4005 🎯
Gold has plunged from its peak, currently “visiting” the 4005–3990 zone, where trendline + POC/OB + large liquidity converge. This is a zone with potential for a technical rebound, but the short-term trend remains bearish, so all BUY orders need clear confirmation.
🔍 Fundamental Analysis
Goldman Sachs forecasts that during 2025–2026, central banks will purchase an average of ~80 tons of gold per month, a significant driver that could propel gold towards $4,900/oz by the end of 2026.
This keeps the long-term trend for gold bullish, but in the short term, deep corrections like the current one are normal to “shake out” positions before big money returns.
📊 Technical Analysis
Current trend:
H1 is still in a short-term downtrend phase (lower high – lower low), with prices below the 4080–4100 resistance zone and the nearest descending trendline.
Main support zones:
4005–3990: intersection of long-term ascending trendline, POC – OB, old VAH/VAL zone → critical support, potential for bottom-fishing buying force.
3975–3977: deeper support, coinciding with liquidity zone & recent bottom.
Key resistance zones:
4098–4100: confluence of resistance + trendline test → prime zone to watch for SELL retracement.
Above is the cluster 4011 – 4053 – 4077 – 4098–4100 acting as “steps” for scalping orders.
Volume Profile:
Heavy trading volume around the 4000–4020 zone → prices tend to revisit this area multiple times before leaving.
🎯 Suggested Trading Scenarios
SELL – following the downtrend (priority)
Entry: 4098–4100
SL: 4105
TP: 4082 → 4060 → 4035 → 4012
Price retraces to resistance + descending trendline.
Only activate when M15–H1 shows clear rejection candles (pin bar/bearish engulfing) around 4098–4100.
BUY – catching the rebound at strong support
Entry: 3975–3977
SL: 3970
TP: 3995 → 4025 → 4050 → 4080
Confluence support zone at channel bottom + POC/OB + liquidity.
Only BUY with strong rejection or clear reversal pattern (M15–H1).
⚠️ Price zones to watch for scalping
4011 – 4053 – 4077 – 3939
These zones are suitable for short scalps, prioritizing the main trend (currently bearish), quick exits – do not hold positions too long.
🧠 Risks & Invalidation
H1 closes above 4105 → reduces SELL priority, wait for new structure.
H1 closes below 3970 → unfavorable structure for BUY side, potential for further decline to lower zones.
Are you watching to BUY or SELL gold in this zone?
👉 Comment your perspective & Follow LiamTrading channel for daily XAUUSD plans.

XAUUSD – TWO MAIN SCENARIOS FOR THE DAY: MONITOR REACTIONS ...💛 XAUUSD – TWO MAIN SCENARIOS FOR THE DAY: MONITOR REACTIONS AT THE TRENDLINE 🎯
🌤 1. Overview
Hello everyone 💬
Gold is currently waiting at the H4 trendline, indicating the market lacks the volume to decide the next direction.
Although the price is adjusting after the drop from the 4,400 USD region, the larger trend is still supported by strong buying flows from central banks.
💹 Market Context
According to Goldman Sachs, the current decline is only temporary, as the demand for gold as a safe haven asset continues to rise:
U.S. bond yields are decreasing
USD is weakening
The U.S. economy is under pressure from unemployment and inflation
In September alone, central banks purchased 64 tons of gold, and forecasts suggest that November may continue the strong accumulation trend.
💹 Technical Analysis
📉 If Gold breaks below the trendline → the market will trigger strong selling pressure, pulling back to the 395x region, where there is low liquidity and significant support.
📈 Conversely, if the price holds the trendline and volume pushes up, a short-term upward structure will form.
📌 The 4068 level is a key point — if the price retests this area and falls back, Buy is only activated when it returns to 4034.
🎯 Reference Trading Scenarios
🔻 SELL – When breaking the trendline (priority if volume is strong)
Sell 4036–4038 │ SL: 4044
TP: 4010 → 3995 → 3970 → 3945
🔹 BUY – Strong support 395x
Buy 3952–3954 │ SL: 3957
TP: 3975 → 3995 → 4030
🔸 BUY to maintain trend (if price rebounds at 4068)
Buy at 4034 after confirmation signal
⚠️ Important Note
Volume is low, the market can easily sweep stops, so enter trades with small volume.
The larger trend is still supported by central bank flows, but in the short term, Gold can fluctuate strongly around the trendline.
Prioritize trading based on price reactions at key areas rather than predicting the direction in advance.
🌷Gold is in a sensitive phase at the H4 trendline 💛
If you find this useful, please 💛 Like – 💬 Comment – 🔔 Follow LanaM2 to receive daily gold analysis ✨

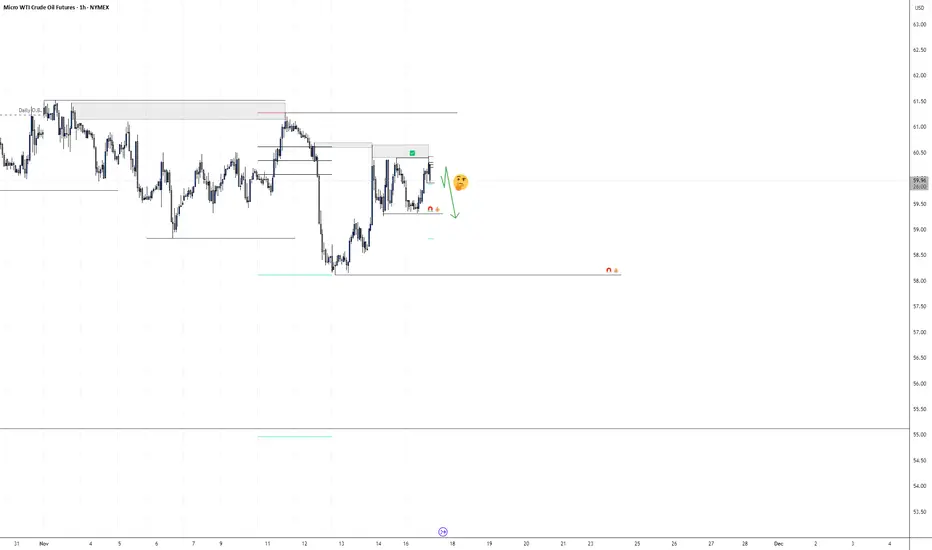
Institutional Order Flow MCl1!Institutional order flow on MCL1! is showing a draw on liquidity with relative equal lows near 55 - 55.5 pricing.
Dropping down to the lower time frame the swing structure holds true and is pointing at lower prices in the near future.
We're looking for entries on the lower time frame and following the fractal trend within the Daily.
Waiting for confirmations, it looks like today will be a bearish day with the nearest target of 59.31
As always, wait for a confirmation entry, and hold small running positions for if we get deeper profits.
LiamTrading – XAUUSD H1 | Continue to watch for SELL at the ...LiamTrading – XAUUSD H1 | Continue to watch for SELL at the start of the week – wait for price to retrace to the trendline & resistance for a perfect entry
Gold is experiencing a sharp decline as the global market faces liquidity pressure. The simultaneous drop in gold, stocks, and Bitcoin indicates that money is being pulled out of risky assets and even safe havens, similar to tense periods like the 2008 crisis or the early 2020 pandemic. Investors are selling profitable assets to cover losses elsewhere.
In the long term, gold typically recovers sooner, but in the short term, the downtrend still prevails.
On H1, the price is below the descending trendline, under the 4100 resistance, and is moving in a clear Lower High – Lower Low structure. This is a good signal to continue prioritizing SELL orders retracing to resistance.
🔍 Technical Analysis (Trendline • S/R • Fibonacci • Liquidity)
The descending trendline is the biggest barrier; each time the price touches the trendline, it is strongly rejected.
Main Resistance:
4098–4100: resistance zone + confluence with trendline.
4120–4130: stronger zone if price retraces deeply (close to Fibo 0.382).
Target Support:
4065: intermediate support – where the price has bounced slightly several times before.
4040 – 4025: large liquidity zone – confluence with the bottom of FVG H1.
3985–3995: the end zone of the down wave if selling pressure expands.
Liquidity Zone:
Many liquidity sweep bottoms continuously → indicating selling pressure still prevails.
The lower FVG zone (around 4025–4040) is highly likely to be filled this week.
📉 Trading Scenario (prioritize SELL retrace)
Scenario – SELL retrace to trendline + resistance (priority)
Entry: 4098–4100
SL: 4106
TP: 4088 → 4065 → 4040 → 4025
💡 Suggestion: Wait for M5–M15 to form a rejection candle (pin bar / bearish engulfing) before executing the order.
When to BUY?
Only BUY if:
H1 closes a candle above 4120, breaking the descending trendline → short-term trend phase change.
If this signal is not present → do not rush to buy against the trend.
⚠️ Important Note
The phenomenon of “selling everything to hold cash” may continue → gold may continue to face pressure in the short term.
Which price zone are you watching for today's session?
Comment below & Follow LiamTrading channel for the fastest updates!

XAUUSD – WEEKLY SESSION SCENARIO UPDATE 💛 XAUUSD – WEEKLY SESSION SCENARIO UPDATE 🎯
🌤 Overview
Hello everyone 💬
Gold prices at the start of the week remain mostly unchanged, the price structure on H4 is intact, so Lana continues to maintain the old trading strategy.
Currently, gold is weakly reacting around the mid-term resistance zone, not strong enough to break through – but also without clear reversal signals.
💹 Technical Analysis
📉 Price is moving within a narrow range between key liquidity zones:
Zone 4138–4140 is the nearby resistance, where the market has repeatedly reacted downwards.
Zone 4200 coincides with confluence fibo + descending trendline – strong resistance.
Zone 3990–3988 is a crucial support, also a lower liquidity area, suitable for technical rebound Buy.
Market liquidity is weak, reflected in the wicks and narrowing range.
🎯 Reference Trading Plan
💢 SELL (priority on adjustment rhythm)
4138–4140 | SL: 4146 | TP: 4120 → 4105 → 4089
4200 | SL: 4212 | TP: 4185 → 4160 → 4133
💖 BUY (strong support)
3990–3988 | SL: 3984 | TP: 4002 → 4032 → 4060
⚠️ Market Insight (Macro Insight)
Gold declines alongside US stocks and Bitcoin, indicating a lack of liquidity across the market.
This behavior is common during phases like:
2008 Financial Crisis
Early 2020 pandemic panic
Investors are forced to sell profitable assets to cover losses, causing gold – even as a safe haven – to decline. This reflects a strong increase in cash demand and widespread fear.
🌷 Conclusion with LanaM2
Gold is moving within a tight range and heavily reliant on liquidity 💛
If you find this useful, please 💛 Like – 💬 Comment – 🔔 Follow LanaM2 for daily gold analysis ✨

XAUUSD | Rejection From Premium Zone — Targeting Sell-Side LiqGold has pulled into a premium retracement zone (0.5–0.618 Fib) aligning perfectly with the Daily Wick 50% + previous structure flip level (4,122 zone).
This zone acted as a strong supply block, causing an immediate reaction, confirming bearish order flow.
Price is currently forming distribution under the premium zone, signaling potential continuation downward.
🔍 Detailed Breakdown:
HTF Bias: Bearish below 4,122
Retracement: Into 0.5–0.618 Fib + Daily Wick 50%
Zone of Interest: 4,122 – 4,110 (strong rejection zone)
Current Structure: Lower highs forming → distribution
Liquidity Targets:
4,027 (first liquidity pocket)
4,005 (major sell-side liquidity)
4,000 – 3,995 (extended target if momentum accelerates)
📉 Bearish Confirmation:
A clean rejection from the premium zone + multiple liquidity sweeps at the top indicates smart money shifting direction.
📌 What I’m Watching:
If XAU retests the 4,110–4,122 zone and fails to break above structure →
Expecting a clean sell-off into sell-side liquidity levels.
📚 Concepts Used: Liquidity | Imbalance | SMC | Premium vs Discount | Fib Retracement | Market Structure Shift

Market Maker Buy ModelMarket Maker Buy Model in the making for NQ:
- Weekly low triggered;
- Inversion FVG creation;
- Swing high broken;
- Targeting 0.705 of the Dealing Range;
- Entry at the highest FVG with Swing low for stop placement;
- Leap trade;

NQ Price points im looking at for reversals or continuationsReversal: Sweep HTF LiQ + Breakaway gap + BRKR + Revisit = Entry
Continuation: Closure above 25,936 + MTF CISD + IMRB/IOFED + LTF OB respected = Entry
DRH- 26220.75
75DRT-25936.75
DRE- 25652.75
25DRT- 25368.75
(close of 25147.50)
DRL- 25084.50
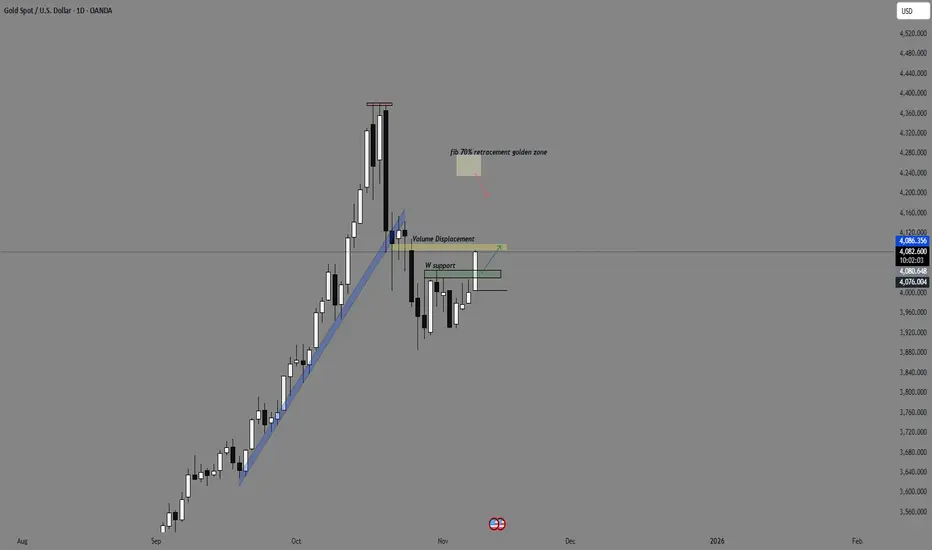
Gold Daily time frame Analysis Here is a simple Daily TF gold chart. I have marked important support / resistance levels which u can use as a high time frame confluence while trading in low Time frames and make your bias accordingly .
LiamTrading –XAUUSD H1|Gold approaches trendline – ready to...LiamTrading –XAUUSD H1|Gold approaches trendline – ready to explode, waiting for a breakout to choose direction!
Gold is moving close to the lower trendline of the ascending channel, indicating an accumulation state – waiting to choose direction. The price has not broken the 4210 resistance zone, but neither has it breached the trendline, so today's fluctuation will revolve around this structure.
If the buying force is strong enough and closes the H1 candle above 4210, the upward trend will be reactivated with a broader target. Conversely, if the price breaks below the trendline, gold may fall to the POC area according to Volume Profile/Fibonacci around 4126–4130, where it will prioritize finding buy signals according to the main trend.
🔍 Technical Analysis (Volume Profile • Trendline • S/R • Fibonacci)
H1 Ascending Channel: Price is testing the trendline for the second time → a pullback bounce is likely if the selling force is weak.
Strong Resistance:
4210: hard resistance – needs to break to confirm an increase.
4230: extended area, coinciding with the channel peak – likely to have strong reactions.
Important Support:
4174: intermediate support; breaking this level will trigger a short-term decline.
4126–4130: POC + large liquidity according to Volume Profile – the best buying area if a deep correction occurs.
Market Signal: Weak candles in the 4180–4190 area indicate gold is waiting for USD information before making a move.
📈 Daily Trading Scenarios
Scenario 1 – Buy according to trend (priority)
Entry: 4126–4128 (POC + Volume Profile support)
SL: 4120
TP: 4140 → 4156 → 4180 → 4198
Suggestion: Wait for a rejection candle or reversal pattern at 412x.
Scenario 2 – Sell when breaking trendline (counter-trend)
Condition: H1 breaks below trendline + retest fails
Entry: 4174–4176
SL: 4182
TP: 4150 → 4135 → 4110
Note: Only sell when there is a confirmation candle; this is a short-term scalping order.
Scenario 3 – Buy when breaking and holding above 4210 (Break & Retest)
Entry: 4212–4216
SL: 4202
TP: 4230 → 4260 → 4285
🌍 Macro Analysis – USD under pressure from new tariff plans
President Trump is preparing to cut tariffs on goods from many Latin American countries (beef, bananas, coffee...).
Objective: reduce domestic food prices, lower import costs.
This could weaken the USD when officially announced → gold benefits in the medium term.
⚠️ Invalid Conditions
H1 closes below 4120 → loses upward structure, may slide to 4090–4100.
H1 closes above 4230 → cancel all sell orders, prioritize buying on breakout.
Which price area are you observing?
Please comment below & hit Follow on LiamTrading channel to receive the earliest analysis every day!

PSO possible short trade setupUpon the basis of monthly range,
This can be a good short setup idea.
Only one confirmation is required more which will make it high probability A+ setup.
The candle body close below 429 before further retracement.
We can expect this setup on coming Tuesday or Wednesday

Daily FVG in the crosshairAfter taking out Monday's high, price rejected the premium daily wick and re-entered the NWOG range. There is a big bearish candle on the day therefore making the previous daily lows highly probable targets.


GOLD ANALYSIS BASED ON REAL SMART MONEY ORDERS (11/10/2025)💛 Welcome to Trade with DECRYPTERS! ( 11/10/2025)
Your trusted source for Smart Money insights, Real-Time Levels & Market Direction.
Let’s decode what’s driving GOLD this week 👇
#GoldSurge #GoldPrice #SafeHaven #PreciousMetals #CentralBankBuy #USDIndex #GoldTrading #GlobalMacro #USChinaTrade #FedWatch #MarketPulse #TradeWithDecrypters
📊 Market Pulse
Gold surged +1.85% to $4,074.92/oz on Nov 10, 2025, rebounding sharply from Friday’s ~$4,000 close.
This move came amid US-China trade talks, geopolitical tensions, and reduced Fed rate-cut expectations — fueling another wave of safe-haven demand.
💹 DXY (~100.20) ticked higher but capped further gains as traders weighed mixed Fed signals and trade optimism.
🏦 Central Banks continued heavy accumulation, with Q3 2025 demand hitting 1,313 tonnes ($146 B) — led by China’s 11th straight month of buying and Poland’s diversification push.
These flows continue to support prices even as the dollar firms.
🌍 Geopolitics & Safe-Haven Demand
⚔️ U.S.–China tensions + Mideast conflicts are boosting gold’s safe-haven appeal.
📈 ETF inflows stand at +619 tonnes YTD, while physical bar & coin demand jumped +17% YoY to 316 tonnes in Q3.
Investors remain defensive, building exposure across multiple gold-linked assets as volatility picks up.
🔎 What to Watch Next
📅 Nov 12 – U.S. CPI Report (~3.0% core expected)
→ Hotter data = Fed pause → short-term pressure on gold
📅 Nov 13 – U.S. PPI & Jobless Claims
→ Softer labor data = higher rate-cut odds → bullish for gold
⚡ Bonus Triggers:
Any U.S.–China trade breakthroughs or Middle East escalations could spark quick volatility spikes off nearby support zones.
🧭 Technical Framework (Smart Money Map)
💰 Current Price: ~$4,075 (+1.85% / 24h)
📉 Volatility Range: $4,020 – $4,100
Smart Money Sell Area: $4,080 – $4,100
→ Institutional resistance cluster – watch for rejection
Scalp Sell Zone: $4,050 – $4,065
→ Ideal for short-term liquidity fades
Scalp Buy Zone: $4,020 – $4,030
→ Minor bounce region
Smart Money Buy Pool: $3,980 – $4,000
→ Key accumulation zone for institutional bids
🎯 Conclusion – Bullish Bias with Pullback Risks
Gold’s strong rebound shows safe-haven and central-bank support still dominate, even as DXY limits upside.
Trend bias remains bullish, but expect controlled pullbacks within the current consolidation.
📊 Above $4,100 → targets $4,200 +
📉 Below $4,020 → tests $3,980–$4,000 buy zone
💬 Trade Smart — Trade with DECRYPTERS ⚡
Gold surge, safe-haven demand, central-bank buying, USD index, U.S.–China trade, Fed rate-cut expectations, geopolitical risk, ETF inflows, physical bullion, Smart Money map.

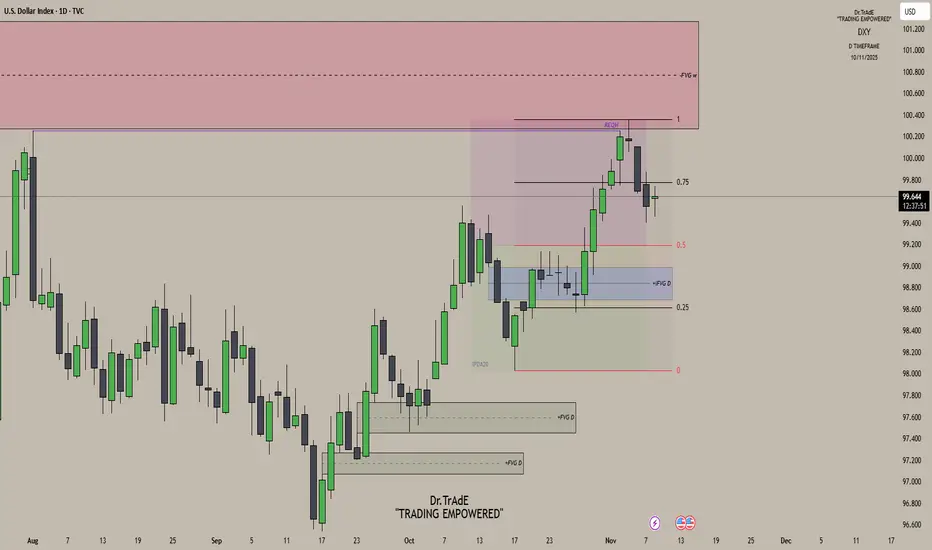
DXY Daily AnalysisLast Week’s Review:
Monday: Bullish delivery as price continued higher.
Tuesday: Price maintained bullish momentum but failed to take out the previous high, leaving equal highs — liquidity resting above.
Wednesday: That liquidity was swept as price reached into the weekly fair value gap, completing delivery to the premium array and initiating bearish distribution.
Current Outlook:
On the daily chart, we’re still trading deep inside premium, and price is showing clear signs of exhaustion after that delivery into the weekly FVG. With bearish distribution now in play, my bias remains bearish. Any short-term push back into the 0.75 quadrant, I’ll treat as a retracement — a chance for price to reprice some lower-timeframe inefficiencies before the next leg lower. On the 4H chart, I’ll be watching for price to trade back into short-term FVGs or inefficiencies that align with this overall bearish narrative.