IDUSDT — Consolidation at Key Support, Breakout or Breakdown?🔎 Technical Overview
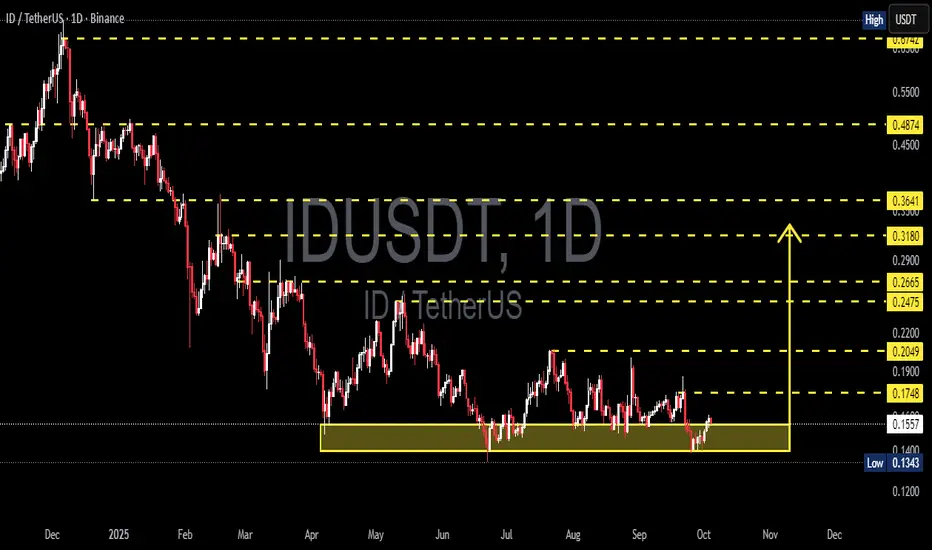
IDUSDT is currently consolidating within a major support zone at 0.1343 – 0.1554 (highlighted yellow box on the chart). This level has been tested multiple times since May 2025, proving that buyers are still defending it.
The price action forms a rectangle accumulation zone, but also resembles a descending triangle as lower highs continue to appear. This means the next move will depend on whether we see a confirmed breakout or a breakdown.
---
🟢 Bullish Scenario
If the price manages to hold above support and break key resistance levels:
First trigger: daily close above 0.1748
Strong confirmation: daily close above 0.2049
Upside targets:
🎯 0.2475 – 0.2665
🎯 0.3180
🎯 0.3641
Each higher resistance break increases the probability of a trend reversal.
---
🔴 Bearish Scenario
If selling pressure dominates and the support fails:
Main trigger: daily close below 0.1343
Implication: breakdown from the accumulation zone → continuation of the downtrend.
Downside target: psychological area below 0.120 (check lower TF for minor supports).
A breakdown here could extend the bearish trend significantly.
---
📌 Visible Patterns
Rectangle Accumulation: price consolidating in a horizontal range, awaiting direction.
Descending Triangle: sellers still pressuring with lower highs.
Demand Zone: 0.1343 – 0.1554 is the key battleground between bulls and bears.
---
⚖️ Conclusion
IDUSDT is at a critical decision point.
Bullish case: breakout above 0.1748 – 0.2049 with strong volume, targeting higher resistance zones.
Bearish case: breakdown below 0.1343, opening downside potential toward 0.120 and lower.
Traders should wait for a confirmed breakout/breakdown before entering positions, while maintaining strict risk management (stop loss at invalidation levels).
---
📌 Key Levels for IDUSDT
Support: 0.1343 – 0.1554
Resistance: 0.1748 – 0.2049
Bullish Targets: 0.2475 – 0.2665 → 0.3180 → 0.3641
Bearish Target: below 0.1343 (towards 0.12 zone)
---
#IDUSDT #CryptoAnalysis #Altcoin #Breakout #SupportResistance #TechnicalAnalysis #BullishScenario #BearishScenario
Idanalysis
ID/USDT — Long Consolidation for Reversal or Breakdown Ahead?📌 Overview
The ID/USDT pair has been moving in a prolonged consolidation phase since May 2025, trapped within a tight accumulation box between 0.1343–0.1674.
This zone has acted as a critical demand area, tested multiple times but still holding strong, showing significant buyer defense.
However, the broader structure remains bearish (lower highs & lower lows since December 2024), meaning this consolidation is a make-or-break stage:
Is it a genuine accumulation before a bullish reversal?
Or just distribution before another breakdown?
---
🔎 Pattern & Structure
Main pattern: Horizontal range / accumulation box.
Characteristics: Sideways movement, low volatility, frequent false breakouts with long wicks → signaling a strong tug-of-war between bulls and bears.
Key technical levels:
Support: 0.1343 (range low)
Resistance: 0.1674 (range high)
Immediate upside levels: 0.2049 – 0.2475 – 0.3180
Major supply zones: 0.3641 – 0.4874 – 0.6742
---
🟢 Bullish Scenario
If price manages to break above 0.1674 and especially confirm above 0.2049 with strong volume:
1. Signals the start of a new bullish momentum after months of accumulation.
2. Potential upside targets:
TP1: 0.2475 (intermediate resistance)
TP2: 0.3180 (strong resistance zone)
TP3: 0.3641 (major supply zone)
3. Confirmation: Daily close above 0.205, supported by a retest holding as new support + volume expansion.
4. Bullish invalidation: A failed breakout where price falls back into the box (false breakout).
---
🔴 Bearish Scenario
If price breaks down below 0.1343 (range low):
1. Indicates buyers lost control of the demand zone.
2. Downside targets:
Psychological support: 0.120 – 0.110
Measured move of the range box: points toward ~0.100
3. Bearish continuation is confirmed if breakdown comes with high volume.
4. Bearish invalidation: A quick rebound back inside the box (false breakdown).
---
🎯 Trading Implications
For swing traders: This 0.134–0.167 range offers a prime opportunity to trade the box (buy support, sell resistance) until a breakout occurs.
For trend followers: Wait for a confirmed breakout/breakdown with volume before entering, to reduce false signal risk.
Risk management: Place stops just outside the box (below 0.134 for longs, above 0.167 for shorts). Risk no more than 1–2% per trade.
---
📌 Conclusion
ID/USDT is currently in a “calm before the storm” phase. This long consolidation will soon dictate the next major trend:
A confirmed breakout could trigger a strong reversal after the prolonged downtrend.
A breakdown would likely extend the bearish cycle toward deeper lows.
Traders should stay patient and wait for daily close confirmation with volume to validate the next direction.
---
#IDUSDT #CryptoAnalysis #TechnicalAnalysis #SupportResistance #Breakout #Bearish #Bullish #Altcoins #SwingTrading #Accumulation

IDBINANCE:IDUSDT
#ID/ USDT
Entry range (0.1500- 0.1650)
SL 4H close below 0.1460
T1 0.18
T2 0.26
T3 0.30
Extra Target is optional 0.45
_______________________________________________________
Golden Advices.
********************
* collect the coin slowly in the entry range.
* Please calculate your losses before the entry.
* Do not enter any trade you find it not suitable for you.
* No FOMO - No Rush , it is a long journey.

IDUSDT 5DID ~ 5D Analysis
#ID Buy gradually from here with a minimum target of 20%+
The reason, this is the lowest support for now.

#ID (SPOT) entry range (0.3020- 0.4020) T.(1.4990) SL(0.2850)BINANCE:IDUSDT
entry range (0.3020- 0.4020)
Target1 (0.5510) - Target2 (0.7230)- Target3 (0.9999)- Target4 (1.1840)- Target5 (1.4990)
SL .1D close below (0.2850)
*** collect the coin slowly in the entry range ***
*** No FOMO - No Rush , it is a long journey ***
**** #Manta ,#OMNI, #DYM, #AI, #IO, #XAI , #ACE #NFP #RAD #WLD #ORDI #BLUR #SUI #Voxel #AEVO #VITE #APE #RDNT #FLUX #NMR #VANRY #TRB #HBAR #DGB #XEC #ERN #ALT #IO #ACA #HIVE #ASTR #ARDR #PIXEL #LTO #AERGO #SCRT #ATA #HOOK #FLOW #KSM #HFT #MINA #DATA #SC #JOE #RDNT #IQ #CFX #BICO #CTSI #KMD #FXS #DEGO #FORTH # AST #PORTAL #CYBER #CLV #RIF ENJ #ZIL #APT #MAV #ZRX #ID ****

#IDIt is moving in a short-term ascending channel in time H4, and in the middle of the channel, after forming a DOUBLE TOP, it has also formed a diamond pattern, which with the failure of this concentration, it can have a downward trend as high as its height. Therefore, in the area of the red bar, you can enter a sell position by confirming one or more candles.
