XRP - Descending Channel | Breakout or Breakdown? | Massive News
Hey TradingView community! 👋
XRP is at a make-or-break level right now. Let me break down what I'm seeing on the 45-minute chart.
The Setup
XRPUSD is trading at $2.09 inside a clear descending channel that's been in play since early January. Price has been making lower highs and lower lows, but we're now sitting right at a critical support zone around $2.10-2.18.
This is the moment of truth - either buyers step in here and we get a breakout, or we lose this level and continue lower.
Why This Level Matters
Descending channel support being tested RIGHT NOW
$2.10-2.18 zone has acted as support multiple times
Whale activity spiking to 3-month highs - smart money accumulating?
CNBC just called XRP the "new crypto darling"
Massive institutional news dropping (Ripple + BNY, FCA approval, Evernorth partnership)
The News is HUGE
Ripple just had a monster week:
BNY (Bank of New York) tapped Ripple Prime for tokenized deposits - this is massive institutional adoption
Ripple secured FCA authorization in the UK - clearing path for expansion
Evernorth + Doppler Finance partnership to boost XRP as yield-generating asset for institutions
South Korea announcing spot Bitcoin ETFs - XRP ETF momentum building
Analysts saying XRP could outperform Bitcoin on percentage gains
Key Levels I'm Watching
Resistance:
$2.18 - Upper channel resistance / breakout level
$2.32 - Major horizontal resistance
$2.50+ - Bullish target if breakout confirms
Support:
$2.10 - Current support zone (CRITICAL)
$1.90 - Lower channel support
$1.61 - 52-week low area
My Game Plan
This is a two-scenario setup:
Bullish scenario: If XRP holds above $2.10 and breaks out of the descending channel with volume, we could see a sharp move toward $2.32 and potentially $2.50+. The institutional news flow is extremely bullish - BNY partnership, FCA approval, whale accumulation. If Bitcoin pumps, XRP could explode.
Bearish scenario: If we lose $2.10 support and break below the channel, next stop is $1.90. The descending channel trend would continue until we see a clear reversal signal.
The Bottom Line
I'm cautiously bullish here. The news catalysts are incredible - Ripple is getting institutional adoption at a rapid pace. Whale activity at 3-month highs suggests smart money is accumulating. BUT the chart structure is still bearish until we break out of this descending channel.
Watch the $2.10 level closely. Hold = bullish. Break = more downside.
What's your take? Breakout or breakdown? Let me know in the comments! 👇
Ideasdetrading

DOT - Descending Wedge | FVG Zones Setup | Breakout Incoming
Executive Summary
Polkadot (DOT) market cap trading at $3.53B within a descending wedge on the 4H timeframe. Strong +18% weekly rally. Two FVG zones identified for potential retest. Price could retest first FVG, continue in wedge, then explode up or down. New economic model caps supply at 2.1B DOT with biennial issuance reductions starting March 2026.
BIAS: NEUTRAL - Watching FVG Zones for Direction
Current Market Data
Current: $3.53B (-4.43%)
Day's Range: $3.51B - $3.71B
52-Week: $1.91B - $11.7B
Volume: 226.57M (above 30D avg of 175M)
Performance:
1W: +18.08% | 1M: +2.46% | 3M: -48.27%
6M: -43.07% | YTD: +19.52% | 1Y: -70.44%
Key News
New economic model: Supply capped at 2.1B DOT
Biennial issuance reductions starting March 2026
13.14% annual issuance reduction every 2 years
Target: 3.11% stable annual inflation
Phala Network migrating from Polkadot to Ethereum L2
Moonriver (MOVR) network upgrade Jan 6
Technical Structure - 4H
Descending Wedge Pattern:
Yellow dashed trendlines converging
Wedge narrowing toward apex
Typically bullish reversal (70% break up)
Two FVG zones identified
FVG Zones (Purple Boxes):
First FVG: ~$3.50B-$3.58B (upper zone - current area)
Second FVG: ~$3.05B-$3.20B (lower zone)
Key Levels (Market Cap):
Resistance:
$3.71B - Day's high
$3.85B - Upper resistance (red line)
$4.00B+ - Breakout target
Support:
$3.50B-$3.58B - First FVG zone
$3.05B-$3.20B - Second FVG zone
$2.72B - Major support (red line)
SCENARIO ANALYSIS
SCENARIO 1: Bullish from First FVG
Retest first FVG at $3.50B-$3.58B
Bounce and continue in wedge
Break above wedge resistance
Explode to $3.85B, then $4.00B+
SCENARIO 2: Bearish to Second FVG
Reject at first FVG zone
Drop to second FVG at $3.05B-$3.20B
Retest and bounce OR
Break down to $2.72B major support
My Assessment
Descending wedge with two FVG zones. Strong +18% weekly rally but now pulling back. Watch first FVG ($3.50B-$3.58B) for reaction. Bounce = bullish to $3.85B+. Breakdown = bearish to second FVG ($3.05B-$3.20B). New tokenomics (supply cap) is long-term bullish.
Strategy:
Watch first FVG for bounce or breakdown
Long on bounce from first FVG → Target $3.85B, $4.00B
If breakdown, wait for second FVG at $3.05B-$3.20B
Stop below $2.72B major support
Share your ideas and thoughts below on this next big move!!!

AVAX - Rising Wedge at $14.12 | ETF Filings Spark +11% Rally
Executive Summary
Avalanche (AVAX) trading at $14.12 within a rising wedge on the 2H timeframe. Price surged +11% this week as institutional ETF filings sparked a rally. Now testing upper resistance with two scenarios: bullish breakout above $14.75 or pullback to $12.00-$12.75 support zone before continuation.
BIAS: NEUTRAL - Watching for Breakout or Pullback
Current Market Data
Current: $14.123 (-0.82%)
Day's Range: $14.033 - $14.516
52-Week: $9.013 - $44.575
Market Cap: $6.08B
24h Volume: $384.76M
Technical Rating: Neutral
Performance:
1W: +11.80% | 1M: +6.89% | 3M: -53.89%
6M: -23.09% | YTD: +14.80% | 1Y: -66.85%
Key Catalyst
Institutional ETF filings sparked +11% rally
AVAX among altcoins with ETF filing momentum
Fortune 100 companies expected to launch blockchains on Avalanche
Strong ecosystem for enterprise adoption
Technical Structure - 2H
Rising Wedge Pattern:
Rising support and resistance trendlines (yellow dashed)
Wedge narrowing toward apex
Can break either direction
Currently testing upper resistance
Key Levels:
Resistance:
$14.50 - $14.75 - Upper resistance / breakout level
$15.00 - Psychological resistance
$16.00+ - Extended bullish target
Support:
$14.00 - Immediate support
$12.75 - Upper support zone
$12.00 - $12.75 - Major support zone (purple)
$11.75 - Deep support (red line)
SCENARIO ANALYSIS
BULLISH: Breakout Above $14.75
Trigger: 2H close above $14.75 with volume
Targets: $15.00 → $16.00 → $18.00
Catalyst: ETF momentum continues
BEARISH: Pullback to Support Zone
Rejection at upper wedge resistance
Pullback to $12.00-$12.75 support zone
Healthy retest before continuation
Buy opportunity at support
My Assessment
Rising wedge at resistance after +11% ETF-driven rally. Two scenarios: breakout above $14.75 or pullback to $12.00-$12.75 support zone. ETF filings provide fundamental catalyst. Watch for confirmation before entry.
Strategy:
Long above $14.75 breakout → Target $15, $16, $18
Or wait for pullback to $12.00-$12.75 support
Long at support with stop below $11.75
Target $14.50+ on bounce
List your thoughts below!

MNQ - Range-Bound at 25,385 | Support Below, Resistance AboveExecutive Summary
Micro E-mini Nasdaq 100 futures (MNQ1!) trading at 25,385 in a range-bound consolidation on the 4H timeframe. Price rejected from the 25,900-26,000 resistance zone and is now testing lower levels. Multiple support zones below at 25,100-25,200 and 24,850-24,950. Watch for breakout direction from this consolidation range.
BIAS: NEUTRAL - Range-Bound Consolidation
Current Market Data
Current: 25,385.25 (-0.28%)
Day's Range: 25,265.25 - 25,803.50
52-Week: 16,452.50 - 26,399.50
Open Interest: 94.90K
Front Month: MNQH2026
Performance:
1W: -1.87% | 1M: -1.03% | 3M: +1.12%
6M: +10.52% | YTD: -0.29% | 1Y: +10.79%
Key Market Context
Mag 7 outperformed S&P 500 for 3rd straight year
MAG/SPX ratio showing smallest yearly rise in 3 years
Equal-weighted S&P 500 starting to outperform
January Barometer: As January goes, so goes the year (84% hit rate)
Santa Rally sputtering - weak footing into 2026
VIX subdued but could spike in Jan-Feb
Fed expected to pause at Jan 27-28 meeting (83% odds)
Technical Structure - 4H
Range-Bound Consolidation:
Price consolidating between support and resistance
Rejected from 25,900-26,000 resistance zone
Testing lower support zones
Watch for breakout direction
Key Levels:
Resistance:
25,800 - Day's high / immediate resistance
25,900 - 26,000 - Resistance zone (pink box)
26,260 - Upper resistance (red line)
26,399.50 - 52-WEEK HIGH
Support Zones (Purple):
25,100 - 25,200 - Upper support zone
24,850 - 24,950 - Lower support zone
24,850 - Major support (red line at bottom)
SCENARIO ANALYSIS
BULLISH: Break Above Resistance
Trigger: Break above 26,000 with volume
Targets: 26,260 → 26,399 (52-week high) → 26,500+
BEARISH: Test Support Zones
Price tests 25,100-25,200 first support
If fails, drops to 24,850-24,950
Break below 24,850 = bearish continuation
NEUTRAL: Range Continuation
Price oscillates between 24,850 - 26,000
Wait for breakout confirmation
Trade the range until breakout
My Assessment
Range-bound consolidation with clear support and resistance zones. Mag 7 momentum slowing, equal-weighted index gaining ground. Santa Rally weak - cautious into January. Watch support zones for bounce or breakdown.
Strategy:
Watch for bounce at 25,100-25,200 support
Long above 26,000 breakout → Target 26,260, 26,400
Short below 24,850 breakdown → Target 24,500, 24,000
Trade the range until breakout confirms
Comment your thoughts below!

TheGrove | USDJPY buy | Idea Trading Analysis USD/JPY is trading within a rising channel, with price holding above the ascending support line after a clear bullish and is moving on support line.
The chart is above the support level, which has already become a reversal point twice.
We expect a decline in the channel after testing the current level.
We expect a decline in the channel after testing the current level
Hello Traders, here is the full analysis.
I think we can soon see more fall from this range! GOOD LUCK! Great SELL opportunity USDJPY
I still did my best and this is the most likely count for me at the moment.
-------------------
Traders, if you liked this idea or if you have your own opinion about it, write in the comments. I will be glad ⚜️

EURUSD: Reversal from the Lows and Up MoveHello everyone, here is my breakdown of the current Euro setup.
Market Analysis
From a broader perspective, the price of EURUSD has shifted into a bearish phase after a prior Upward Channel failed and broke down. This reversal led to the formation of the current Downward Wedge, a pattern that has been guiding the price lower.
Currently, the price is at a critical decision point. After a complex series of moves, it is now testing the lower support line of the wedge, which aligns with the major Support at the 1.1615 level.
My Scenario & Strategy
My scenario is built on the idea of a 'fake breakdown' at this key support. I'm looking for the price to dip briefly below the wedge's support line into the Support zone to hunt for liquidity, and then quickly reverse.
A swift reclaim of the wedge's interior would be a powerful signal that sellers are exhausted and a bullish reversal is underway. This is the key confirmation I am waiting for.
Therefore, the strategy is to watch for this reclaim. A successful reversal would validate the long scenario. The primary target for the subsequent rally is the Wedge Resistance Line at the 1.1670.
That's the setup I'm tracking. Thank you for your attention, and always manage your risk.

World gold prices under pressure to fallGold was pressured lower mainly due to the strong USD. The DXY index - measuring the greenback's volatility - increased 0.6% compared to a basket of six major currencies in the world to 97.82 points. The USD increased in value despite investors still betting almost certainly that the US Federal Reserve (Fed) will cut interest rates at both meetings in October and December.
The USD increased in value as some other major currencies were pressured by less positive economic information.
Deutsche Bank continues to maintain its view that gold prices are likely to reach $4,000/ounce next year. Accordingly, the resumption of the Fed's easing cycle, while the European Central Bank (ECB) pauses interest rate cuts and the Bank of England (BoE) begins to "hawkish" will put pressure on the USD, weakening the high-yield advantage, thereby reducing demand for holding the greenback.
Gold is also supported by buying demand from central banks, including the People's Bank of China (PBOC).
In 2026, Deutsche forecasts that gold could continue to increase by 24%, mainly due to central bank demand and a favorable macroeconomic environment.

What is the current global gold demand?Despite the record high price, the proportion of gold in total global financial assets is only about 2%. According to the World Gold Council, the amount of gold held by ETFs is still much lower than the peak in 2020.
This shows that there is still a lot of room for growth. The attraction of gold comes from its role as a "safe haven" in the context of rising inflation due to increasingly heavy government debt. The US alone has recorded an additional deficit of 2,000 billion USD this year, bringing the total public debt to over 37,000 billion USD.
Not only with USD, gold has also continuously reached peaks when calculated in Canadian dollars, British pounds, euros, Japanese yen and Australian dollars. Gold is currently trading above 5,000 USD/ounce compared to CAD.
The reason lies not only in global public debt, but also because many investors are beginning to worry that the US Federal Reserve (Fed) is losing its independence in monetary policy. Some experts believe that if the Fed cuts interest rates more aggressively in the coming years, especially when President Trump appoints more members to the council, gold will be strongly supported.

World gold prices continuously reverseThe Federal Open Market Committee (FOMC) meeting, which began on Tuesday morning, will conclude on Wednesday afternoon (US time) with a statement and press conference by US Federal Reserve (FED) Chairman Jerome Powell. The FOMC is expected to cut the key interest rate by 0.25 percentage points - the first since November last year.
The new FED forecast may also show a slowdown in US economic growth and a rise in unemployment. At the press conference, Chairman Powell will have to answer many questions not only about the economic outlook and interest rates but also about the independence of the FED.
Global stock markets generally rose slightly overnight, while US index futures forecast a mixed opening. In other developments, the Cyberspace Administration of China is said to have asked companies like Alibaba and ByteDance to cancel orders for Nvidia's RTX Pro 6000D chips - a line of chips designed to avoid restrictions on exporting AI technology to China.
The move comes as the US and China have just announced progress in trade negotiations in Madrid (Spain).

Scenario of Fed cutting interest rates stronglyGold prices are hovering at record highs and all eyes are on the US Federal Reserve. A surprise decision – even a “dramatic cut” as President Donald Trump has suggested – could be the catalyst for a new wave of price increases.
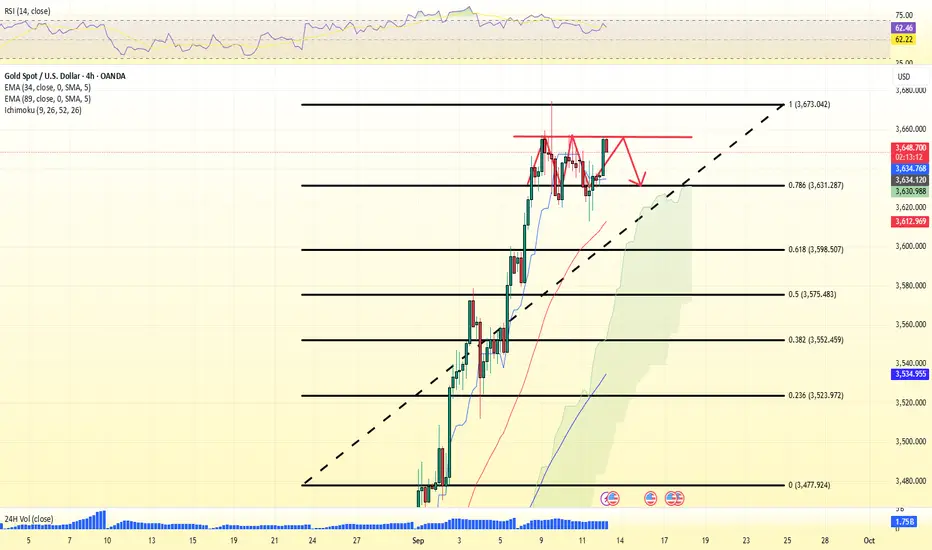
Although the Fed is expected to cut interest rates by another 0.25 percentage points after its meeting on September 17, it is the language and tone of Fed Chairman Jerome Powell’s speech that will determine the next move for gold prices, according to the World Gold Council’s (WGC) weekly market report.
Last week’s gold price action reflected a mix of inflation data and political turmoil. In the US, mixed inflation, a cooling labor market and weak consumer confidence kept expectations of interest rate cuts high.

The immediate reflection level is at an overnight high of 3,687Gold prices rose after a surprise rise in US weekly jobless claims and a easing in US consumer price index (CPI). Meanwhile, silver prices rose steadily.
US weekly jobless claims rose by 27,000 from the previous week, up 263,000 from the previous week, above the forecast of 235,000. The report is seen as a factor supporting the “doves” in monetary policy, who want the US Federal Reserve (FED) to cut interest rates more aggressively.
Meanwhile, US annual inflation, as measured by CPI, rose to 2.9% in August, the highest level since January and higher than July’s 2.7%. Prices rose mainly in the food group, used cars and new cars.
CPI rose 0.4% month-on-month, up from 0.2% in July and above forecasts for 0.3%. The expansion after producer prices rose more than expected in July was somewhat muted. Core CPI, which excludes food and energy, remained unchanged at 3.1%, matching the rebound in February and July. Core CPI rose 0.3% month-on-month.
Inflation in the US has become a complex issue.Inflation in the US has become a complicated issue for the gold market. Rising consumer prices have forced the Fed to maintain a neutral monetary policy, keeping interest rates unchanged until 2025, increasing the opportunity cost of holding gold. However, high inflation also increases the risk that the US could fall into recession, which is supporting safe-haven demand for the precious metal.
On the other hand, a weakening labor market has economists predicting that the Fed will cut interest rates again this month despite high inflation to complete the other half of its mission.
Specifically, the number of weekly unemployment benefits in the US increased by 27,000 compared to the previous week, to 263,000, higher than the market forecast of 235,000. Today's jobless claims report is in the group of monetary policy dovish, who want to see the US Federal Reserve (Fed) cut interest rates more aggressively.
Meanwhile, annual US inflation, as measured by the consumer price index (CPI), increased in August, to 2.9% compared to the same period last year. This is the highest level since January and up from 2.7% in the July report.
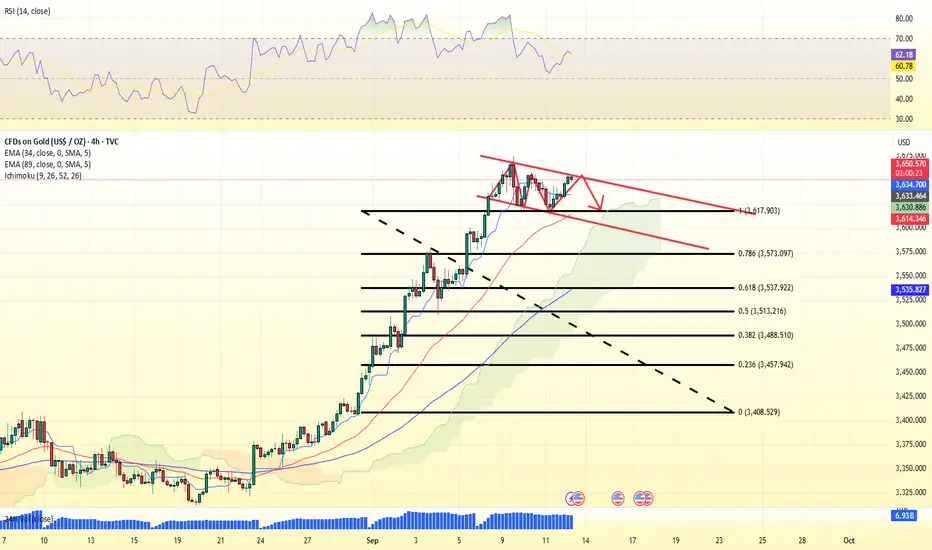
Gold as a safe haven asset.Even as the US dollar strengthened and Treasury yields rose, gold hit a new record high.
The precious metal’s rise reflects a fundamental shift in global reserve management strategies. Foreign central banks now hold a larger share of gold than US Treasuries in their international reserves for the first time since 1996, according to Crescat Capital macro strategist Tavi Costa.
Another key driver of gold’s rally has been shifting policy expectations from the US Federal Reserve. Market participants are increasingly confident that the central bank will deliver a 25 basis point interest rate cut this month, with current prices reflecting a 91.7% probability of such a move. That’s up from 86.4% just a day earlier and 87.8% a week ago.

World gold price today August 29, 2025According to the report just released, the US GDP grew by 3.3% in the second quarter, higher than the initial estimate of 3.0% and exceeding economists' expectations. Real GDP was revised up mainly due to improvements in investment and consumer spending.
The US Department of Labor just released labor market data. Initial jobless claims, seasonally adjusted, were 229,000 for the week ending August 23. This figure was only slightly lower than the forecast of 230,000. The previous week's figure was revised down from 235,000 to 234,000.
In addition, continuing jobless claims reached 1.954 million for the week ending August 16, lower than the expected 1.975 million.
The labor market remains strong, leaving the Federal Reserve (Fed) with room to tighten monetary policy, putting pressure on gold prices.
Market sentiment was further strained after US President Donald Trump on Monday decided to fire Federal Reserve Governor Lisa Cook over allegations of improper mortgage lending, raising concerns about the independence of the US central bank.

Safe-haven demand continues to hold support.Thus, after several consecutive sessions of increasing to a two-week peak, in response to signals of policy easing from Fed Chairman Jerome Powell as well as Mr. Trump's increasing pressure on the US central bank, gold prices have turned to decrease.
However, the decrease is quite small as safe-haven demand continues to maintain a strong support base.
The US PCE price index (used to measure inflation) released next Friday is expected to guide the gold market, with a consensus forecast of 2.6% for the overall index and 2.9% for the core index.
In the coming time, analysts warn that any erosion in the Fed's independence could boost demand for gold as a policy risk hedge.
In addition, global geopolitical and trade tensions remain persistent and are expected to continue to enhance the safe-haven value of precious metals.
On the afternoon of August 27 (Vietnam time), the US officially raised import tariffs on goods from India to 50%, double the previous rate of 25%, on the grounds that New Delhi continues to buy oil from Russia. This move could threaten trade relations between the US and India - one of Washington's most important partners, while pushing up prices of many commodities.

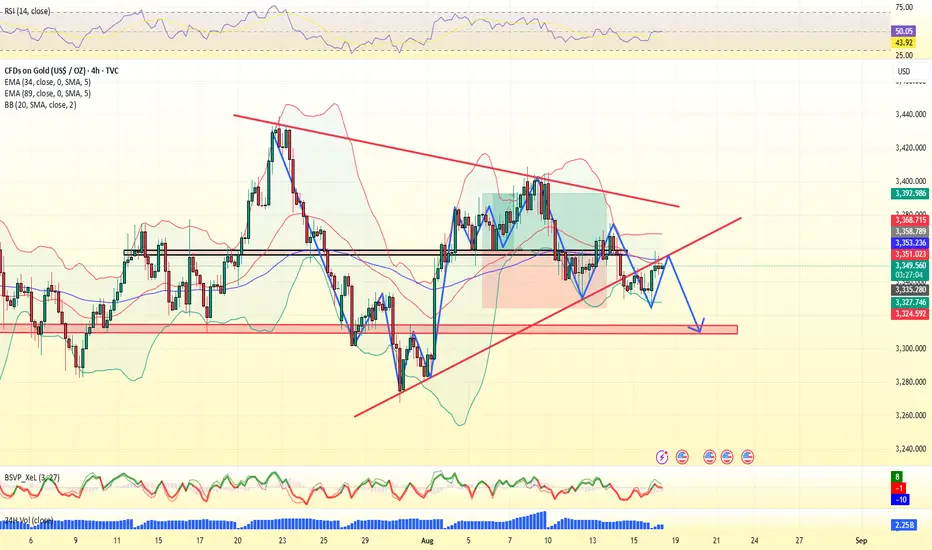
Domestic gold prices increase but international prices decreaseThirteen Wall Street analysts participated in Kitco's gold survey this week, with none calling for a decline. Of those surveyed, eight were bullish on gold for next week. The rest were neutral.
The main argument for the bullish group is the expectation of a rate cut by the Federal Reserve in September, following comments from Chairman Jerome Powell. Ole Hansen, head of commodity strategy at Saxo Bank, said that after a relatively quiet summer for the gold market, the Fed will help open the door by cutting interest rates through the end of the year.
This will weaken the US dollar, creating a positive environment for gold. In the short term, Hansen said that the precious metal could rise above $3,450 an ounce before investors can revisit April's record high above $3,500.
Resistance : 3375 , 3385
Support : 3352 , 3344

Interest rates are currently higher than necessary.The recent rise in inflation is mainly due to tariffs, which would put inflation at just 2%.
Kevin Grady, president of Phoenix Futures and Options, said interest rates are higher than they should be. He predicted the Fed would likely cut rates by 50 basis points unless inflation continued to rise. However, Grady said the recent rise in inflation was largely due to tariffs, and if that factor were excluded, inflation would be just 2%. He said this was just a one-time effect of the tariffs taking effect, not a long-term trend.
Regarding the gold market, Grady said the market is in a correction phase after last week's strong volatility. The price gap between futures and physical gold (EFP) jumped from $8 to more than $100 on July 21 due to tariff uncertainty. The gap later narrowed to $60 when the government confirmed that gold would not be subject to tariffs. Grady stressed that such large fluctuations make it difficult to trade physical gold, especially for banks and traders.

Gold price forecast difficult to break outThis week, analysts said that gold prices will still find it difficult to break out in the short term when the market lacks momentum to increase points. Factors that have supported gold prices to increase strongly in recent times, such as US tariff policies and geopolitical tensions in some regions, are all easing.
Mr. Daniel Pavilonis, senior commodities broker at RJO Futures, commented that although inflation data has edged up and interest rates have increased slightly, gold prices are still moving sideways within a narrow range. This development shows that gold is becoming less attractive in the eyes of investors and could fall below $3,000/ounce this year.
"If the US starts cutting interest rates and inflation rises higher, that could be a positive signal for gold. However, gold prices have been moving sideways for the past 4 months and the momentum for price increases in the short term is not high."
Gold Price ForecastThe weekly gold survey by an international financial information platform shows mixed views among experts and investors. Of the 10 analysts who responded, only 10% said that gold prices would rise again, 10% said that gold prices would fall, but up to 80% predicted that gold prices would remain stable. The lack of a clear trend in gold prices shows the unpredictability of precious metals.
Meanwhile, investors were more optimistic. Of the 183 investors who responded to the survey, 63% said that gold prices would rise again, 18% said that gold prices would fall, and 19% expected gold prices to remain stable.
Mr. Adrian Day - Chairman of Adrian Day Asset Management said that gold prices will continue to fluctuate within a narrow range with a steady upward trend. The US Federal Reserve's (FED) expected interest rate cut in September has been reflected in the market, so gold prices need more monetary easing to break out more strongly.

Financial markets are set to receive a slew of important newDomestic gold prices fell due to the impact of world gold prices. In the international market, after closing the week at a high level, today's gold price suddenly reversed and plummeted when opening the new trading week.
Gold prices fell contrary to the forecast of analysts and investors when they expected the precious metal to continue to increase this week.
This week, the market is waiting for a lot of economic information such as the meeting to announce Australia's interest rate decision; the US consumer price index (CPI) report for July; the US producer price index... The data of this information is expected to affect the gold price.
This morning, the USD index (DXY) in the international market recovered to 98.1 points, also creating pressure to reduce gold prices.

Gold price today August 5: strong reversalWorld gold prices unexpectedly reversed sharply, as Europe and the US continued to release poor economic data. Specifically, the European economic area announced the investor confidence index released monthly by Sentix GmbH, August at a decrease of 3.7 points, much lower than the increase of 4.5 points in July.
In the US, factory orders released monthly by the US Census Bureau, measuring the change in the value of new orders for goods purchased at US factories, decreased by 4.8% in June compared to the previous month. Although slightly higher than the forecast of a decrease of 4.9%, it decreased sharply compared to the increase of 8.3% in May.
Thus, both the US and the European region are showing weaknesses in economic development. Because new orders in the US are considered a forward-looking indicator of upcoming demand for manufactured goods. Falling orders indicate that the production and business activities of US enterprises will face difficulties in operation.
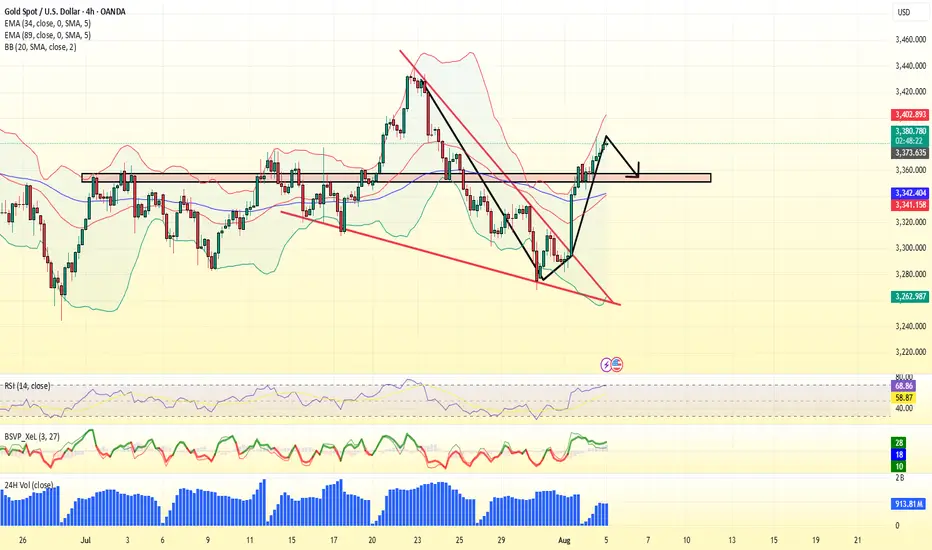
gold bullish trading idea gold trading idea gold follow bullish channel gold make higher high and higher low now gold make higher high 3480

GBP/JPY Buy OpportunityA potential buy signal is forming on GBP/JPY due to a break above a key supply zone. This breakout indicates strong bullish momentum, suggesting further upside potential.
