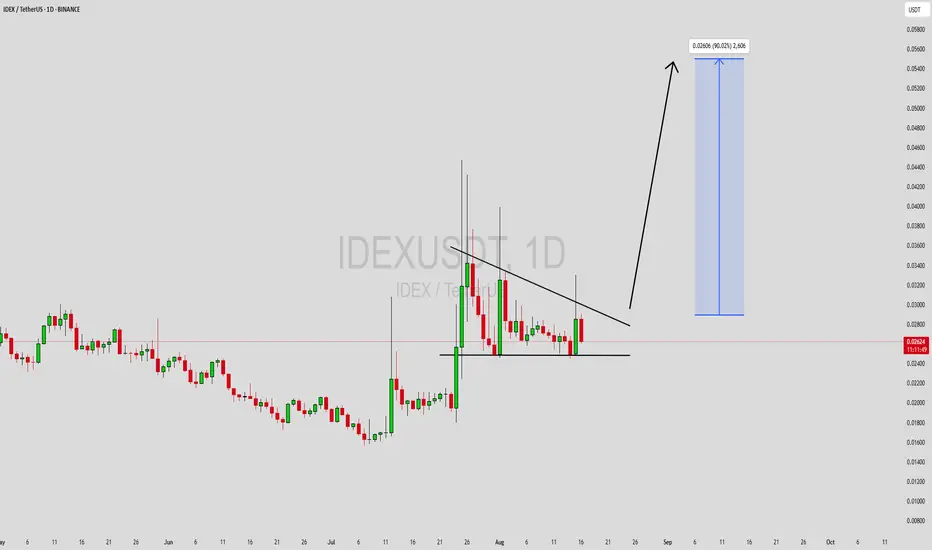
IDEXUSDT Forming Falling WedgeIDEXUSDT is currently forming a falling wedge pattern, which is widely regarded as a bullish reversal setup in technical analysis. This pattern often appears after a downtrend, signaling a potential shift in market momentum. With good volume supporting the recent movements, the chances of a breakout to the upside are increasing. Based on this structure, a price gain of around 50% to 60%+ could be expected if the breakout confirms with strength.
The falling wedge reflects a gradual decrease in selling pressure while buyers steadily gain control. As the price consolidates within narrowing trendlines, traders often anticipate a breakout that leads to significant upward momentum. This aligns with IDEXUSDT’s current market behavior, suggesting that the coin may be preparing for a bullish reversal phase.
Investor interest in IDEXUSDT is also rising, highlighting confidence in its long-term potential. Strong engagement, combined with bullish technical signals, indicates that more traders are positioning themselves for possible upside. If volume continues to support the breakout, IDEXUSDT could attract even more momentum-driven buying in the upcoming sessions.
✅ Show your support by hitting the like button and
✅ Leaving a comment below! (What is You opinion about this Coin)
Your feedback and engagement keep me inspired to share more insightful market analysis with you!
IDEXBTC

IDEXUSDT Forming Descending TriangleIDEXUSDT is currently forming a descending triangle pattern, which is a well-known technical setup often leading to sharp breakouts when confirmed. Despite its traditionally bearish reputation, this pattern can also resolve to the upside in bullish market conditions—especially when accompanied by growing volume and accumulation signals. With volume looking solid, this chart structure could set the stage for a strong move soon.
The price has been coiling within the triangle, squeezing tighter near the support zone, indicating that volatility is compressing and a breakout is likely imminent. Investors appear to be taking notice, with consistent interest seen during consolidation phases. If the resistance line is breached with volume confirmation, IDEXUSDT may see a price expansion toward the projected 80% to 90% upside range.
This pattern offers a solid risk-to-reward setup for traders who understand how to position around potential breakout zones. As the broader market strengthens, coins like IDEXUSDT that are technically coiled tend to outperform. Keep an eye on a decisive move above the horizontal resistance line, backed by a volume surge, to validate the bullish reversal.
✅ Show your support by hitting the like button and
✅ Leaving a comment below! (What is You opinion about this Coin)
Your feedback and engagement keep me inspired to share more insightful market analysis with you!
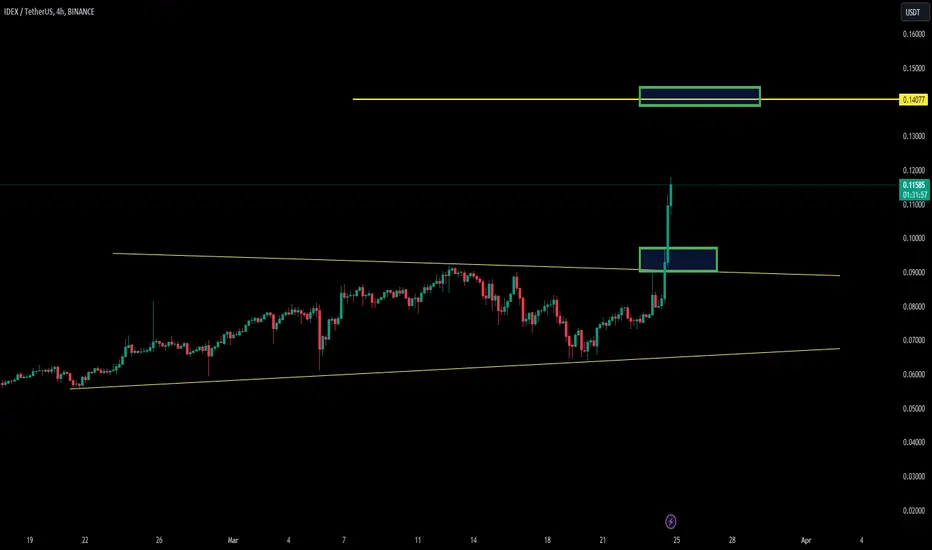
IDEXUSDT: Critical Target Before the Takeoff!IDEXUSDT: Critical Target Before the Takeoff! 🚀
Key Insights:
Essential Pullback: IDEXUSDT is unlikely to continue its upward movement without first hitting this target zone.
Stops in Place: My stop-loss level is set at 0.091, ensuring controlled risk.
Clear Chart Details: All other essential levels and strategies are marked on the chart for easy reference.
Why This Matters?
Markets often respect well-defined levels. Waiting for the pullback ensures entries are made with precision, reducing risk and increasing potential upside.
Final Note: Don’t rush into trades; let the market come to you. Patience always pays off.
Does this strategy align with your approach? Boost, comment, and follow for more insights on mastering the charts! 🌟
Let me tell you, folks, this is amazing. Nobody does analysis like I do. Believe me. If this helps you, don't forget to boost and comment! It’s a big deal, motivates me to share even more winning insights with you. Tremendous insights.
I keep my charts the best, clean, simple, and clear. You know it, I know it, clarity leads to better decisions. No question about it. My approach? Built on years of tremendous experience. Incredible track record. I don’t claim to know it all, but I spot high-probability setups like nobody else. Trust me.
Want to learn how to use the heatmap, cumulative volume delta, and volume footprint techniques I use to determine demand regions with stunning accuracy? Send me a private message—totally free, folks. That’s right. I help anyone who wants it, absolutely no charge. Unbelievable value.
Here’s the list, long list, great list, of some of my previous incredible analyses. Each one, a winner:
🎯 ZENUSDT.P: Patience & Profitability | %230 Reaction from the Sniper Entry
🐶 DOGEUSDT.P: Next Move
🎨 RENDERUSDT.P: Opportunity of the Month
💎 ETHUSDT.P: Where to Retrace
🟢 BNBUSDT.P: Potential Surge
📊 BTC Dominance: Reaction Zone
🌊 WAVESUSDT.P: Demand Zone Potential
🟣 UNIUSDT.P: Long-Term Trade
🔵 XRPUSDT.P: Entry Zones
🔗 LINKUSDT.P: Follow The River
📈 BTCUSDT.P: Two Key Demand Zones
🟩 POLUSDT: Bullish Momentum
🌟 PENDLEUSDT.P: Where Opportunity Meets Precision
🔥 BTCUSDT.P: Liquidation of Highly Leveraged Longs
🌊 SOLUSDT.P: SOL's Dip - Your Opportunity
🐸 1000PEPEUSDT.P: Prime Bounce Zone Unlocked
🚀 ETHUSDT.P: Set to Explode - Don't Miss This Game Changer
🤖 IQUSDT: Smart Plan
⚡️ PONDUSDT: A Trade Not Taken Is Better Than a Losing One
💼 STMXUSDT: 2 Buying Areas
🐢 TURBOUSDT: Buy Zones and Buyer Presence
🌍 ICPUSDT.P: Massive Upside Potential | Check the Trade Update For Seeing Results
🟠 IDEXUSDT: Spot Buy Area | %26 Profit if You Trade with MSB
📌 USUALUSDT: Buyers Are Active + %70 Profit in Total
🌟 FORTHUSDT: Sniper Entry +%26 Reaction
🐳 QKCUSDT: Sniper Entry +%57 Reaction
📊 BTC.D: Retest of Key Area Highly Likely
And that’s just the start. The list goes on and on, folks. It’s a tremendous list, the best. I stopped adding because, frankly, it’s tiring. So many wins. People are amazed. You can check my profile and see for yourself, winning moves, all the time. Believe me, nobody does it better.

IDEXUSDT | SPOT BUY AREACurrent Market Context:
While there’s a noticeable increase in buyer activity, the price is in a determined downtrend. This suggests a potential accumulation phase where buyers are preparing to counteract the decline.
Key Observations:
Buyer Strength: Increased buying activity is evident, but sellers currently dominate the price action.
Blue Box Zone: This area represents a potential demand zone or strong support where buyers may decisively step in to reverse the downtrend.
Trading Plan:
Bullish Entry:
Wait for the price to dip into the blue box zone.
Look for confirmation of reversal signals, such as bullish engulfing candles, pin bars, or a higher low formation on smaller timeframes.
Targets:
Initial target: Retest of nearby resistance levels.
Extended target: Move to higher structural levels as momentum builds.
Invalidation:
If the price closes strongly below the blue box, the setup may be invalidated.
Additional Notes:
Volume Divergence: Track volume during the decline; increasing volume at the blue box could confirm buyer dominance.
Stop Loss Placement: Set stops just below the blue box to minimize risk.
This setup requires patience and precise execution.
I keep my charts clean and simple because I believe clarity leads to better decisions.
My approach is built on years of experience and a solid track record. I don’t claim to know it all, but I’m confident in my ability to spot high-probability setups.
My Previous Analysis
🐶 DOGEUSDT.P: Next Move
🎨 RENDERUSDT.P: Opportunity of the Month
💎 ETHUSDT.P: Where to Retrace
🟢 BNBUSDT.P: Potential Surge
📊 BTC Dominance: Reaction Zone
🌊 WAVESUSDT.P: Demand Zone Potential
🟣 UNIUSDT.P: Long-Term Trade
🔵 XRPUSDT.P: Entry Zones
🔗 LINKUSDT.P: Follow The River
📈 BTCUSDT.P: Two Key Demand Zones
🟩 POLUSDT: Bullish Momentum
🌟 PENDLEUSDT: Where Opportunity Meets Precision
🔥 BTCUSDT.P: Liquidation of Highly Leveraged Longs
🌊 SOLUSDT.P: SOL's Dip - Your Opportunity
🐸 1000PEPEUSDT.P: Prime Bounce Zone Unlocked
🚀 ETHUSDT.P: Set to Explode - Don't Miss This Game Changer
🤖 IQUSDT: Smart Plan
⚡️ PONDUSDT: A Trade Not Taken Is Better Than a Losing One
💼 STMXUSDT: 2 Buying Areas

IDEX looks bullishWe seem to be at the end of a large diametric F wave.
It is expected that the price will pull back towards the green range and by spending time, it will complete the G wave of this diametric and then we will see bullish movements up to the red box.
Closing a daily candle below the invalidation level will violate the analysis.
For risk management, please don't forget stop loss and capital management
Comment if you have any questions
Thank You

IDEX NEW INCREASE VOLUMEIDEX shows a new increase in volume, which could be confirmed in the coming time frames.
We will follow the coin to see if it's able to confirm.
The reason for the volume is the trend data that this coin shows.
This coin is a basic choice on daily trends.
IDEX analysis (4H)It seems like we have a big diametric that now the buyers are trying to complete the F wave of this diametric and raise the price.
By maintaining the flip line and the green range, the price can move towards the TPs.
I also specified the invalidation level. If a 4-hour candle closes below this level, the analysis will be violated
For risk management, please don't forget stop loss and capital management
When we reach the first target, save some profit and then change the stop to entry
Comment if you have any questions
Thank You

IDEX ANALYSIS (4H)Hi, dear traders. how are you ? Today we have a viewpoint to BUY/SELL the IDEX symbol.
For risk management, please don't forget stop loss and capital management
When we reach the first target, save some profit and then change the stop to entry
Comment if you have any questions
Thank You

IDEX ANALYSIS Hi, dear traders. how are you ? Today we have a viewpoint to BUY/SELL the IDEX symbol.
For risk management, please don't forget stop loss and capital management
When we reach the first target, save some profit and then change the stop to entry
Comment if you have any questions
Thank You

IDEX patterns worth entering a tradeAdam & eve on the rise. Wait for the confirmation before entering the trade and have some stop loss in there too.
This is not financial advice.

IDEX : BREAKOUT VIEWIDEX seems on important confirmation pattern line what could be able to breakout to up $0,20 in the coming time.
Its a coin where the riskmangement should be high. as there is no garanty in the markets.

idex
#IDEX/BTC
Exchanges: Binance
Signal Type: Regular (Long)
Amount: 2.0%
💎 Entry Targets:
326-315
Take-Profit Targets:
Target 1: 332
Target 2: 337
Target 3: 355
Target 4: 400
🚫 Stop loss:
290

IDEX Classic Falling Wedge PatternWe have the classic falling wedge pattern on the IDEXUSDT chart.
We can see volume going up as an attempt is happening to break out of this pattern.
An "attempt" because we consider this confirmed only after the daily candle closes.
Previous support is being tested and holds based on the challenge of EMA21 and a higher low compared to February 24.
It can grow... If not, we have a chart setup with LOW risk and HIGH potential reward.
Trade at your own risk.
Namaste.

$IDEX, Testing the highest level since October$IDEX
Testing the highest level since October on a 26% daily bar so far..
Trying to cross above Ichi cloud (bullish)
~70% up since latest UCTS 1D Buy
Aiming for a flip/break above this area as signal of continuation
#IDEX

IDEXBUSD trade analysisIDEXBUSD trade has completed its correction now its way to move up to fulfil H&S pattern as shown in the graph. Potential buy position will be between 100% fib level to 78% fib level to achieve 400% fib level. Trade will boost up approximate 500% profit.
We publish precise and compact information which give you quick glimpse for comparative analysis. if you have any question or want to ask about analysis of other pairs or you have any confusion about analysis then feel free to ask us. Don't forget to support by share your ideas and hit like and subscribe button.

IDEX v3 IS COMING It's time.
IDEX v3, the world's first Hybrid Liquidity DEX, will be launching on December 1st, 2021.
Over the coming weeks, IDEX team will announce various initiatives and incentives that will help drive immense growth for the entire $IDEX ecosystem.
Get ready. 👾
Always make your own research before to trade my ideas!
Don't Forget to Follow Me :)

IDEX v3 IS COMING - LET'S SEE WHERE WILL IDEX/UST BEIt's time.
IDEX v3, the world's first Hybrid Liquidity DEX, will be launching on December 1st, 2021.
Over the coming weeks, IDEX team will announce various initiatives and incentives that will help drive immense growth for the entire $IDEX ecosystem.
Get ready. 👾
Don't Forget to Follow Me :)

IDEX is programmed to test its lower fib level nexI think IDEX needs to test support below @ .786 before resuming its upward movement. Target is on chart.
Cheers!

IDEX/BTC buy opportunityHi followers,
BINANCE:IDEXBTC formed a very nice rounding bottom, which is known as a very powerful reversal pattern.
Followed by higher low and increasing volumes on the moves up. More upside expected.
Don't forget to manage your risk! 👌
Good luck and trade with care 🙏
If you like my content - 👍 Like, 💬 comment, 👆 follow and 👉 share!
❗❗❗
Disclaimer: This information is not a recommendation to BUY or SELL. It is to be used for educational purposes only

IdexusdtIDEX is the first Ethereum-based and decentralized smart contract exchange that supports real-time transactions and high trading volume. IDEX, the native token of the IDEX platform, is a utility token.


