IDUSDT — Consolidation at Key Support, Breakout or Breakdown?🔎 Technical Overview
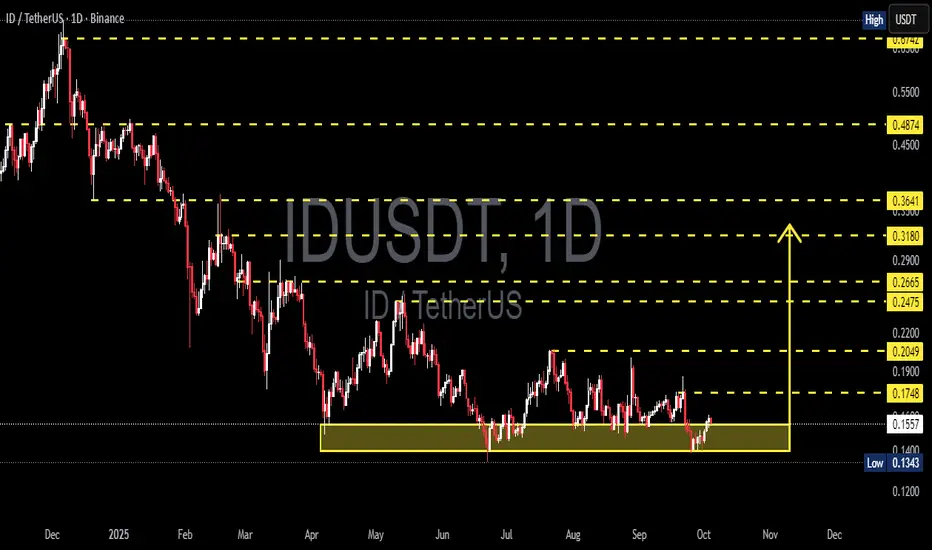
IDUSDT is currently consolidating within a major support zone at 0.1343 – 0.1554 (highlighted yellow box on the chart). This level has been tested multiple times since May 2025, proving that buyers are still defending it.
The price action forms a rectangle accumulation zone, but also resembles a descending triangle as lower highs continue to appear. This means the next move will depend on whether we see a confirmed breakout or a breakdown.
---
🟢 Bullish Scenario
If the price manages to hold above support and break key resistance levels:
First trigger: daily close above 0.1748
Strong confirmation: daily close above 0.2049
Upside targets:
🎯 0.2475 – 0.2665
🎯 0.3180
🎯 0.3641
Each higher resistance break increases the probability of a trend reversal.
---
🔴 Bearish Scenario
If selling pressure dominates and the support fails:
Main trigger: daily close below 0.1343
Implication: breakdown from the accumulation zone → continuation of the downtrend.
Downside target: psychological area below 0.120 (check lower TF for minor supports).
A breakdown here could extend the bearish trend significantly.
---
📌 Visible Patterns
Rectangle Accumulation: price consolidating in a horizontal range, awaiting direction.
Descending Triangle: sellers still pressuring with lower highs.
Demand Zone: 0.1343 – 0.1554 is the key battleground between bulls and bears.
---
⚖️ Conclusion
IDUSDT is at a critical decision point.
Bullish case: breakout above 0.1748 – 0.2049 with strong volume, targeting higher resistance zones.
Bearish case: breakdown below 0.1343, opening downside potential toward 0.120 and lower.
Traders should wait for a confirmed breakout/breakdown before entering positions, while maintaining strict risk management (stop loss at invalidation levels).
---
📌 Key Levels for IDUSDT
Support: 0.1343 – 0.1554
Resistance: 0.1748 – 0.2049
Bullish Targets: 0.2475 – 0.2665 → 0.3180 → 0.3641
Bearish Target: below 0.1343 (towards 0.12 zone)
---
#IDUSDT #CryptoAnalysis #Altcoin #Breakout #SupportResistance #TechnicalAnalysis #BullishScenario #BearishScenario
IDUSD
ID/USDT — Long Consolidation for Reversal or Breakdown Ahead?📌 Overview
The ID/USDT pair has been moving in a prolonged consolidation phase since May 2025, trapped within a tight accumulation box between 0.1343–0.1674.
This zone has acted as a critical demand area, tested multiple times but still holding strong, showing significant buyer defense.
However, the broader structure remains bearish (lower highs & lower lows since December 2024), meaning this consolidation is a make-or-break stage:
Is it a genuine accumulation before a bullish reversal?
Or just distribution before another breakdown?
---
🔎 Pattern & Structure
Main pattern: Horizontal range / accumulation box.
Characteristics: Sideways movement, low volatility, frequent false breakouts with long wicks → signaling a strong tug-of-war between bulls and bears.
Key technical levels:
Support: 0.1343 (range low)
Resistance: 0.1674 (range high)
Immediate upside levels: 0.2049 – 0.2475 – 0.3180
Major supply zones: 0.3641 – 0.4874 – 0.6742
---
🟢 Bullish Scenario
If price manages to break above 0.1674 and especially confirm above 0.2049 with strong volume:
1. Signals the start of a new bullish momentum after months of accumulation.
2. Potential upside targets:
TP1: 0.2475 (intermediate resistance)
TP2: 0.3180 (strong resistance zone)
TP3: 0.3641 (major supply zone)
3. Confirmation: Daily close above 0.205, supported by a retest holding as new support + volume expansion.
4. Bullish invalidation: A failed breakout where price falls back into the box (false breakout).
---
🔴 Bearish Scenario
If price breaks down below 0.1343 (range low):
1. Indicates buyers lost control of the demand zone.
2. Downside targets:
Psychological support: 0.120 – 0.110
Measured move of the range box: points toward ~0.100
3. Bearish continuation is confirmed if breakdown comes with high volume.
4. Bearish invalidation: A quick rebound back inside the box (false breakdown).
---
🎯 Trading Implications
For swing traders: This 0.134–0.167 range offers a prime opportunity to trade the box (buy support, sell resistance) until a breakout occurs.
For trend followers: Wait for a confirmed breakout/breakdown with volume before entering, to reduce false signal risk.
Risk management: Place stops just outside the box (below 0.134 for longs, above 0.167 for shorts). Risk no more than 1–2% per trade.
---
📌 Conclusion
ID/USDT is currently in a “calm before the storm” phase. This long consolidation will soon dictate the next major trend:
A confirmed breakout could trigger a strong reversal after the prolonged downtrend.
A breakdown would likely extend the bearish cycle toward deeper lows.
Traders should stay patient and wait for daily close confirmation with volume to validate the next direction.
---
#IDUSDT #CryptoAnalysis #TechnicalAnalysis #SupportResistance #Breakout #Bearish #Bullish #Altcoins #SwingTrading #Accumulation

ID/USDT — Final Battle at the Multi-Month Downtrend Line!📌 Market Structure Overview
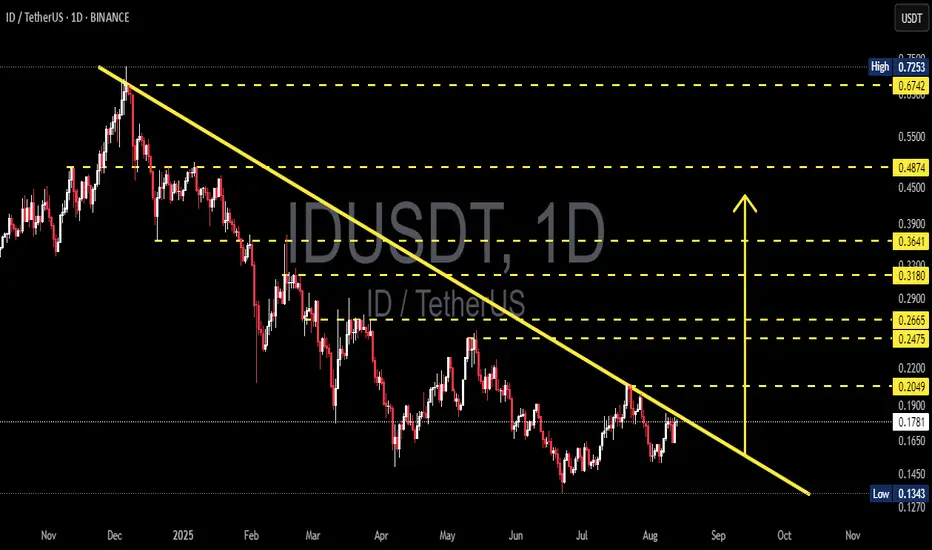
Since peaking in late 2024, ID/USDT has been trapped under a relentless multi-month downtrend line lasting almost 10 months. Every rally attempt has been shut down at this descending wall.
Now, the market is at a critical inflection point — price is pressing right against the trendline and sitting in the decision zone between 0.190–0.205.
A breakout here would not only be a technical victory for the bulls but could also trigger a shift in market psychology from seller dominance to buyer control.
---
📊 Key Levels to Watch
Major Resistances: 0.2049 → 0.2475 → 0.2665 → 0.3180 → 0.3641 → 0.4874 → 0.6742
Supports: 0.177–0.180 → 0.165 → 0.134–0.145 (major demand zone)
---
📐 Pattern & Sentiment Analysis
The dominant structure is a classic Descending Trendline Resistance, showing consistent lower highs under seller pressure.
However, there’s an early sign of sentiment shift — a higher low compared to the July bottom, suggesting that buyers are stepping in earlier and absorbing supply.
If price can close a daily candle above the trendline and 0.2049, we could see the start of a trend reversal rally toward higher resistance levels.
---
🚀 Bullish Scenario
1. Trigger: Daily close above the trendline + 0.2049.
2. Confirmation: Retest of 0.19–0.205 holds as new support.
3. Upside Targets:
Initial: 0.2475
Mid-term: 0.2665 → 0.3180
Extended: 0.3641 (psychological zone)
4. Invalidation: Closing back below 0.190 or losing 0.177–0.180.
---
📉 Bearish Scenario
1. Trigger: Sharp rejection from the trendline/0.19–0.205 zone.
2. Downside Targets:
First: 0.177–0.180
Next: 0.165
Extreme: 0.134–0.145 (historical low)
3. Invalidation: Sustained breakout above 0.205 with strong volume.
---
⚖️ Perspective & Risk Management
This is a “make or break” moment for ID/USDT.
Don’t rely solely on intraday spikes — wait for a confirmed daily close to avoid fakeouts.
Use the above S/R levels as tiered take-profit zones and for placing protective stops.
#IDUSDT #ID #Crypto #PriceAction #TechnicalAnalysis #DowntrendBreak #Breakout #SupportResistance #CryptoTrading
IDUSDT Analysis ID ~ 4D Analysis
#ID Buy on retesting this buy zone or buy on successful breakout of the resistance line of this pattern. With a short term target of at least 10%+.

ID is bearish for the mid-term (2D)Before anything, pay attention to the timeframe—it's a 2-day timeframe, so it will take time.
Given that a large-degree bearish triangle has completed, this coin may remain bearish in the mid-term. The red zone is where the next major bearish wave could start.
A daily candle closing above the invalidation level will invalidate this analysis.
For risk management, please don't forget stop loss and capital management
Comment if you have any questions
Thank You

IDUSDT 5DID ~ 5D Analysis
#ID Buy gradually from here with a minimum target of 20%+
The reason, this is the lowest support for now.

IDUSDT 3DID ~ 3D Analysis
#ID In the 3D time frame, this is a very good support for now, Buy from here if you still have a Conviction on this coin with a minimum target of 20%+

Can #ID Bulls Really Continue this Bullish Momentum? Key LevelsYello, Paradisers! Will #IDUSDT rally to new highs or face a sharp rejection? Let’s dive into the current setup of #SpaceID:
💎#ID recently broke out of a well-defined descending channel—a structure often signaling a shift in trend. Currently, the price is consolidating near the $0.423 support zone, a critical level to watch for the next move. For bulls to regain momentum, the price must decisively break above the $0.5773 resistance zone. This will confirm the breakout and open the door for a significant rally.
💎If #IDUSD successfully reclaims the $0.577 resistance level, the next key hurdle lies in the major resistance zone around $0.750. A breakout above this level would likely trigger a strong upward move, potentially targeting even higher levels. Watch for increased trading volume and strong bullish candles above $0.577 as confirmation of market strength.
💎On the downside, if the price fails to hold above the $0.423 support zone, a retest of the demand zone near $0.366 becomes highly probable. This area has historically attracted buyers, but if it fails to hold, the bullish setup will be invalidated.
💎A daily close below $0.366 could lead to further downside pressure, with potential targets near $0.3000 or lower. So, let's see how this #ID setup turns out, but the probability of it going up is higher.
Stay focused, patient, and disciplined, Paradisers🥂
MyCryptoParadise
iFeel the success🌴


ID is bullish#ID has some of the finest patterns the market made a good rise after hitting the past demand zone and also made a good correction which hit the fibo 0.62 level and also VWAP

ID looks bullish (2D)The larger pattern of the ID symbol appears to be a significant diametric, with ID now aiming to enter wave E.
Wave E is bullish.
If the price holds within the green zone, it can move toward the targets.
The targets are marked on the chart.
Closing a daily candle below the invalidation level will invalidate this analysis.
For risk management, please don't forget stop loss and capital management
When we reach the first target, save some profit and then change the stop to entry
Comment if you have any questions
Thank You

A similar behavior Between ID and SUIStructurally these charts are almost identical
- Same low and higher low
-same rounding bottom pattern
Accumulate ID while its price is low.
It will become a trend and the talk of everyone as soon as it breaks the round bottom pattern just like what happend with SUI
Best regards Ceciliones🎯

Will #ID Explode or Collapse? Watch These Critical Levels Yello, Paradisers! Are we standing on the edge of a major breakout or will #IDUSDT plunge into a deeper retracement? Let’s break down the latest analysis of #SpaceID:
💎#ID has been trading within a broadening wedge pattern for months, with descending resistance and support lines shaping the structure. Recently, the price broke out above the wedge’s descending resistance—a critical technical milestone. However, for any meaningful upside, the price must conquer the $0.7495 resistance level, which currently stands as the major hurdle.
💎A clean breakout above $0.7495, confirmed with a daily close, could unleash a significant bullish rally. The next targets on this trajectory would be around $1.00 and potentially higher toward the $1.30–$1.60 major resistance zone. These levels would likely draw in fresh buying momentum, propelling the price further upward.
💎On the flip side, the $0.6710 level serves as immediate support. Below that, there is a strong demand zone at $0.5218–$0.3955, which has acted as a springboard for bullish recoveries in the past. As long as the price remains above this demand zone, the bullish case remains intact. A dip into this zone could provide an ideal opportunity for bulls to regain control.
💎However, if #IDUSD closes a candle below $0.3955, this would invalidate the bullish structure. Such a move could signal further downside, with the price targeting lows around $0.2850 or even lower. This scenario would shake out inexperienced traders and open opportunities for short sellers.
Stay focused, patient, and disciplined, Paradisers🥂
MyCryptoParadise
iFeel the success🌴

IDUSDTID ~ 5D
#ID Make gradual purchases on this support block. With a short term target of at least 20%++. We think this is a strong enough support block to hold the price.

IDUSDTID ~ 5D
#ID If you have Conviction on this coin,. Make gradual purchases on these support blocks. with a short term target of at least 20%++

#ID (SPOT) entry range (0.3020- 0.4020) T.(1.4990) SL(0.2850)BINANCE:IDUSDT
entry range (0.3020- 0.4020)
Target1 (0.5510) - Target2 (0.7230)- Target3 (0.9999)- Target4 (1.1840)- Target5 (1.4990)
SL .1D close below (0.2850)
*** collect the coin slowly in the entry range ***
*** No FOMO - No Rush , it is a long journey ***
**** #Manta ,#OMNI, #DYM, #AI, #IO, #XAI , #ACE #NFP #RAD #WLD #ORDI #BLUR #SUI #Voxel #AEVO #VITE #APE #RDNT #FLUX #NMR #VANRY #TRB #HBAR #DGB #XEC #ERN #ALT #IO #ACA #HIVE #ASTR #ARDR #PIXEL #LTO #AERGO #SCRT #ATA #HOOK #FLOW #KSM #HFT #MINA #DATA #SC #JOE #RDNT #IQ #CFX #BICO #CTSI #KMD #FXS #DEGO #FORTH # AST #PORTAL #CYBER #CLV #RIF ENJ #ZIL #APT #MAV #ZRX #ID ****

ID with bullish baseID is very bullish here, can explode to higher prices. PA is bullish and MAs are holding price very well. It should go higher.
Always manage your risk and use stoploss...

[IDUSDT] - worthy to buyadd BME:ID to the coins which are worth collecting
chart is very similar to NYSE:SUI and it always follows it after few weeks in the same way of rising
Project ✅️
The chart✅️
our target is: 1.45$
buy now u than me later
best regards ceciliones🎯

ID looks bearishID is a symbol that is very interested in sharp movements and triangle formation.
It looks like a large diametric pattern is forming and the ID is finishing wave C.
It is expected that the supply will be maintained and the price will enter the D wave.
Wave D is bearish.
The targets are clear on the chart.
Closing a daily candle above the invalidation level will violate the analysis.
For risk management, please don't forget stop loss and capital management
When we reach the first target, save some profit and then change the stop to entry
Comment if you have any questions
Thank You

Trade Idea for SPACE ID (ID) - Accumulation StrategySPACE ID (ID) is currently trading at approximately $0.7485, having shown a price increase of 4.91% in the last 24 hours. The market cap is around $399.69 million, with a circulating supply of approximately 533,986,987 ID tokens.
Initiate a position at the current price level of around $0.7485. This entry provides a strategic point given the recent price movements and potential for rebound.
Plan to accumulate additional SPACE ID tokens if the price drops to $0.72 and further to $0.66. This strategy allows for averaging down the entry price and capitalizing on market corrections.
Set multiple take-profit targets to maximize returns. The initial targets are $1.20 and $1.65, chosen based on potential resistance levels and historical price action.
SPACE ID aims to create a universal name service network for Web3, offering decentralized, open-source, and censorship-resistant services. The project includes web3 domain registration, management, and governance through its ID token, which plays a critical role in the platform's ecosystem.
The SPACE ID token has experienced significant volatility but shows potential for substantial growth as more users adopt its services. The Fear & Greed Index indicates a sentiment leaning towards greed, which may suggest strong investor interest and potential buying opportunities.
Accumulating SPACE ID at strategic price points leverages market volatility and the potential for future growth. The phased profit-taking strategy aims to capture gains as the market appreciates, driven by the project's innovative approach to Web3 identity management.
This trade idea is based on current market data and SPACE ID’s strategic positioning as of May 2024. Cryptocurrency investments carry inherent risks, including the loss of principal. Investors should conduct their own research and consider their financial circumstances and risk appetite before engaging in cryptocurrency trading. This analysis is not financial advice.

#IDUSDT #Analysis #Eddy#IDUSDT #Analysis #Eddy
This analysis is based on the combination of PA, RTM, ICT, DL2+3 & Wyckoff Analytical Styles. (( In general, most altcoins have a similar structure and can grow by more than 50 and 100 percent. ))
I specified the sniper entry points for you ;-)
» Do not forget to receive confirmation
» Don't forget risk and capital management
⚠️ Attention!
((Pay attention to the position and movements of Bitcoin, as well as the general state of the market and indicators, please confirm))

ID ENTERING NEW IMPORTANT LEVELID shows a new increase in volume, which could be confirmed in the coming time frames.
We will follow the coin to see if it's able to confirm.
The reason for the volume is the trend data that this coin shows.
This coin is at basic choice on daily trends.

ID 🆔 binance launchpad project 🔮 Hello 👋 it's me your RAJ 🙂 professional trader ✨
This idea 💡
is completely my own analysis to explain situation _&_ market conditions of BINANCE:IDUSDT 🪙
How this coin valid for long term 📌 explained clearly BASED on history 🤪 & #TA 📌 #DYOR
Note 👉 coin 🪙 have potential High risk 🔥 $0 to hero 😂
😆 Present circulation supply was 413M by the end of 2025 , it will be 1.26B
only 26% supply avilable in market 📌 remaining kept locked 🔐 this concern me as high risk
I recommend PPL to go with unwanted liquid 💰 CRYPTOBETTING 👀
Don't try to use all liquid 💰 or 20% of ur long term liquid bag 💰 just give 5% below priority
::-:-:-:-:-:-:-:-:-:-:-:-:-:-:-:-:-:-:-:-:-:-:-:-:-:-:-:-:-:-:-:-:-:-:-:-:-:-:-:-:-:-:-:-:-:-:-:-:-:-:-:-:-:-:-:-:-:-:-:-:-:-:-:-:-:-:-:-:-:-:-:-:-:-:-:-:-:-:-:-:-:-::
BUY || accumulation phase 📍
👉 $0.077 - $0.247 👈
+
|| 👉 Sell :|: distribution phase 👈 ||
🎯 :: $1.5 - $2.1
🎯 :: $12 - $14
🎯 :: $20 - $25
🎯 :: $40 - $50
🗝️ Try get ur liquid 💰 back at $1.5 above I used to call as " principal trade "
🗝️ Close 20% bag at $12-14
🗝️ Close 60% bag at $20-25
I am not expecting more than $30 but based on #TA with #FA provided
No technical data history to explain about technical analysis ⏰
I have done 👍 my research 🔎 on LAUNCHPAD projects based on funding i review this 👀
__________________________________________________________________________________________
🪩 disclaimer :
▶️ TQ u for supporting 💚 follow idea 💡 get updates everytime ⏰ when I updated 📌
Note 👀
👉 keeping comments , reacting with emojis , pointing us is very easy to some people
They think 💬 what they see 📌 that was knowledge 📌
We need to learn market in many ways and should get adopted with experience, TECHNICAL ANALYSIS won't help understanding market structure and understanding bull 🐂 and bear 🐻 is more important
Economical conditions
Fundamentals
Technical
News
Sentiments
Checking macro to micro having good plan and build it is very important ☺️
Some Times market easily turn suddenly bear // bull 🤣 even we need to catch 🫴 those movements is also very important ☺️ 💛
I hope i cleared my view 🙂 if any points if I miss I will add in update 📌 post
Try to understand, try to learn - try to move with flexibility with market is important
Have good day 😊
----------------------------------------------------------------------------------------------------------------------------------------------------------
