IDUSDT — Consolidation at Key Support, Breakout or Breakdown?🔎 Technical Overview
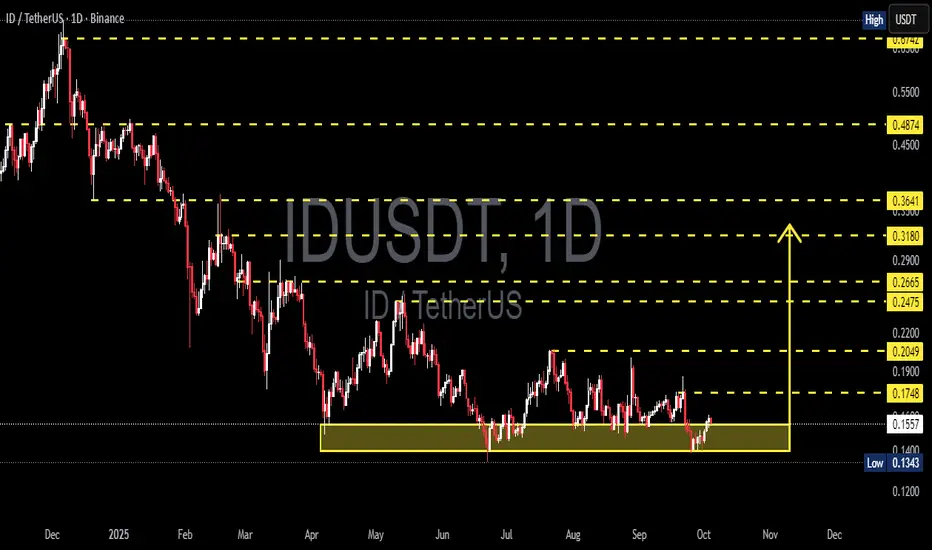
IDUSDT is currently consolidating within a major support zone at 0.1343 – 0.1554 (highlighted yellow box on the chart). This level has been tested multiple times since May 2025, proving that buyers are still defending it.
The price action forms a rectangle accumulation zone, but also resembles a descending triangle as lower highs continue to appear. This means the next move will depend on whether we see a confirmed breakout or a breakdown.
---
🟢 Bullish Scenario
If the price manages to hold above support and break key resistance levels:
First trigger: daily close above 0.1748
Strong confirmation: daily close above 0.2049
Upside targets:
🎯 0.2475 – 0.2665
🎯 0.3180
🎯 0.3641
Each higher resistance break increases the probability of a trend reversal.
---
🔴 Bearish Scenario
If selling pressure dominates and the support fails:
Main trigger: daily close below 0.1343
Implication: breakdown from the accumulation zone → continuation of the downtrend.
Downside target: psychological area below 0.120 (check lower TF for minor supports).
A breakdown here could extend the bearish trend significantly.
---
📌 Visible Patterns
Rectangle Accumulation: price consolidating in a horizontal range, awaiting direction.
Descending Triangle: sellers still pressuring with lower highs.
Demand Zone: 0.1343 – 0.1554 is the key battleground between bulls and bears.
---
⚖️ Conclusion
IDUSDT is at a critical decision point.
Bullish case: breakout above 0.1748 – 0.2049 with strong volume, targeting higher resistance zones.
Bearish case: breakdown below 0.1343, opening downside potential toward 0.120 and lower.
Traders should wait for a confirmed breakout/breakdown before entering positions, while maintaining strict risk management (stop loss at invalidation levels).
---
📌 Key Levels for IDUSDT
Support: 0.1343 – 0.1554
Resistance: 0.1748 – 0.2049
Bullish Targets: 0.2475 – 0.2665 → 0.3180 → 0.3641
Bearish Target: below 0.1343 (towards 0.12 zone)
---
#IDUSDT #CryptoAnalysis #Altcoin #Breakout #SupportResistance #TechnicalAnalysis #BullishScenario #BearishScenario
Idusdtlong
IDUSDT UPDATE#ID
UPDATE
ID Technical Setup
Pattern: Bullish Falling Wedge Pattern
Current Price: $0.1779
Target Price: $0.298
Target % Gain: 65.80%
BME:ID is breaking out of a falling wedge pattern on the 1D timeframe. Current price is $0.1779 with a target near $0.298, showing about 66% potential upside. The breakout confirms bullish momentum with structure favoring continuation. Always use proper risk management.
Time Frame: 1D
Risk Management Tip: Always use proper risk management.

ID/USDT — Long Consolidation for Reversal or Breakdown Ahead?📌 Overview
The ID/USDT pair has been moving in a prolonged consolidation phase since May 2025, trapped within a tight accumulation box between 0.1343–0.1674.
This zone has acted as a critical demand area, tested multiple times but still holding strong, showing significant buyer defense.
However, the broader structure remains bearish (lower highs & lower lows since December 2024), meaning this consolidation is a make-or-break stage:
Is it a genuine accumulation before a bullish reversal?
Or just distribution before another breakdown?
---
🔎 Pattern & Structure
Main pattern: Horizontal range / accumulation box.
Characteristics: Sideways movement, low volatility, frequent false breakouts with long wicks → signaling a strong tug-of-war between bulls and bears.
Key technical levels:
Support: 0.1343 (range low)
Resistance: 0.1674 (range high)
Immediate upside levels: 0.2049 – 0.2475 – 0.3180
Major supply zones: 0.3641 – 0.4874 – 0.6742
---
🟢 Bullish Scenario
If price manages to break above 0.1674 and especially confirm above 0.2049 with strong volume:
1. Signals the start of a new bullish momentum after months of accumulation.
2. Potential upside targets:
TP1: 0.2475 (intermediate resistance)
TP2: 0.3180 (strong resistance zone)
TP3: 0.3641 (major supply zone)
3. Confirmation: Daily close above 0.205, supported by a retest holding as new support + volume expansion.
4. Bullish invalidation: A failed breakout where price falls back into the box (false breakout).
---
🔴 Bearish Scenario
If price breaks down below 0.1343 (range low):
1. Indicates buyers lost control of the demand zone.
2. Downside targets:
Psychological support: 0.120 – 0.110
Measured move of the range box: points toward ~0.100
3. Bearish continuation is confirmed if breakdown comes with high volume.
4. Bearish invalidation: A quick rebound back inside the box (false breakdown).
---
🎯 Trading Implications
For swing traders: This 0.134–0.167 range offers a prime opportunity to trade the box (buy support, sell resistance) until a breakout occurs.
For trend followers: Wait for a confirmed breakout/breakdown with volume before entering, to reduce false signal risk.
Risk management: Place stops just outside the box (below 0.134 for longs, above 0.167 for shorts). Risk no more than 1–2% per trade.
---
📌 Conclusion
ID/USDT is currently in a “calm before the storm” phase. This long consolidation will soon dictate the next major trend:
A confirmed breakout could trigger a strong reversal after the prolonged downtrend.
A breakdown would likely extend the bearish cycle toward deeper lows.
Traders should stay patient and wait for daily close confirmation with volume to validate the next direction.
---
#IDUSDT #CryptoAnalysis #TechnicalAnalysis #SupportResistance #Breakout #Bearish #Bullish #Altcoins #SwingTrading #Accumulation

ID/USDT — Final Battle at the Multi-Month Downtrend Line!📌 Market Structure Overview
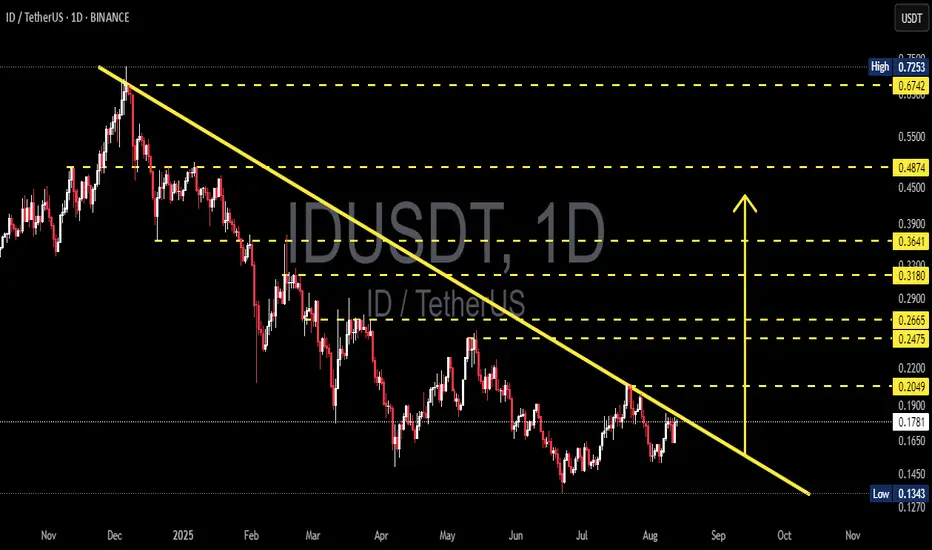
Since peaking in late 2024, ID/USDT has been trapped under a relentless multi-month downtrend line lasting almost 10 months. Every rally attempt has been shut down at this descending wall.
Now, the market is at a critical inflection point — price is pressing right against the trendline and sitting in the decision zone between 0.190–0.205.
A breakout here would not only be a technical victory for the bulls but could also trigger a shift in market psychology from seller dominance to buyer control.
---
📊 Key Levels to Watch
Major Resistances: 0.2049 → 0.2475 → 0.2665 → 0.3180 → 0.3641 → 0.4874 → 0.6742
Supports: 0.177–0.180 → 0.165 → 0.134–0.145 (major demand zone)
---
📐 Pattern & Sentiment Analysis
The dominant structure is a classic Descending Trendline Resistance, showing consistent lower highs under seller pressure.
However, there’s an early sign of sentiment shift — a higher low compared to the July bottom, suggesting that buyers are stepping in earlier and absorbing supply.
If price can close a daily candle above the trendline and 0.2049, we could see the start of a trend reversal rally toward higher resistance levels.
---
🚀 Bullish Scenario
1. Trigger: Daily close above the trendline + 0.2049.
2. Confirmation: Retest of 0.19–0.205 holds as new support.
3. Upside Targets:
Initial: 0.2475
Mid-term: 0.2665 → 0.3180
Extended: 0.3641 (psychological zone)
4. Invalidation: Closing back below 0.190 or losing 0.177–0.180.
---
📉 Bearish Scenario
1. Trigger: Sharp rejection from the trendline/0.19–0.205 zone.
2. Downside Targets:
First: 0.177–0.180
Next: 0.165
Extreme: 0.134–0.145 (historical low)
3. Invalidation: Sustained breakout above 0.205 with strong volume.
---
⚖️ Perspective & Risk Management
This is a “make or break” moment for ID/USDT.
Don’t rely solely on intraday spikes — wait for a confirmed daily close to avoid fakeouts.
Use the above S/R levels as tiered take-profit zones and for placing protective stops.
#IDUSDT #ID #Crypto #PriceAction #TechnicalAnalysis #DowntrendBreak #Breakout #SupportResistance #CryptoTrading
IDUSDT Analysis ID ~ 4D Analysis
#ID Buy on retesting this buy zone or buy on successful breakout of the resistance line of this pattern. With a short term target of at least 10%+.

#ID/USDT#ID
The price is moving in a descending channel on the 1-hour frame and is expected to continue upwards
We have a trend to stabilize above the moving average 100 again
We have a descending trend on the RSI indicator that supports the rise by breaking it upwards
We have a support area at the lower limit of the channel at a price of 0.2516
Entry price 0.2720
First target 0.2810
Second target 0.2895
Third target 0.3068

IDUSDT 5DID ~ 5D Analysis
#ID Buy gradually from here with a minimum target of 20%+
The reason, this is the lowest support for now.

#ID/USDT#ID
The price is moving in a descending channel on the 1-hour frame and is adhering to it well and is heading to break it upwards strongly and retest it
We have a bounce from the lower limit of the descending channel, this support is at a price of 0.3000
We have a downtrend on the RSI indicator that is about to break and retest, which supports the rise
We have a trend to stabilize above the moving average 100
Entry price 0.3322
First target 0.3156
Second target 0.3237
Third target 0.3322

IDUSDT 3DID ~ 3D Analysis
#ID In the 3D time frame, this is a very good support for now, Buy from here if you still have a Conviction on this coin with a minimum target of 20%+

IDUSDTID ~ 5D
#ID Make gradual purchases on this support block. With a short term target of at least 20%++. We think this is a strong enough support block to hold the price.

IDUSDTID ~ 5D
#ID If you have Conviction on this coin,. Make gradual purchases on these support blocks. with a short term target of at least 20%++

IDUSDT is the most promising altcoin, bullish ? looks very good graphically.
stronger than the market.
has a structure of hanging lows.
The trend is upward.
second year of the project

#ID/USDT#ID
The price is moving in a downward channel trend on the 12-hour frame and sticking to it well
After bouncing from a major support area in green at the 0.560 level, which is a very strong area
We have an upward trend to touch the Moving Average 100 at the third target
We have a downtrend on the RSI that is about to break higher
Entry price is 0.630
First goal: 0.710
The second goal is 0.840
The third goal is 0.970

Keep an eye on $ID/USDTDid you find this crypto market analysis helpful? Stay updated about the latest crypto market update.
Please continue to follow my analysis and feel free to ask any queries, you may have. I am here to assist you.
TradingView: @FarmanBangashh

ID Still in Accumulation! 📈🚀Hello Crypto Enthusiasts! 👋
We're shining the spotlight on (ID) that's currently playing it cool in the accumulation zone.
🎯 Initial Targets within Accumulation:
Our first set of targets? Look for them in the upper realms of the accumulation rectangle, approximately around $0.37 to $0.36.
📈 White Trend Lines: The Unyielding Forces:
These white trend lines? They're not just lines; they're formidable resistance and unshakeable support. Breaking free from the upper white trend line might just unlock higher targets, reaching into the red rectangle at around the $0.60s.
📉 Cautionary Note:
However, a word of caution – if we fail to break out of the upper trend line, brace yourself for a potential significant drop in ID's price.
Trading Essentials:
Safety First: Trade prudently, and never go all-in on a single move.
D.Y.O.R (Do Your Own Research): Knowledge is power.
🚨 Disclaimer:
This isn't financial advice; it's a friendly nudge to trade wisely and with caution.
May your trades be prosperous and your crypto journey full of good fortune! 🌌💰

IDUSDTBINANCE:IDUSDT Long idea
⛔"Daily crypto market analyses I provide are personal opinions & not financial advice. Trading carries risks, so do your own research & seek advisor's help. #DYOR
Don't forget to 🚀 and comment

IDUSDTBINANCE:IDUSDT Long idea
⛔"Daily crypto market analyses I provide are personal opinions & not financial advice. Trading carries risks, so do your own research & seek advisor's help. #DYOR"
Don't forget to like and comment.

#ID/USDT#ID
We have a perfect bullish flag targeting the upper border of the flag
We have upward momentum and there are target areas that can act as resistance zones
We have a clear breakout of the Moving Average 100
Current price 0.28800
First target 0.31290
Second target 0.35100
Which represents 170% of the current price

Long trade setup for IDUSDTFor the BINANCE:IDUSDT.P BINANCE:RSRUSDT.P Long Trade Setup, the following values are suitable for our interval trade:
Entry: 0.2368
Target: 0.2612
Stop: 0.2285
Cost Reduction: -
The profit is reasonable relative to the risk.

UPTADE: Long trade setup for IDUSDT🚀 #IDUSDT Update: We initially predicted it would take 20-24 hours to achieve this gain, but the results came in much faster than expected. A handsome 6.14% profit - just the right fit for our pockets! We're closing the trade and recommend you do the same. Strike fast, earn big with us! 💸
*Capital at risk.

ID CONFIRMS NEW VOLUMEID seems to confirm the new volume.
Today and the coming days can be important.
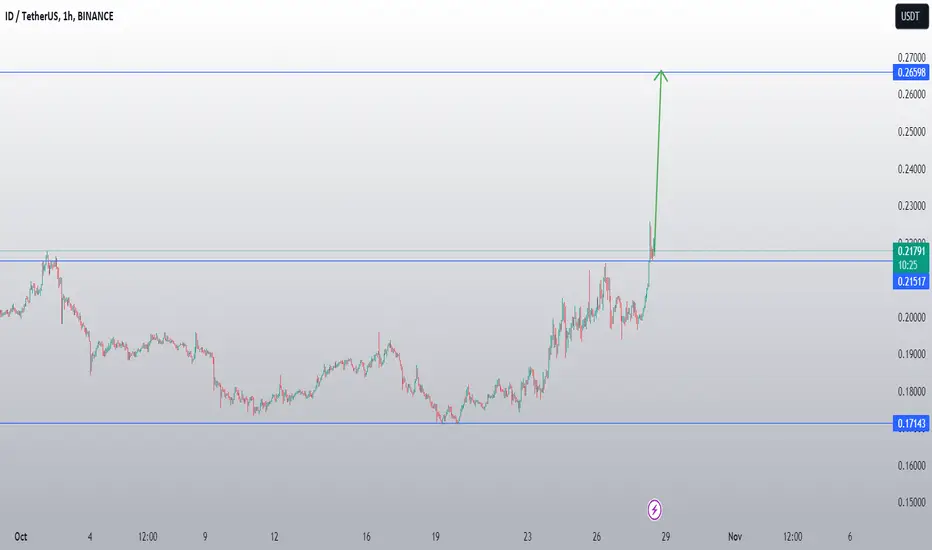
ID/USDT - Space ID: BBand_Breakout◳◱ A Bollinger Band breakout has been identified on the AMEX:ID / CRYPTOCAP:USDT chart, as the price has breached the upper Bollinger Band. This occurrence suggests the emergence of a potential bullish trend. Noteworthy resistance levels can be observed at 0.1952 | 0.20804 | 0.23303, while significant support zones are located at 0.17021 | 0.15806 | 0.13307. It is advisable to contemplate initiating a buy position within the present price range of 0.21979 with the objective of attaining higher price levels.
◰◲ General info :
▣ Name: Space ID
▣ Rank: 284
▣ Exchanges: Binance, Kucoin, Bybit, Huobipro, Gateio, Mexc
▣ Category/Sector: N/A
▣ Overview: Space ID project overview is currently unavailable. I'll try to update this in the upcoming analysis.
◰◲ Technical Metrics :
▣ Mrkt Price: 0.21979 ₮
▣ 24HVol: 8,865,961.958 ₮
▣ 24H Chng: 10.204%
▣ 7-Days Chng: 22.54%
▣ 1-Month Chng: 11.16%
▣ 3-Months Chng: -12.35%
◲◰ Pivot Points - Levels :
◥ Resistance: 0.1952 | 0.20804 | 0.23303
◢ Support: 0.17021 | 0.15806 | 0.13307
◱◳ Indicators recommendation :
▣ Oscillators: SELL
▣ Moving Averages: STRONG_BUY
◰◲ Technical Indicators Summary : BUY
◲◰ Sharpe Ratios :
▣ Last 30D: -22.80
▣ Last 90D: -18.61
▣ Last 1-Y: -17.35
▣ Last 3-Y: -18.15
◲◰ Volatility :
▣ Last 30D: 0.38
▣ Last 90D: 0.55
▣ Last 1-Y: 0.85
▣ Last 3-Y: 1.28
◳◰ Market Sentiment Index :
▣ News sentiment score is N/A
▣ Twitter sentiment score is 0.74 - Bullish
▣ Reddit sentiment score is 0.52 - Bullish
▣ In-depth IDUSDT technical analysis on Tradingview TA page
▣ What do you think of this analysis? Share your insights and let's discuss in the comments below. Your like, follow and support would be greatly appreciated!
◲ Disclaimer
Please note that the information and publications provided are for informational purposes only and should not be construed as financial, investment, trading, or any other type of advice or recommendation. We encourage you to conduct your own research and consult with a qualified professional before making any financial decisions. The use of the information provided is solely at your own risk.
▣ Welcome to the home of charting big: TradingView
Benefit from a ton of financial analysis features, instruments and data. Have a look around, and if you do choose to go with an upgraded plan, you'll get up to $30.
Discover it here - affiliate link -

ID coin is on the long list with the level of 0.021976Hello everyone!!!
AIHermes today identified the coin ID on the long list with the level of 0.021976
Entry model - breakout! Leverage 10-20X
Stop is short.
We see a long accumulation and a gorgeous squeeze!
1st target 0.2349
Trade with us, trade better than us!
Today:
17 coins on the long list
11 coins on the short list.
Lead in the short zone.
The full list of coins is delivered by our bot every day at 9.00 am
