INET watch for support before 2Jan26 Right IssueINET 28DEC25 before right issue
1. Regresi support at 725
2. Support reguler 650-665
www.tradingview.com
Ihsg

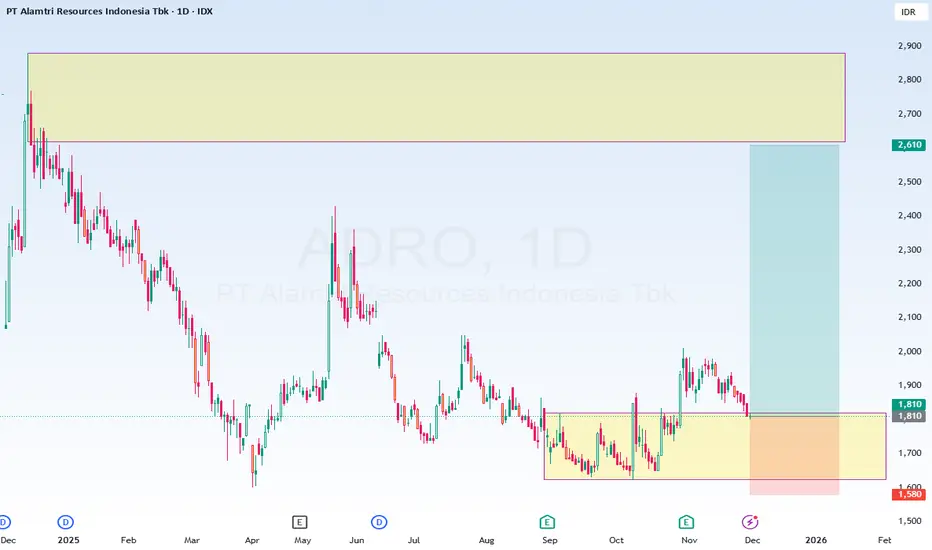
ADRO Trade Setup – Bullish BiasADRO is showing early bullish signs, including a structural break (CoC) on the Daily Timeframe, a retracement into supply, and support from a daily base zone. The planned entry at 1810 offers a favorable risk–reward profile, with stops safely below structure and targets aligned just under the next supply zone.
Technical Context
1. Change of Character (CoC) → On the daily timeframe, price broke the previous high at 1880, signaling a potential shift in market structure toward bullish momentum.
2. Retracement to Supply Zone → Price has pulled back into the September monthly supply zone, offering a possible area of reaction.
3. Previous Base Zone (Daily) → Current price action is also sitting on a daily base zone, reinforcing confluence for a potential bullish continuation.
Trade Plan
Entry 1810
Stop Loss 1580
Target 2600
Risk (pts) 230
Reward (pts) 790
R:R Ratio 3.4x
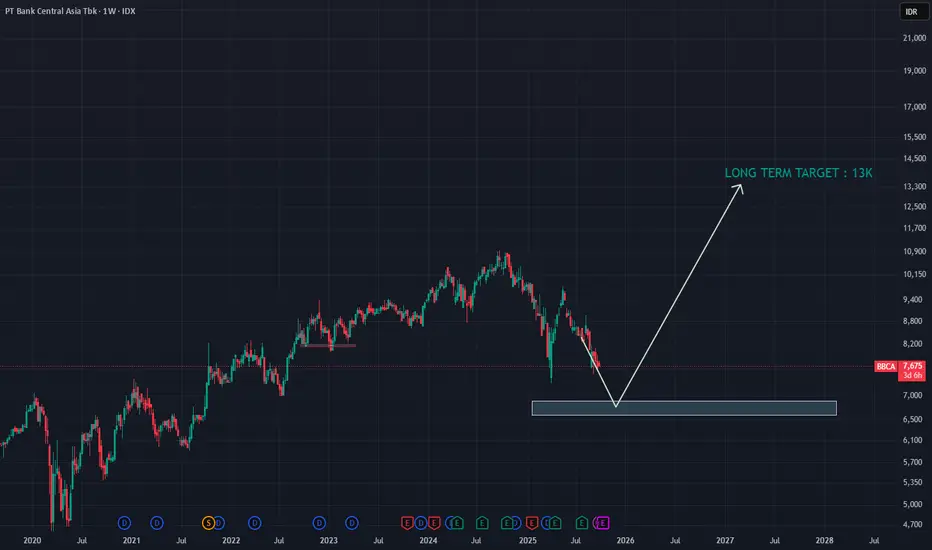
Stock BBCA Hi all,
Just an idea..
for BBCA sangkuters & longterm holders..
Maybe if you have extra cash, can make entry to strong support around 6.6-7k..
Then you can hold for another 2-3 years..
your extra longterm target would be 13k..
Have a nice day..
$MHKI - Inverted Head and Shoulder?So, the chart doesn't really show that it's forming an inverted head and shoulders pattern yet. But if you look at the moving averages, this stock is still above the 10 and 20 moving averages, which means it's still in a decent uptrend on the daily timeframe.
This could be a chance to make a speculative buy with the stop loss mentioned above!
Tradeplan:
Buy 159 - 156
Stoploss < 151

MEDS - rebound from supply area IDX:MEDS
In terms of trend, it's starting to move from sideways to an uptrend. The structure that's forming looks pretty solid, with the supply area that was previously broken now successfully turning into a demand area, as shown by the stock price rebounding in that area.
For the 1-hour intraday timeframe, there's also a golden cross happening between the 10 and 20 SMA.
Buying Area: Feel free to buy near the 3, 5, or 10 MA.
For Stoploss, if it can’t hold above the demand area below.
This trade plan has a Risk:Reward ratio of 1:2.56.That makes this stock pretty interesting to trade.

$PTROthey managed to rebound from her RBS area, which also happens to be the support area of her trendline.

BWPT - POWER PLAYIDX:BWPT - POWER PLAY
(+)
Low risk entry point on a pivot level.
Volume dries up.
Price has been above the MA 50 for over 10 weeks, with values exceeding 150 and 200
Price is within 25% of its 52-week high.
Price is over 25% of its 52-week low.
The 200-day MA has been trending upwards for over a month.
The RS Rating is above 70 (93).
The price shoot up by 147% and paused only for 18%, indicating a strong uptrend
EPS Growth:
a. Quarterly QoQ: +50.04%.
b. Quarterly YoY: +42.82%.
c. TTM YoY: +40.10%.
d. Annual YoY: +47.25%.

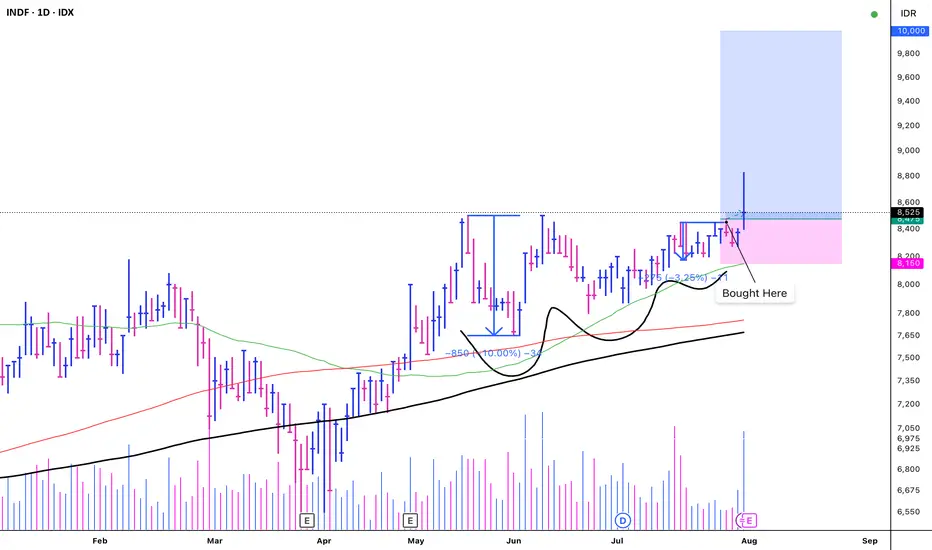
INDF - VCP (13W 10/3 3T)IDX:INDF - VCP
+)
1. Low risk entry point on a pivot level.
2. Volume dries up.
3. Price has been above the MA 50 > 150 > 200
4. Price is within 25% of its 52-week high.
5. Price is over 25% of its 52-week low.
6. The 200-day MA has been trending upwards for over a month.
7. The RS Rating is above 70 (71).
EPS Growth:
a. Quarterly QoQ: -
b. Quarterly YoY: +11.20%.
c. TTM YoY: +32.14%.
d. Annual YoY: +6.07%.
(-)
1. There is no significant breakout with substantial volume.
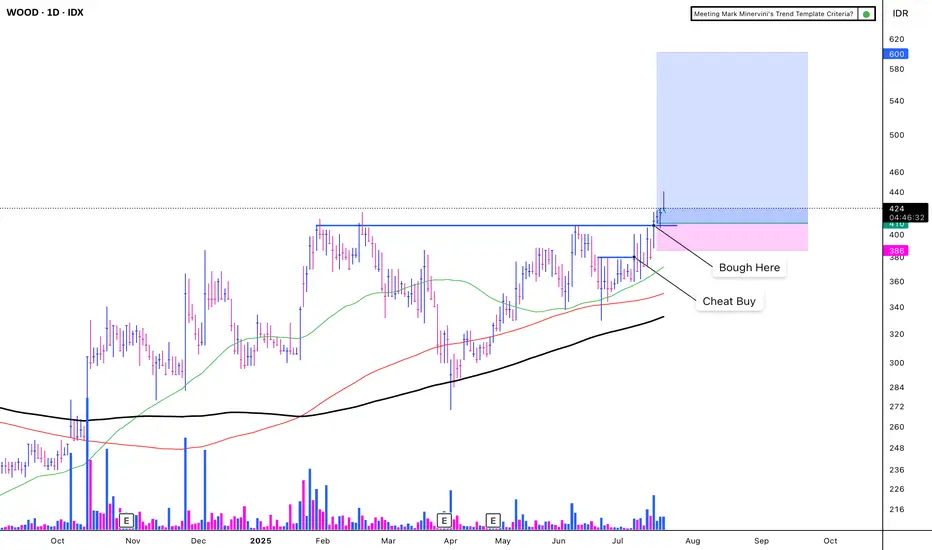
WOOD - CUP WITH HANDLEIDX:WOOD - CUP WITH HANDLE
(+):
1. Low risk entry point
2. Volume dries up.
3. Price has been above the MA 50 for over 10 weeks, with values exceeding 150, 200, and 300.
4. Price is within 25% of its 52-week high.
5. Price is over 30% of its 52-week low.
6. The 200-day MA has been trending upwards for over a month.
7. The RS Rating is above 70 (85).
8. Carbon sales increase 503%
9. Price breakout with VCP criteria
EPS Growth:
a. Quarterly QoQ: -13.24%.
b. Quarterly YoY: +68.81%.
c. TTM YoY: +49.09%.
d. Annual YoY: +33.27%.
(-)
Trump Implements a 32% Increase in Tariffs on Indonesia
The market is volatile due to the ongoing war
TAPG - VCP (11W 18/4 3T)IDX:TAPG - VCP
(+):
1. Low risk entry point on a pivot level.
2. Volume dries up.
3. Price has been above the MA 50 for over 10 weeks, with values exceeding 150, 200, and 300.
4. Price is within 25% of its 52-week high.
5. Price is over 30% of its 52-week low.
6. The 200-day MA has been trending upwards for over a month.
7. The RS Rating is above 70 (86).
8. There has been a significant breakout with substantial volume
**EPS Growth:**
a. Quarterly QoQ: -46.42%.
b. Quarterly YoY: +117.27%.
c. TTM YoY: +111.05%.
d. Annual YoY: +94.02%.
(-)
1. Trump Implements a 32% Increase in Tariffs on Indonesia
2. The market is volatile due to the ongoing war

DKFT - POWER PLAYIDX:DKFT - POWER PLAY
(+)
1. Low risk entry point on a pivot level.
2. Volume dries up.
3. Price has been above the MA 50 for over 10 weeks, with values exceeding 150, 200, and 300.
4. Price is within 25% of its 52-week high.
5. Price is over 30% of its 52-week low.
6. The 200-day MA has been trending upwards for over a month.
7. The RS Rating is above 70 (98).
8. There has been a significant breakout with substantial volume with VCP There has been a significant breakout with substantial volume, with VCP characteristic.
9. The price shoot up by 102% and paused only for 18%, indicating a strong uptrend
**EPS Growth:**
a. Quarterly QoQ: +79.70%.
b. Quarterly YoY: +819.89%.
c. TTM YoY: +356.12%.
d. Annual YoY: +484.31%.
(-)
1. Trump Implements a 32% Increase in Tariffs on Indonesia
2. The market is volatile due to the ongoing war

BNLI - VCP (11W 21/4 3T)IDX:BNLI - VCP
(+)
1. Low risk entry point on a pivot level.
2. Volume dries up.
3. Price has been above the MA 50 for over 10 weeks, with values exceeding 150, 200, and 300.
4. Price is within 25% of its 52-week high.
5. Price is over 30% of its 52-week low.
6. The 200-day MA has been trending upwards for over a month.
7. The RS Rating is above 70 (98).
8. There has been a significant breakout with substantial volume.
9. The price surged up by 150% and paused only for 24%, indicating a strong uptrend.
10. The stock is the leader of its sector.
**EPS Growth:**
a. Quarterly QoQ: +0.96%.
b. Quarterly YoY: -2.27%.
c. TTM YoY: +34.60%.
d. Annual YoY: +38.06%.
(-)
1. The major market is focused on Danantara and Hilirisasi stocks.

SCMA offers good R:R from this levelPrice is completing its ABC correction and right now attached exactly at the 78.6% fibo level.
After ABC correction is complete, next bullish move should aim to 330-350, minimum target is closing the GAP at 200-210.

TRUK - VCP (118W 66/27 3T)IDX:TRUK - VCP
(+):
1. Low risk entry point on pivot level
2. Volume dries up
3. Price above MA 50 > 150 > 200 over 10 weeks
4. Price is within 25% of 52 weeks high
6. Price is over 30% of 52 weeks low
7. 200 day MA trending up over 1 month
8. RS Rating is over 70 (84)
9. Breakout with huge volume
(-)
1. There is nothing good with the fundamental

IHSG / COMPOSITE (IDX) DAILY CHART DOUBLE TOP DETECTEDIHSG going to close the gap at 65xx.. (first gap).
the worst case IHSG will close the 2nd gap (61xx) << Mostly happened.
after that we hope IHSG will start to Bullish once more.
so just wait n see for now. After IHSG closing all the gap, we can start buying all the bluchip stock like banking sector (BBRI, BBCA, BMRI, BBNI).

BREN 20/6/25With Danantara focusing on 8 sector points, with one of them is Renewable Energy. IDX:BREN is now very interesting, with the inverted head n shoulder that gave us a reversal signal. BREN is now very cheap, as the 3rd biggest market cap on IDX. #FREEBANDZ

JARR VCP - (144W 80/28 4T)IDX:JARR - VCP
(+):
1. Low risk entry point on pivot level
2. Volume dries up
3. Price above MA 50 > 150 > 200 over 10 weeks
4. Price is within 25% of 52 weeks high
6. Price is over 30% of 52 weeks low
7. 200 day MA trending up over 1 month
8. RS Rating is over 70 (85)
9. EPS Growth:
a. Quarterly QoQ: +56.12%
b Quarrerly YoY: +255.56%
b. TTM YoY: +208.21%
c. Annual YoY: +237.44%
10. Breakout with huge volume
(-)
1. Nothing, just perfect :)

PSAB - CUP WITH HANDLEIDX:PSAB - CUP WITH HANDLE
(+):
1. Low risk entry point on pivot level
2. Volume dries up
3. Price above MA 50 > 150 > 200 over 10 weeks
4. Price is within 25% of 52 weeks high
6. Price is over 30% of 52 weeks low
7. 200 day MA trending up over 1 month
8. RS Rating is over 70 (92)
9. EPS Growth:
a. Quarterly QoQ: +47.80%
b. Quarterly YoY: +436.36%
b. TTM YoY: +436.36%
c. Annual YoY: +197.07%
10. Breakout with huge volume
11. Gold price is all time high, but this stock is still lagging
(-)
1. Need to break another high, to let this stock all time high

SAME - VCP (10W 25/5 3T)IDX:SAME - VCP
(+):
1. Low risk entry point on pivot level
2. Volume dries up
3. Price above MA 50 > 150 > 200 over 10 weeks
4. Price is within 25% of 52 weeks high
6. Price is over 30% of 52 weeks low
7. 200 day MA trending up over 1 month
8. RS Rating is over 70 (80)
9. 9. EPS Growth:
a. Quarterly QoQ: +852.30%
b. Quarterly YoY: +570.99%
b. TTM YoY: -3.34%
c. Annual YoY: -3.36%
(-)
1. Breakout with huge volume but long wick
Note: I will sell half if hit first Stop Loss, and sell remaining on the last stop loss on first cheat buy

IHSG AFTER BREAKMarket globally is crashed because of the new tariff that US applied. IHSG might as well crashed after this break, approaching 58xx. But i believe after this correction IHSG Will back in action and reach 67xx.

IHSG 36000IHSG will go to 36000
Currently, the prediction for the Jakarta Composite Index (JCI) is still far from 36,000. Based on the latest analysis, the JCI is estimated to move in the range of 6,800 to 7,150 in the short term. Positive sentiment from the trade deal between the United States and China has indeed provided encouragement, but this strengthening is still considered limited and prone to technical corrections. If there are major factors that can push the JCI to a much higher level, such as extraordinary economic growth or a surge in foreign investment, then there may be an opportunity to achieve a more ambitious figure. However, for now, the realistic target is still in the range mentioned.

MFIN - VCP (16W 41/18)IDX:MFIN - VCP
(+):
1. Low risk entry point on pivot level
2. Volume dries up
3. Price above MA 50 > 150 > 200 over 10 weeks
4. Price is within 25% of 52 weeks high
6. Price is over 30% of 52 weeks low
7. 200 day MA trending up over 1 month
8. RS Rating is over 70 (95)
9. EPS Growth:
a. Quarterly QoQ: +22.24%
b Quarrerly YoY: +185.92%
b. TTM YoY: +22.24%
c. Annual YoY: +23.08%
(-)
1. Breakout with red candle
2. Lack of liquidity

TAPG - VCP (20/5 3T)IDX:TAPG VCP
(+):
1. Low risk entry point on pivot level
2. Volume dries up
3. Price above MA 50 > 150 > 200 over 10 weeks
4. Price is within 25% of 52 weeks high
6. Price is over 30% of 52 weeks low
7. 200 day MA trending up over 1 month
8. RS Rating is over 70 (84)
9. Biggest net income +197.70% on Q4 2024 vs Q4 2023
(-)
1. Breakout with huge volume but created long red candle
