#HOT/USDT Ready to go up#HOT
The price is moving within a descending channel on the hourly timeframe. It has reached the lower boundary and is heading towards a breakout, with a retest of the upper boundary expected.
The Relative Strength Index (RSI) is showing a downward trend, approaching the lower boundary, and an upward bounce is anticipated.
There is a key support zone in green at 0.000380. The price has bounced from this level several times and is expected to bounce again.
The RSI is showing a trend towards consolidation above the 100-period moving average, which we are approaching, supporting the upward move.
Entry Price: 0.0003387
Target 1: 0.000400
Target 2: 0.000410
Target 3: 0.000423
Stop Loss: Below the green support zone.
Remember this simple thing: Money management.
For any questions, please leave a comment.
Thank you.
Ilovetrading

#HOT/USDT is about to blast off! Study internet bubble stocks.#HOT
The price is moving in a descending channel on the 1-hour timeframe. It has reached the upper limit and is heading towards breaking downwards, with a retest of the upper limit expected.
We have an upward trend on the RSI indicator, which has reached near the upper limit, and a downward reversal is expected.
There is a major resistance zone in green at 0.000587. The price has bounced from this zone multiple times and is expected to bounce again.
We have a trend of consolidation above the 100-period moving average, as we are moving close to it, which supports a downward move towards touching it.
Entry price: 0.000540
First target: 0.000532
Second target: 0.000520
Third target: 0.000507
Stop loss: Above the resistance zone in green.
Don't forget a simple thing: capital management.
For inquiries, please leave a comment.
Thank you.

#HOT/USDT Ready to go up#HOT
The price is moving in a descending channel on the 1-hour timeframe. It has reached the lower boundary and is heading towards a breakout, with a retest of the upper boundary expected.
We are seeing a bearish trend in the Relative Strength Index (RSI), which has reached near the lower boundary, and an upward bounce is expected.
There is a key support zone in green at 0.000443, and the price has bounced from this level several times. Another bounce is expected.
We are seeing a trend towards stabilizing above the 100-period moving average, which we are approaching, supporting the upward trend.
Entry Price: 0.000478
First Target: 0.000492
Second Target: 0.000510
Third Target: 0.000534
Remember a simple principle: Money Management.
Place your stop-loss order below the green support zone.
For any questions, please leave a comment.
Thank you.

Scor/UsdtGATE:SCORUSDT
🔴 **Key Resistance** at **0.010045** (price recently rejected here)
🟢 **Support Zone** between **0.009711** and **0.009500**
📉 Price is currently consolidating after a slight pullback.
🎯 A clear break above resistance could target **0.011056** next
⚠️ If support breaks, watch **0.008967** as the next major level
⚡ **Quick Take:**
- Consolidation phase underway
- Next major move depends on which level breaks first
- Volume is moderate—wait for confirmation on breakout
Remember: This is not financial advice—always do your own research! 📈🔍

#HOT/USDT — Testing Demand Zone: Major Accumulation or Breakdo#HOT
The price is moving in a descending channel on the 1-hour timeframe. It has reached the lower boundary and is heading towards breaking above it, with a retest of the upper boundary expected.
We have a downtrend on the RSI indicator, which has reached near the lower boundary, and an upward rebound is expected.
There is a key support zone in green at 0.000490. The price has bounced from this zone multiple times and is expected to bounce again.
We have a trend towards consolidation above the 100-period moving average, as we are moving close to it, which supports the upward movement.
Entry price: 0.000517
First target: 0.000529
Second target: 0.000545
Third target: 0.000567
Don't forget a simple principle: money management.
Place your stop-loss below the support zone in green.
For any questions, please leave a comment.
Thank you.

#HOT/USDT — Testing Demand Zone: Major Accumulation or Breakdo#HOT
The price is moving in a descending channel on the 1-hour timeframe and is expected to break out and continue upwards.
We have a trend to stabilize above the 100-period moving average again.
We have a downtrend on the RSI indicator, which supports an upward move if it breaks above it.
We have a key support zone in green that pushed the price higher at 0.000561.
Entry price: 0.000592
First target: 0.000614
Second target: 0.000647
Third target: 0.000682
For risk management, don't forget stop-loss orders and capital management.
The stop-loss is below the support zone in green.
Upon reaching the first target, take some profits and then change the stop-loss order to an entry order.
For any questions, please comment.
Thank you.

#HOT/USDT#HOT
The price is moving within a descending channel on the 1-hour frame, adhering well to it, and is heading for a strong breakout and retest.
We are experiencing a rebound from the lower boundary of the descending channel. This support is at 000873.
We are experiencing a downtrend on the RSI indicator, which is about to break and retest, supporting the upward trend.
We are in a trend of consolidation above the 100 moving average.
Entry price: 0.000888
First target: 0.000910
Second target: 0.000933
Third target: 0.000958

#HOT/USDT#HOT
The price is moving within a descending channel on the 1-hour frame and is expected to break and continue upward.
We have a trend to stabilize above the 100 moving average once again.
We have a downtrend on the RSI indicator that supports the upward move with a breakout.
We have a support area at the lower boundary of the channel at 0.000945, acting as strong support from which the price can rebound.
Entry price: 0.000948
First target: 0.000984
Second target: 0.000998
Third target: 0.001020

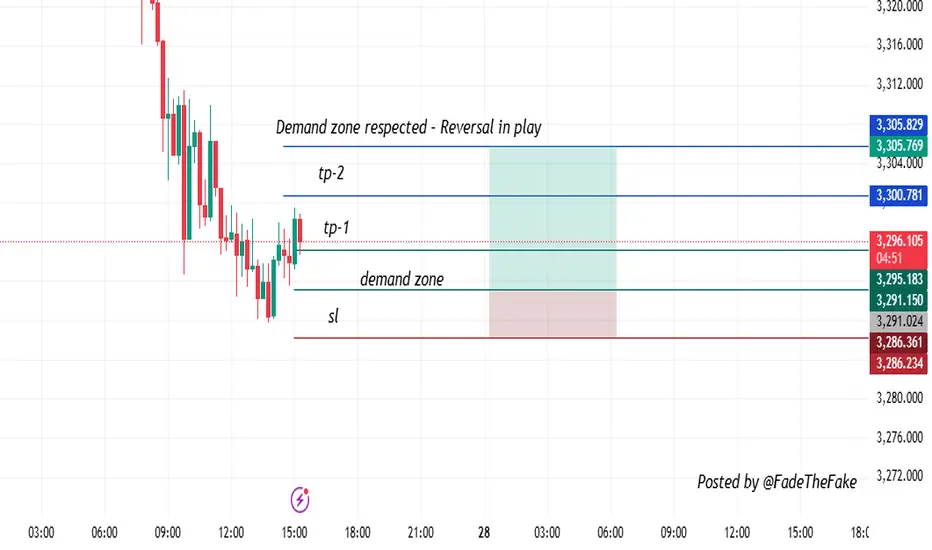
Structure Shift at Key Support – Is the Bullish Reversal InPrice aggressively broke down recently but showed strong reaction near the 3,280–3,290 demand zone, reflecting potential buyer absorption at lower prices. Following several bearish attempts that failed, price started making higher lows, reflecting a change in short-term structure.
Trade Idea:
Expecting a bullish reversal from this demand zone with a clean RR setup.
Entry Zone: 3,290–3,292 (bullish confirmation candle or wick rejection)
Stop Loss: 3,280 (below liquidity sweep & structure low)
Take Profit Targets:
• TP1: 3,300 – intraday bounce zone
• TP2: 3,305 – mid-level resistance
• TP3: 3,310 – structural breakout area
Why this setup?
✅ Structure shift (higher lows)
✅ Demand zone tapped with strong wick rejection
✅ Clean RR with risk tightly managed
✅ No major macro resistance until 3,310
Risk Note:
Steer clear of early entries without confirmation. If price doesn't hold above 3,288, bearish continuation is still in play.
#HOT/USDT#HOT
The price is moving within a descending channel on the 1-hour frame, adhering well to it, and is heading for a strong breakout and retest.
We are seeing a bounce from the lower boundary of the descending channel, which is support at 0.001240.
We have a downtrend on the RSI indicator that is about to be broken and retested, supporting the upward trend.
We are looking for stability above the 100 moving average.
Entry price: 0.001346
First target: 0.001415
Second target: 0.001500
Third target: 0.001607

AUD/CHF, Short, 8hAUD/CHF has hit a strong resistance at 0.5726 and is now rejecting this level. A pullback is already in progress, and the price is expected to decline toward the key support at 0.56674.
SHORT 🔥
✅ Like and subscribe to never miss a new analysis! ✅

USDCHF trade IdeaUSDCHF was on a downtrend before but then reversed and broke structure. It's now giving us what seems to be a head and shoulders. Anticipating for the market to continue going to the upside

#HOT/USDT#HOT
The price is moving in a descending channel on the 1-hour frame and is expected to continue upwards
We have a trend to stabilize above the moving average 100 again
We have a descending trend on the RSI indicator that supports the rise by breaking it upwards
We have a support area at the lower limit of the channel at a price of 0.001950
Entry price 0.002000
First target 0.002107
Second target 0.002210
Third target 0.002346

GBPJPY Trade IdeaWe have what could be a build up for a possible buy on GBPJPY. We have a short term bullish trend inside our overall bullish trend. There was a break above a key level, a pull back followed by a rejection on that key zone will be a confirmition of a buy, anticipating for the market to push to the upside

AUDJPY Trade Idea After giving a double top rejection, AUDJPY violated structure and broke below a key level followed a retest and a rejection. An anticipated move to the downside has been confirmed.

NAS100 Trade ideaNAS100 is on an up trend and is breaking above key levels while continuing to respect structure. Price has just broken above a key level and gave a retest followed by a double bottom rejection to confirm a buy entry

USDCHF Trade IdeaUSDCHF has been on an uptrend and is breaking above keys levels. Patiently waiting for the market to retest the previously broken key level for a possible entry

#HOT/USDT Ready to go up#HOT
The price is moving in a descending channel on the 1-hour frame and sticking to it well
We have a bounce from the lower limit of the descending channel, this support is at 0.002700
We have a downtrend on the RSI indicator that is about to break, which supports the rise
We have a trend to stabilize above the moving average 100
Entry price 0.003323
First target 0.003700
Second target 0.004027
Third target 0.004440

Not/UsdtBINANCE:NOTUSDT
NOT
PA is following exactly my lines!
Bullish retest weekly, i'm confident and you? 🚀
Disclaimer : Not financial Advice

@HINDALCO long term inverstment call
🧲🧲🧲🧲🧲🧲🧲🧲🧲🧲🧲
HINDALCO
BUYING RANGE - 750-752
STOPLOSS 745
TARGET 770/795/832+++

#HOT/USDT#HOT
The price is moving in a descending channel on the 12-hour frame and is sticking to it to a large extent and it was broken upwards
We have a bounce from the lower limit of the channel price 0.001440
We have an upward trend on the RSI indicator which supports the rise
We have a trend to stabilize above the moving average 100
Entry price 0.001600
First target 0.001800
Second target 0.001957
Third target 0.002135

EURUSDHello Traders!
What are your thoughts on EURUSD ?
EURUSD is currently moving within an ascending channel and approaching the key support zone near the channel's bottom. As long as the price does not close below this support level, the uptrend is expected to continue, with the potential for a bounce from this area. A break below the support level could indicate a shift in the trend.
If you found this analysis helpful, don’t forget to like and share your thoughts in the comments! ❤️

GBPJPY TRADE IDEAGBPJPY continues to be on a bullish trend while breaking above key levels and respecting structure all at once. A break above and retest of a key level to confirm the continuation of the trend and a push to the upside
