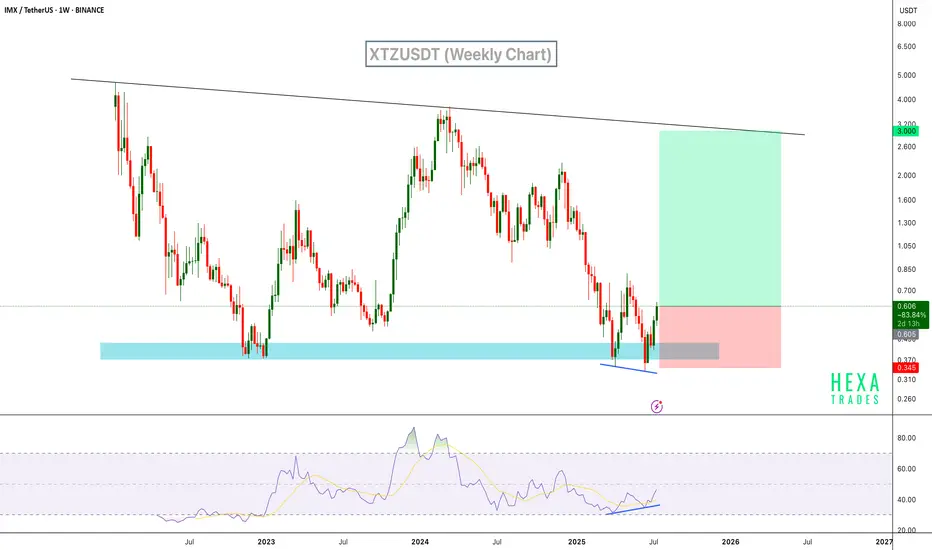
IMX still can reach new all time highOf course only if we will see some momentum from GameFI sector!
Analysis with investments zones pretty simple! Fib levels and now we are in accumulation zone!
Yearly open 2025 will be like resistance and 1.61 lvl will be like a last target for ath.
IMXUSDT

IMXUSDT — On the Edge of a Major Reversal: Accumulation or Trap?After a prolonged downtrend since 2022, Immutable X (IMX) is once again testing the critical accumulation zone between 0.48 – 0.38 USDT — a price area that has repeatedly acted as a major turning point in the past.
This yellow demand block now represents the last stronghold of buyers, where every dip has historically triggered strong rebounds marked by long lower wicks — a clear sign of buying absorption and smart money activity.
For now, IMX remains trapped within a large consolidation range, capped by resistance around 0.75 USDT.
Whether the price breaks out or breaks down from this range will likely determine IMX’s trajectory for the months ahead.
---
Pattern & Structural Analysis
Primary trend: Long-term bearish, but currently showing signs of potential base formation.
Demand Zone (Yellow Block): 0.48 – 0.38 USDT, acting as the main accumulation area.
Key Resistance: 0.75 USDT — a breakout above this level could mark the start of a trend reversal.
Long Lower Wicks: Indicate liquidity sweeps and strong absorption by buyers.
Market Structure: Sideways range — a transitional phase between distribution and potential accumulation.
---
Bullish Scenario (Reversal Setup)
A decisive close above 0.75 USDT, backed by increasing volume, would confirm the start of a new bullish phase.
First upside target sits at 1.14 USDT, followed by 2.35 USDT — a major macro resistance zone.
The structure would shift from range-bound to higher highs and higher lows, signaling clear bullish control.
Confirmation trigger: Formation of a higher low above 0.65 after breakout — indicating sustainable momentum.
---
Bearish Scenario (Breakdown from Accumulation Zone)
If price closes below 0.38 USDT on the 6D timeframe, it would invalidate the current accumulation range.
This breakdown could lead IMX to revisit 0.21 – 0.25 USDT, aligning with previous historical lows.
Such a move would confirm a capitulation phase before any major reversal takes place.
---
Psychological & Macro Perspective
IMX is likely in its “disbelief zone” — the phase where the majority lose interest, yet smart money quietly begins accumulation.
The reaction inside the 0.48 – 0.38 USDT demand zone will determine the next macro direction:
either the beginning of a long-term reversal, or the final flush before true recovery.
---
Conclusion
The 0.48 – 0.38 USDT zone is a decisive battleground between bulls and bears.
As long as IMX holds above this block, the reversal potential remains alive.
A confirmed breakout above 0.75 USDT could trigger a multi-month rally.
However, a breakdown below 0.38 would likely lead to another bearish leg toward 0.21 USDT.
---
#IMX #ImmutableX #IMXUSDT #CryptoAnalysis #SmartMoney #TechnicalAnalysis #AccumulationZone #SwingTrade #CryptoTA #PriceAction

IMX - BULLISH SEED_DONKEYDAN_MARKET_CAP:IMX - bullish structure 📈
Price is likely to fly soon! 🚀
Bullish above 0.750$ (daily basis).
Lower key support:
0.720 - 0.680 - 0.660

#IMX/USDT#IMX
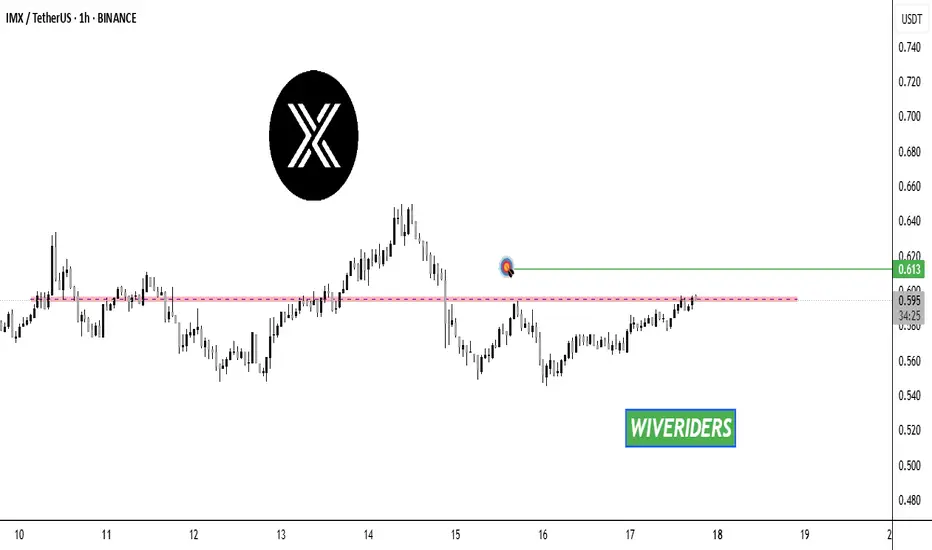
The price is moving within a descending channel on the 1-hour frame, adhering well to it, and is heading for a strong breakout and retest.
We are seeing a bounce from the lower boundary of the descending channel, which is support at 0.599.
We have a downtrend on the RSI indicator that is about to be broken and retested, supporting the upward trend.
We are looking for stability above the 100 moving average.
Entry price: 0.602
First target: 0.649
Second target: 0.682
Third target: 0.721

IMX HOLDING THE MAIN TREND AND CAN RETURN HUGE - UPDATE 28-05IMX/USDT Trading Update
🔹 Main trend holding: IMX is holding its main trend support, which is a very important signal for keeping the broader uptrend intact.
🔻 It did lose the low time frame trend and corrected from $0.83 down to the $0.70–$0.75 zone.
🔄 However, holding the main trend gives strong potential that the low time frame trend may return in the coming sessions.
🎯 First target: If recovery continues, the first upside target is set at $1.00, marking a full rebound from this cycle.
📌 Summary:
Despite losing momentum on the low time frame, IMX remains positive as long as it holds the main trend. Expectation stays bullish with the next target toward $1.00.

IMX Market Update📊 IMX Market Update
IMX has formed a bearish Head & Shoulders pattern ⚠️
Now we need to watch the red resistance zone 🔴 — this level lines up with the right shoulder of the pattern.
Only a breakout above here with confirmation could signal strength again.

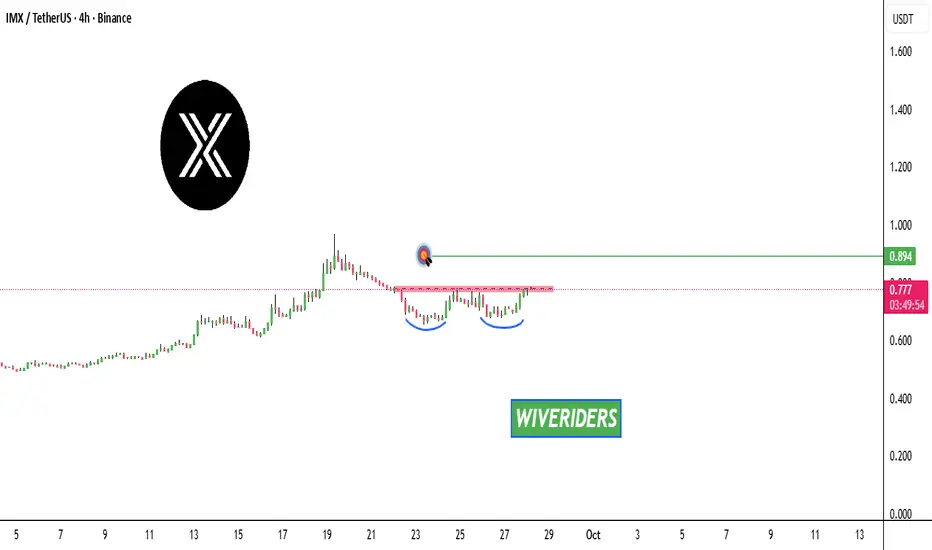
IMX is forming a bullish Double Bottom pattern 📊 IMX Market Update
IMX is forming a bullish Double Bottom pattern 📈
It’s now testing the red resistance zone 🔴 — if it breaks out with confirmation, the first target will be the green line level 🎯
IMX ABOUT TO BREAK MAIN LEVEL ON WAY - UPDATE 27-09-2025📊IMX/USDT Update
IMX has successfully moved above the low time frame zone, showing early signs of strength.
Price is now approaching the main trend level (around 0.708 – 0.715). This is the critical zone where confirmation could trigger the next bigger move.
Key levels:
0.708 – 0.715 → main trend resistance. Breakout here would confirm strength.
0.654 → cycle support. As long as this level holds, the bullish structure remains valid.
0.969 – 1.00 → breakout target zone.
Upside scenario:
If IMX clears the main trend zone, probability increases for a breakout rally toward $0.95 – $1.00.
Downside risk:
If IMX fails to break the main trend and falls back below 0.708, sideways consolidation could continue, with 0.654 as the must-hold support.
📌 Summary
IMX is above the low time frame zone → momentum is improving.
Main trend breakout above 0.715 = increased probability of rally.
Target: $0.95 – $1.00 if breakout is confirmed.
Support: $0.654 remains the cycle base.

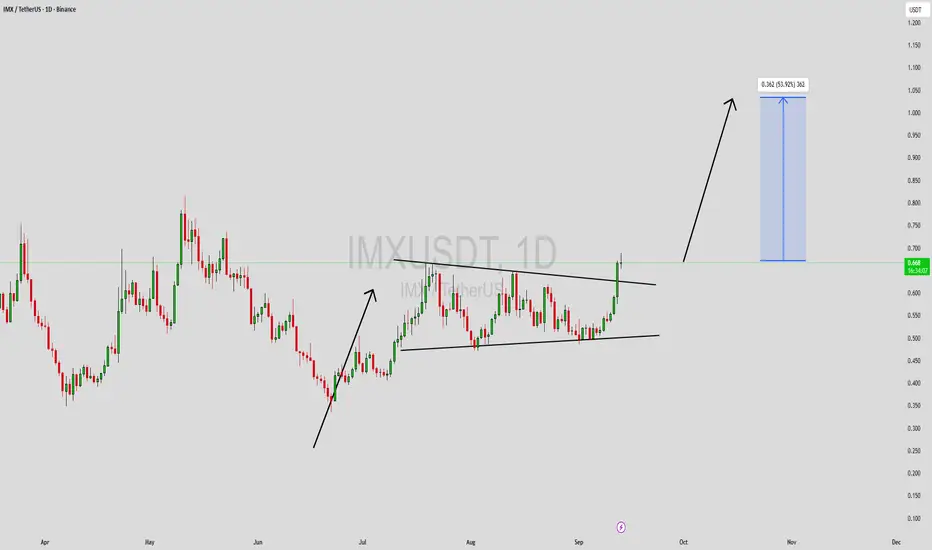
CYCLE UPDATE IMX/USDT AFTER CONFIRMATION TO up $2 in 2025📊Immutable - IMX/USDT – Cycle Update 2025
IMX has completed a long accumulation phase after months of sideways trading and is now entering a new cycle structure.
It happened before from the same trend line
Upside scenario:
A sustained reclaim above 0.70 – 0.75 signals strength and could trigger the start of the new volume.
From there, the next major resistance levels to watch are 1.40 (mid-cycle confirmation) and 2.00 – 2.25 (cycle target).
Cycle projection:
As shown on the chart, IMX could accelerate from the cycle base into a parabolic run toward $2.00+ in 2025.
First test will be a reclaim of $1.00+, followed by momentum expansion once $1.40 is cleared.
📌 Summary
Cycle breakout zone: $0.70 – $0.75.
Mid-cycle confirmation: ~$1.40.
2025 cycle target: $2.00 – $2.25.

IMX/USDT THE BREAK IS NOT FAR 26/09/2025 update📊IMX/USDT Update
On the low time frame, IMX is rebounding from the 0.705 – 0.709 support zone and is now testing the main trend zone at 0.728.
Key levels:
0.728 → main trend resistance. A breakout and hold above this level would shift momentum bullish.
0.782 → breakout target zone. If 0.728 is cleared with volume, price could accelerate toward 0.78+ quickly.
0.705 → key support. As long as price holds above, structure stays intact.
Upside scenario:
If IMX breaks 0.728 with confirmation (strong candle + volume), expect bullish momentum into 0.782.
📌 Summary
Above 0.728 → breakout possibility target 0.782 - 0.88
And in whale+ breakout could enter up $1
Hold above 0.705 → trend support remains strong.
Risk zones
correction risk toward 0.63
Cycle hold target up $0,47

IMX/USDT | Low-Risk Long With 215%+ Upside Potential🚀 Trade Setup Details:
🕯 #IMX/USDT 🔼 Buy | Long 🔼
⌛️ TimeFrame: 1D
--------------------
🛡 Risk Management (Example):
🛡 Based on $10,000 Balance
🛡 Loss-Limit: 1% (Conservative)
🛡 The Signal Margin: $465.12
--------------------
☄️ En1: 0.686 (Amount: $46.51)
☄️ En2: 0.632 (Amount: $162.79)
☄️ En3: 0.596 (Amount: $209.3)
☄️ En4: 0.562 (Amount: $46.51)
--------------------
☄️ If All Entries Are Activated, Then:
☄️ Average.En: 0.614 ($465.12)
--------------------
☑️ TP1: 0.836 (+36.16%) (RR:1.68)
☑️ TP2: 0.969 (+57.82%) (RR:2.69)
☑️ TP3: 1.17 (+90.55%) (RR:4.21)
☑️ TP4: 1.486 (+142.02%) (RR:6.61)
☑️ TP5: 1.936 (+215.31%) (RR:10.01)
☑️ TP6: Open 🔝
--------------------
❌ SL: 0.482 (-21.5%) (-$100)
--------------------
💯 Maximum.Lev: 3X
⌛️ Trading Type: Swing Trading
‼️ Signal Risk: 🙂 Low-Risk! 🙂
--------------------
🔗 www.tradingview.com
❤️ Your Like & Comments are valuable to us ❤️

IMX NEW INCREASE VOLUME📊IMX has a pre-scan increase, which could build to a real increase in the coming time frame.
With the View of 2 levels, what IMX can target
Between $0,73 and $0,75, possibility of new uptrend volume
With the data study, this coin comes out as a coin that can show a new increase, even with the breakdown of the main market.
We will follow it to see what the possibilities are
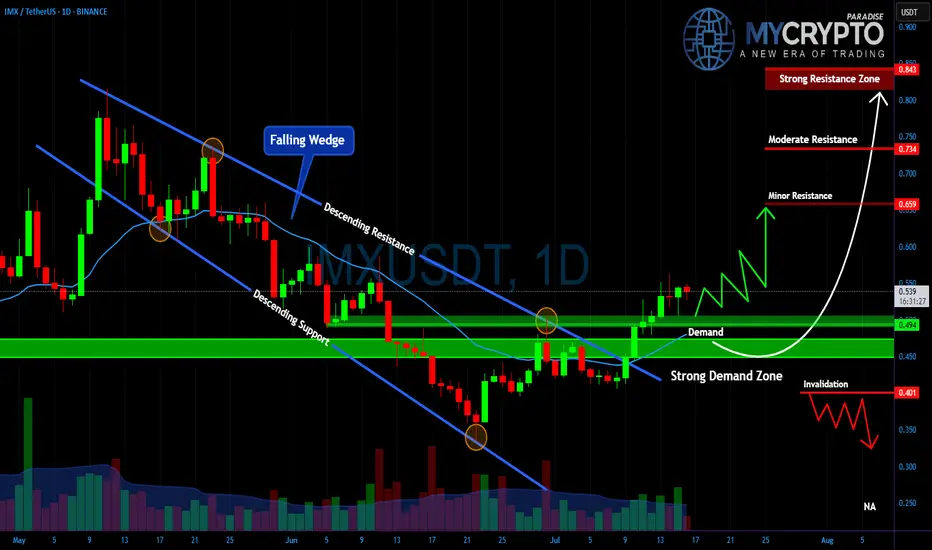
IMXUSDT – Major Breakout or Another Painful Trap Ahead?Yello Paradisers, is this the real start of a powerful bullish reversal on #IMX, or just another classic setup to liquidate impatient traders before the true move begins? The next few days will decide everything.
💎#IMXUSDT has broken out of a falling wedge, which is a typical bullish reversal structure, and is now retesting the strong demand zone between $0.45 and $0.49. As long as the price holds above this level, the bullish scenario remains intact, with $0.659 as the first key resistance to watch.
💎A clean break above $0.659 could open the way toward $0.734, while the critical resistance zone at $0.843 will be the ultimate test of whether IMX can shift into a sustained uptrend.
💎However, the invalidation level sits at $0.401. If this level fails, expect a fast move back toward $0.30, which will likely wipe out many traders who jumped in too early.
This is exactly where most retail traders get trapped. They either chase the move too late or panic-sell too early.
MyCryptoParadise
iFeel the success🌴
IMX 1 Day AnalysisHere is an analysis for IMX on daily timeframe. It has broke resistance and now testing the same. Bounce from here and we can the expected targets achieved.
IMXUSDT Forming Potential Bullish IMXUSDT is gaining traction as it forms a promising technical setup that hints at a potential bullish move in the near term. The pair has been consolidating with good volume, signaling accumulation by investors and stronger hands stepping into the market. This type of structure often leads to an impulsive breakout, and with the current market sentiment, IMXUSDT looks positioned for an upside rally.
The technical formation suggests growing buying interest, and once resistance levels are breached, momentum could accelerate. With volume supporting the move, the breakout has a higher probability of sustaining, providing traders with attractive opportunities for medium-term gains.
With an expected gain of 40% to 50%+, IMXUSDT offers solid potential for both short-term swing trades and longer-term positions. Investor attention continues to increase around this project, making the setup even more compelling as it builds momentum for the next leg up.
✅ Show your support by hitting the like button and
✅ Leaving a comment below! (What is You opinion about this Coin)
Your feedback and engagement keep me inspired to share more insightful market analysis with you!

$IMX breakout:SEED_DONKEYDAN_MARKET_CAP:IMX has broken out of the falling trendline resistance and is showing strength. 🚀
🔹 Entry: CMP - $0.60
🔹 Stop Loss: $0.5033
🔹 Targets: $0.75, $0.88, $1.16
⚠️ Manage risk, this setup is valid with SL and entry at $0.60 support.

IMX/USDT , 1WIn Weekly if IMX breaks the Wedge pattern with strong candle close . it will move very fast (300%) like the same as past move . as the altcoins season is starting and slowing gaining momentum.
and at the same time Bitcoin dominance is decreasing and altcoins dominance is started increasing , so look on all the altcoins
and follow proper risk management , it has very good chances to move UP side but first we have to protect the down side , where risk management comes into game .

IMXUSDT Forming Bullish MoveIMXUSDT is gaining traction as it forms a promising technical setup that hints at a potential bullish move in the near term. The pair has been consolidating with good volume, signaling accumulation by investors and stronger hands stepping into the market. This type of structure often leads to an impulsive breakout, and with the current market sentiment, IMXUSDT looks positioned for an upside rally.
The technical formation suggests growing buying interest, and once resistance levels are breached, momentum could accelerate. With volume supporting the move, the breakout has a higher probability of sustaining, providing traders with attractive opportunities for medium-term gains.
With an expected gain of 40% to 50%+, IMXUSDT offers solid potential for both short-term swing trades and longer-term positions. Investor attention continues to increase around this project, making the setup even more compelling as it builds momentum for the next leg up.
✅ Show your support by hitting the like button and
✅ Leaving a comment below! (What is You opinion about this Coin)
Your feedback and engagement keep me inspired to share more insightful market analysis with you!
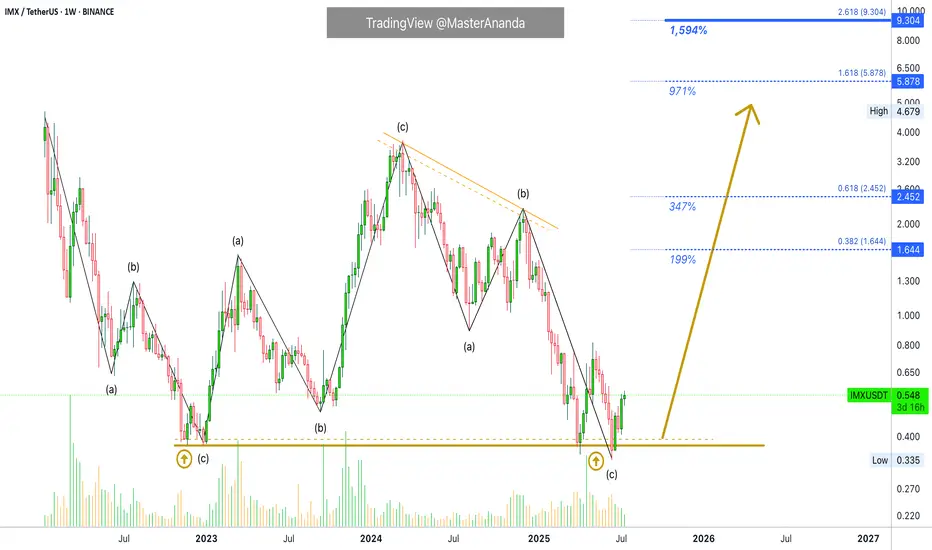
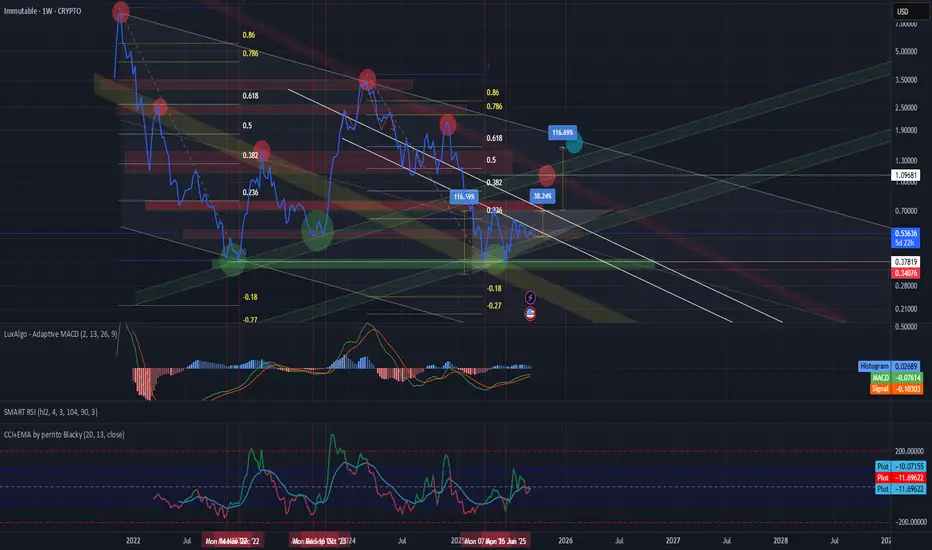
Immutable (IMX) IMXUSD 3-day and 1-week TFAs is ABSOLUTELY always the case, the time comes when a previous high becomes the new low — and this coin is no exception.
Pay attention to the yellow channel: every reversal has been marked by two key points, just like the current one — highlighted with green circles.
A potential inverted triangle with a right angle may have formed on the chart, suggesting a move toward the upper boundary of the global descending channel. Percentage targets are indicated.
Key zones are also marked — previous resistance levels that are likely to act as support going forward.
A new channel may already be forming, guiding price toward the outlined targets.
Fibonacci retracement shows confluence around the 0.5–0.618 levels, just like in the previous cycle.
MACD indicates ongoing accumulation, while CCI shows that highs are still far off.
I hope everything is clear.
IMX Breakout Alert! 🚨 IMX Breakout Alert! 🚨
IMX is currently testing the red resistance zone 🔴
If price breaks out, the first target will be the green line level 🎯
A confirmed breakout here would signal bullish continuation and could drive further upside ✅
IMX Signals Reversal with RSI Bullish DivergenceIMX has shown a strong bounce from a demand zone, backed by clear bullish divergence on the RSI. Price printed a higher low on the oscillator while price action formed a lower low – a classic reversal signal. This area has acted as support multiple times in the past, and we can expect a reversal from the current support level.
Resistance 1:
Resistance 2:
Resistance 2:
Cheers
Hexa
BINANCE:IMXUSDT CRYPTO:IMXUSD
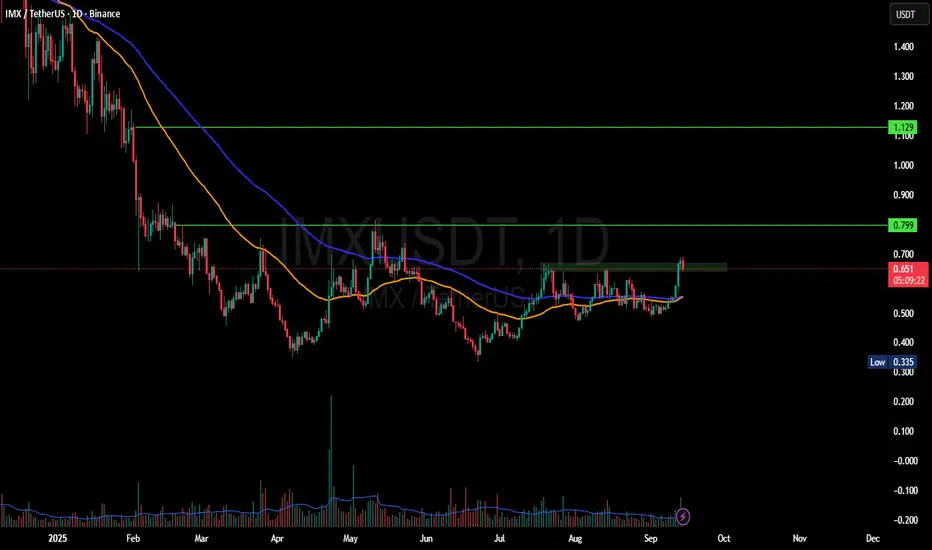
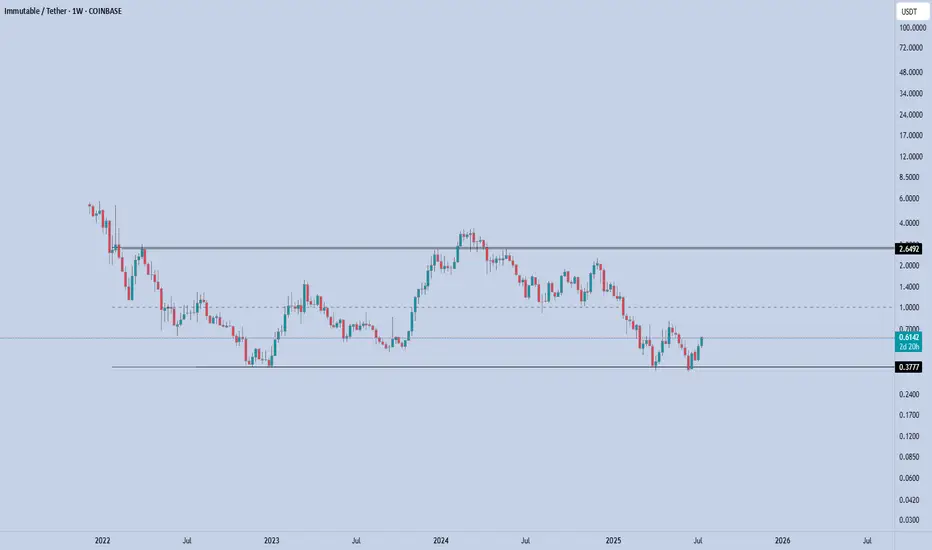
IMX – Range Low ReclaimedIMX has once again defended the $0.37–0.38 demand zone, bouncing sharply off the lows. This level has acted as a long-term accumulation base since late 2022, and price is now showing early signs of another range rotation.
Currently trading at $0.61, IMX is holding above the reclaimed support. As long as this level is maintained, the setup favors a move toward the mid-range and potentially the upper boundary of the established range.
🎯 Key Levels:
Support: $0.38 (range low & invalidation)
Mid-range: $1
Target: $2.65 (range high)
If bulls can push through the $1 mid-range resistance, the top of the range at $2.65 becomes the next magnet.
📌 Risk Management:
$0.38 is the line in the sand. A close below this level breaks the structure and invalidates the setup.
A New All-Time High Guaranteed for ImmutableX (1,600% PP)IMX produced a strong bullish cycle between December 2022 and March 2024. The entire bullish wave was corrected beyond 100%. This means that IMXUSDT hit a lower low. It went below the starting point of the last bullish wave. This is good in several ways.
The last move being deleted in its entirety opens the doors for a new bullish cycle with unlimited growth potential. We also know that all weak hands have been removed. Anybody who wanted to sell had more than a year to do so with all profits erased from the previous cycle. A total flush, a full reset.
The last bullish cycle produced more than 850%. We now know that this much is do-able so it becomes very easy. Last time market conditions were mixed to say the least, but not extremely bullish nor the best possible.
If IMXUSDT can grew this much in a mixed market, how much can it grow in a favorable market, in a bull market?
So, we aim for a strong higher high, a new all-time high. This opens up $5.9 an $9.3 as target for this newly developing bullish phase.
Thank you for reading.
Namaste.