IMXUSDT — On the Edge of a Major Reversal: Accumulation or Trap?After a prolonged downtrend since 2022, Immutable X (IMX) is once again testing the critical accumulation zone between 0.48 – 0.38 USDT — a price area that has repeatedly acted as a major turning point in the past.
This yellow demand block now represents the last stronghold of buyers, where every dip has historically triggered strong rebounds marked by long lower wicks — a clear sign of buying absorption and smart money activity.
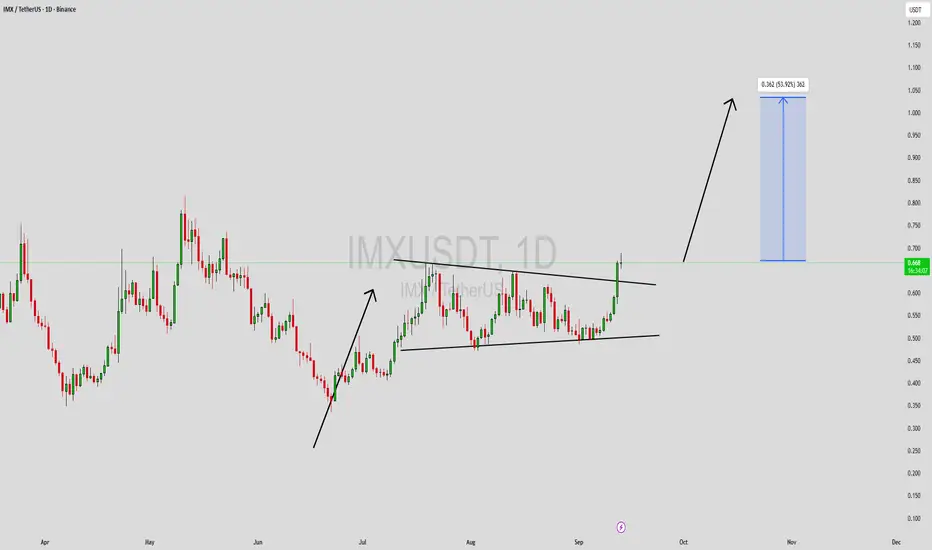
For now, IMX remains trapped within a large consolidation range, capped by resistance around 0.75 USDT.
Whether the price breaks out or breaks down from this range will likely determine IMX’s trajectory for the months ahead.
---
Pattern & Structural Analysis
Primary trend: Long-term bearish, but currently showing signs of potential base formation.
Demand Zone (Yellow Block): 0.48 – 0.38 USDT, acting as the main accumulation area.
Key Resistance: 0.75 USDT — a breakout above this level could mark the start of a trend reversal.
Long Lower Wicks: Indicate liquidity sweeps and strong absorption by buyers.
Market Structure: Sideways range — a transitional phase between distribution and potential accumulation.
---
Bullish Scenario (Reversal Setup)
A decisive close above 0.75 USDT, backed by increasing volume, would confirm the start of a new bullish phase.
First upside target sits at 1.14 USDT, followed by 2.35 USDT — a major macro resistance zone.
The structure would shift from range-bound to higher highs and higher lows, signaling clear bullish control.
Confirmation trigger: Formation of a higher low above 0.65 after breakout — indicating sustainable momentum.
---
Bearish Scenario (Breakdown from Accumulation Zone)
If price closes below 0.38 USDT on the 6D timeframe, it would invalidate the current accumulation range.
This breakdown could lead IMX to revisit 0.21 – 0.25 USDT, aligning with previous historical lows.
Such a move would confirm a capitulation phase before any major reversal takes place.
---
Psychological & Macro Perspective
IMX is likely in its “disbelief zone” — the phase where the majority lose interest, yet smart money quietly begins accumulation.
The reaction inside the 0.48 – 0.38 USDT demand zone will determine the next macro direction:
either the beginning of a long-term reversal, or the final flush before true recovery.
---
Conclusion
The 0.48 – 0.38 USDT zone is a decisive battleground between bulls and bears.
As long as IMX holds above this block, the reversal potential remains alive.
A confirmed breakout above 0.75 USDT could trigger a multi-month rally.
However, a breakdown below 0.38 would likely lead to another bearish leg toward 0.21 USDT.
---
#IMX #ImmutableX #IMXUSDT #CryptoAnalysis #SmartMoney #TechnicalAnalysis #AccumulationZone #SwingTrade #CryptoTA #PriceAction
Imxusdtlong

#IMX/USDT#IMX
The price is moving within a descending channel on the 1-hour frame, adhering well to it, and is heading for a strong breakout and retest.
We are seeing a bounce from the lower boundary of the descending channel, which is support at 0.599.
We have a downtrend on the RSI indicator that is about to be broken and retested, supporting the upward trend.
We are looking for stability above the 100 moving average.
Entry price: 0.602
First target: 0.649
Second target: 0.682
Third target: 0.721

$IMX breakout:SEED_DONKEYDAN_MARKET_CAP:IMX has broken out of the falling trendline resistance and is showing strength. 🚀
🔹 Entry: CMP - $0.60
🔹 Stop Loss: $0.5033
🔹 Targets: $0.75, $0.88, $1.16
⚠️ Manage risk, this setup is valid with SL and entry at $0.60 support.

IMXUSDT Forming Bullish MoveIMXUSDT is gaining traction as it forms a promising technical setup that hints at a potential bullish move in the near term. The pair has been consolidating with good volume, signaling accumulation by investors and stronger hands stepping into the market. This type of structure often leads to an impulsive breakout, and with the current market sentiment, IMXUSDT looks positioned for an upside rally.
The technical formation suggests growing buying interest, and once resistance levels are breached, momentum could accelerate. With volume supporting the move, the breakout has a higher probability of sustaining, providing traders with attractive opportunities for medium-term gains.
With an expected gain of 40% to 50%+, IMXUSDT offers solid potential for both short-term swing trades and longer-term positions. Investor attention continues to increase around this project, making the setup even more compelling as it builds momentum for the next leg up.
✅ Show your support by hitting the like button and
✅ Leaving a comment below! (What is You opinion about this Coin)
Your feedback and engagement keep me inspired to share more insightful market analysis with you!
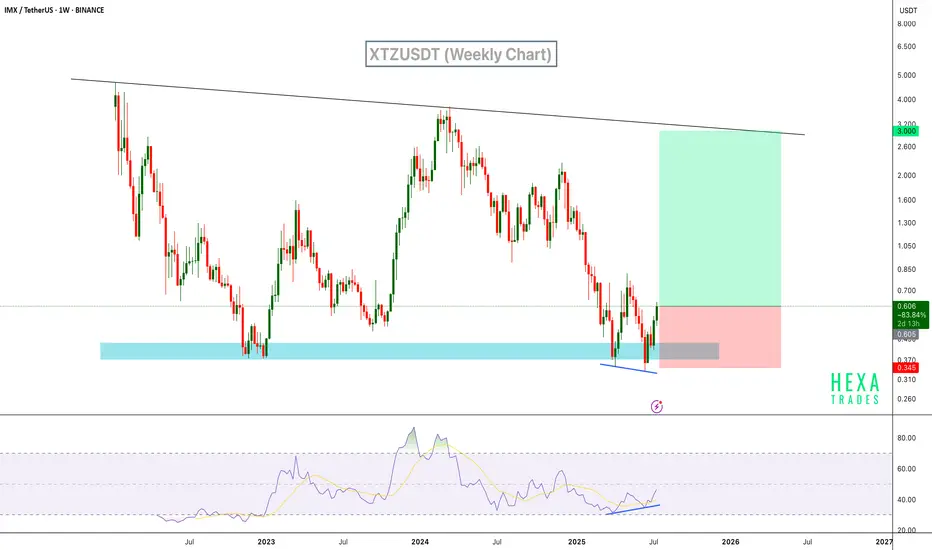
IMX Signals Reversal with RSI Bullish DivergenceIMX has shown a strong bounce from a demand zone, backed by clear bullish divergence on the RSI. Price printed a higher low on the oscillator while price action formed a lower low – a classic reversal signal. This area has acted as support multiple times in the past, and we can expect a reversal from the current support level.
Resistance 1:
Resistance 2:
Resistance 2:
Cheers
Hexa
BINANCE:IMXUSDT CRYPTO:IMXUSD
IMXUSDT 6D AnalysisIMX ~ 6D Analysis
#IMX This is the lowest support block for now. Buy if you still have faith in this coin with a short term target of at least 20%+ from this support

#IMX/USDT#IMX
The price is moving within a descending channel on the 1-hour frame, adhering well to it, and is heading for a strong breakout and retest.
We are seeing a bounce from the lower boundary of the descending channel, which is support at 0.390
We have a downtrend on the RSI indicator that is about to be broken and retested, supporting the upward trend.
We are looking for stability above the 100 moving average.
Entry price: 0.407
First target: 0.426
Second target: 0.449
Third target: 0.480

#IMX/USDT#IMX
The price is moving within a descending channel on the 1-hour frame and is expected to continue upward.
We have a trend to stabilize above the 100 moving average once again.
We have a downtrend on the RSI indicator, which supports the upward move with a breakout.
We have a support area at the lower boundary of the channel at 0.503.
Entry price: 0.0528
First target: 0.540
Second target: 0.560
Third target: 0.587

IMXUSDT 6DIMX ~ 6D Analysis
#IMX The last support that must be maintained. Losing this support will make prices more depressed.

IMXUSDT 6DIMX ~ 6D Analysis
#IMX Buy gradually from here if you still have a Conviction on this coin with a short -term target of at least 20%+.
This is the lowest support block for now.

Immutable will be trending to the UPSIDE!Hi fellow traders, IMXUSDT is ready to make a move higher after completing the correction in ABC formation. Target the 4.1107 level. Good luck and trade safe!

#IMX/USDT Ready to launch upwards#IMX
The price is moving in a descending channel on the 4-hour frame and sticking to it well
We have a bounce from the lower limit of the descending channel, this support is at 1.30
We have an upward trend on the RSI indicator that is about to be broken, which supports the rise
We have a trend to stabilize above the moving average 100
Entry price 1.46
First target 1.56
Second target 1.64
Third target 1.74

#IMX/USDT Ready to go higher#IMX
The price is moving in a descending channel on the 1-hour frame and sticking to it well
We have a bounce from the lower limit of the descending channel, this support is at 2.00
We have a downtrend on the RSI indicator that is about to break, which supports the rise
We have a trend to stabilize above the moving average 100
Entry price 0.02
First target 2.08
Second target 2.17
Third target 2.29

#IMX/USDT#IMX
The price is moving in a descending channel on the 12-hour frame upwards and is expected to continue.
We have a trend to stabilize above the moving average 100 again.
We have a downtrend on the RSI indicator that supports the rise by breaking it upwards.
We have a support area at the lower limit of the channel at a price of 1.35.
Entry price 1.50.
First target 1.62.
Second target 1.78.
Third target 1.90.

IMX: Early Bird Gets the Breakout!This should break out with force from here. CRYPTOCAP:IMX
I’m jumping in now, and if it gets invalidated, I’ll exit and re-enter below $1.16.
It seems to be lagging compared to other coins, and the trend isn't even confirmed on the weekly yet, so I think we're early—buying before the expansion and confirmation.

IMX Looks Bottomed Here – Ready for the Next Leg Up?The weekly chart has just confirmed another bullish signal at macro support. What can we expect?
Ideally, a continued uptrend from here would be the best scenario, and it’s something I’m anticipating before any potential reversal and the formation of a new monthly trend.
There are no new lows in sight after retesting the previous monthly support levels, with clear demand around $1.
If things continue to develop positively, a 5-week consolidation period could provide a stronger signal. For now, this setup is sufficient for me to look for long positions, aiming to hold into $2.5 as a primary target. If momentum and overall market conditions are favorable, new all-time highs could be on the horizon.
CRYPTOCAP:IMX LONG!

IMXUSDT 1WIMX ~ 1W
#IMX Looks like it has finished completing Wave 5 of its Decline. this would be a very good purchase price by far. with a minimum target of 10-20%

IMXUSDT 5DIMX ~ 5D
#IMX Looks like it has finished completing Wave 5 of its Decline. this would be a very good purchase price by far. with a minimum target of 10-20%

IMXUSDT 2DIMX ~ 2D
#IMX The support block is quite interesting to start the accumulation of here.
Bullish will start to dominate after this resistance line is successfully broken.

IMX updateMX Update
We bought IMX at $1.48.
Currently, it's forming a falling wedge pattern at a major support level, which is a bullish sign. It performed exceptionally well during the last upward trend.
Targets are marked on the chart for reference.
This is a long-term hold position.

IMXUSDT Resistance Zone BreakoutIMXUSDT Technical analysis update
IMX price breaks the resistance zone on the 4H chart after multiple rejections. The 4H candle closed above the resistance zone, and the price is trading above the 100 and 200 EMA. We can expect a strong bullish move from here.
Buy Level: $1.66
Stop Loss: $1.46
Regards
Hexa

IMXUSDT Tripple Bottom!IMXUSDT technical analysis update
IMX has formed a triple bottom on the 4-hour chart, and the price has broken the triple bottom neckline. We can expect a good bullish move from the current level.
Buy Level: $1.33
Stop Loss: $1.20
Regards
Hexa

IMX || Ratio 2.12IMX forming good signals upward.
We mentioned all targets for profit and the risky points,
We are pleased to inform you that we passed the final phases to publish our AIO indicator with Smart strategy.
