IMXUSDT — On the Edge of a Major Reversal: Accumulation or Trap?After a prolonged downtrend since 2022, Immutable X (IMX) is once again testing the critical accumulation zone between 0.48 – 0.38 USDT — a price area that has repeatedly acted as a major turning point in the past.
This yellow demand block now represents the last stronghold of buyers, where every dip has historically triggered strong rebounds marked by long lower wicks — a clear sign of buying absorption and smart money activity.
For now, IMX remains trapped within a large consolidation range, capped by resistance around 0.75 USDT.
Whether the price breaks out or breaks down from this range will likely determine IMX’s trajectory for the months ahead.
---
Pattern & Structural Analysis
Primary trend: Long-term bearish, but currently showing signs of potential base formation.
Demand Zone (Yellow Block): 0.48 – 0.38 USDT, acting as the main accumulation area.
Key Resistance: 0.75 USDT — a breakout above this level could mark the start of a trend reversal.
Long Lower Wicks: Indicate liquidity sweeps and strong absorption by buyers.
Market Structure: Sideways range — a transitional phase between distribution and potential accumulation.
---
Bullish Scenario (Reversal Setup)
A decisive close above 0.75 USDT, backed by increasing volume, would confirm the start of a new bullish phase.
First upside target sits at 1.14 USDT, followed by 2.35 USDT — a major macro resistance zone.
The structure would shift from range-bound to higher highs and higher lows, signaling clear bullish control.
Confirmation trigger: Formation of a higher low above 0.65 after breakout — indicating sustainable momentum.
---
Bearish Scenario (Breakdown from Accumulation Zone)
If price closes below 0.38 USDT on the 6D timeframe, it would invalidate the current accumulation range.
This breakdown could lead IMX to revisit 0.21 – 0.25 USDT, aligning with previous historical lows.
Such a move would confirm a capitulation phase before any major reversal takes place.
---
Psychological & Macro Perspective
IMX is likely in its “disbelief zone” — the phase where the majority lose interest, yet smart money quietly begins accumulation.
The reaction inside the 0.48 – 0.38 USDT demand zone will determine the next macro direction:
either the beginning of a long-term reversal, or the final flush before true recovery.
---
Conclusion
The 0.48 – 0.38 USDT zone is a decisive battleground between bulls and bears.
As long as IMX holds above this block, the reversal potential remains alive.
A confirmed breakout above 0.75 USDT could trigger a multi-month rally.
However, a breakdown below 0.38 would likely lead to another bearish leg toward 0.21 USDT.
---
#IMX #ImmutableX #IMXUSDT #CryptoAnalysis #SmartMoney #TechnicalAnalysis #AccumulationZone #SwingTrade #CryptoTA #PriceAction
Imxusdtsignal

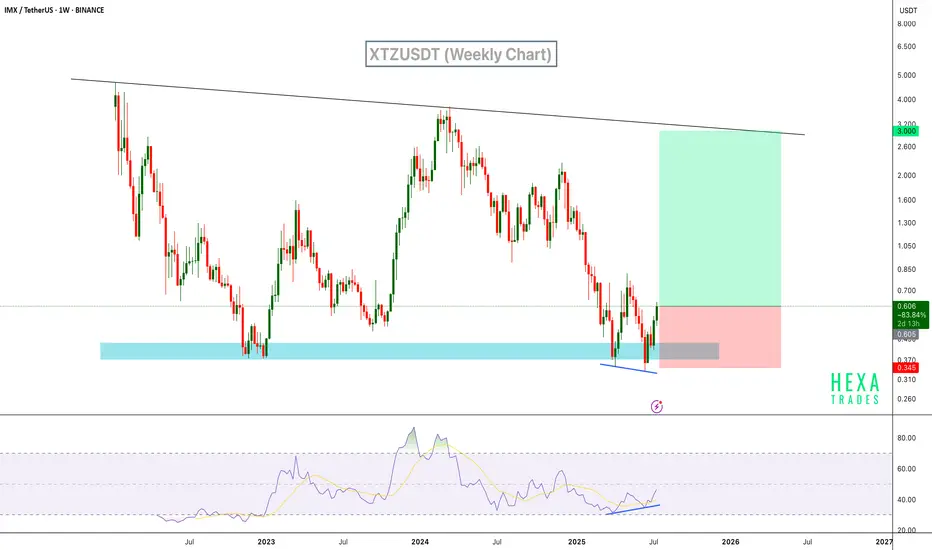
IMX Signals Reversal with RSI Bullish DivergenceIMX has shown a strong bounce from a demand zone, backed by clear bullish divergence on the RSI. Price printed a higher low on the oscillator while price action formed a lower low – a classic reversal signal. This area has acted as support multiple times in the past, and we can expect a reversal from the current support level.
Resistance 1:
Resistance 2:
Resistance 2:
Cheers
Hexa
BINANCE:IMXUSDT CRYPTO:IMXUSD
IMXUSDT 6DIMX ~ 6D Analysis
#IMX The last support that must be maintained. Losing this support will make prices more depressed.

IMXUSDT 6DIMX ~ 6D Analysis
#IMX Buy gradually from here if you still have a Conviction on this coin with a short -term target of at least 20%+.
This is the lowest support block for now.

Is IMX Teetering on the Edge of a Major Drop? Critical Levels!Yello, Paradisers! Is IMX heading for a breakdown, or will it stage a powerful recovery? Let's dive into what’s happening and the key levels to watch.
💎IMX is losing momentum after facing a sharp rejection at the crucial $1.83 resistance. Currently, the price seems poised to retest the demand zone around $1.35 as it attempts to gather new momentum. If IMX bounces off this demand area and manages to break through the $1.83 resistance again, we could see a strong upward push back into a bullish structure, increasing the likelihood of reaching our target area.
💎However, if the price fails to hold above the $1.35 - $1.20 demand zone and breaks below, it could trigger a downward spiral toward the $1.03 - $0.90 support zone. This support area still looks relatively fresh and could potentially attract buyers, leading to a significant rebound if respected.
💎But if IMX breaks below $0.90 without showing signs of strength, this would indicate a bearish scenario, paving the way for an even deeper correction.
Stay vigilant, and as always, trade wisely!
MyCryptoParadise
iFeel the success🌴

IMXUSDT 1WIMX ~ 1W
#IMX Looks like it has finished completing Wave 5 of its Decline. this would be a very good purchase price by far. with a minimum target of 10-20%

IMXUSDT 5DIMX ~ 5D
#IMX Looks like it has finished completing Wave 5 of its Decline. this would be a very good purchase price by far. with a minimum target of 10-20%

IMXUSDT 2DIMX ~ 2D
#IMX The support block is quite interesting to start the accumulation of here.
Bullish will start to dominate after this resistance line is successfully broken.

IMXUSD 1DIMX ~ 1D
#IMX Make purchases gradually in demand zone or buy after breaking this resistance line, with a minimum target of 15%+

IMX/USDT keep an eye on support or OB, potential bouncing!💎 The recent market dynamics surrounding #IMX have indeed been quite notable. It appears that IMX is poised to retest the support area, which previously acted as resistance.
💎 Alternatively, the price may even reach the Bullish OB area to fulfill orders, potentially leading to a bounce and continuation of the bullish trend.
💎 Given IMX's ongoing bullish momentum in the mid-term, there's a strong possibility that after hitting the Bullish OB, the price will rebound and proceed to retest the resistance.
💎 Breaking through this resistance zone is crucial, as a successful breakout could pave the way for IMX to reach our target strong resistance area.
💎 However, if IMX fails to bounce from the Bull OB and instead breaks below this area, it could signify a bearish trend, leading to further downward movement and potentially lower price levels.
MyCryptoParadise
iFeel the success🌴

IMX/USDT Could IMX repeat the history bounce from here ?💎 Paradisers, #IMX has recently experienced notable market dynamics. Currently positioned around the support area, IMX has a history of successfully bouncing off this support and initiating significant upward movements.
💎 There's potential for IMX to repeat this pattern, with a bounce off the support followed by a breakout above the resistance trendline, potentially leading to continued upward movement toward the strong resistance area.
💎 However, if IMX fails to maintain support and breaks below it, the next likely stop is the daily demand area of around $1.78.
💎 When IMX reaches the demand area, a bounce is crucial, as this zone is pivotal. For IMX to reach the strong resistance, it's essential to reclaim the price above the support area. Failure to do so, and a breakdown below the demand area, could signify a bearish momentum, leading to significant downward movement.
