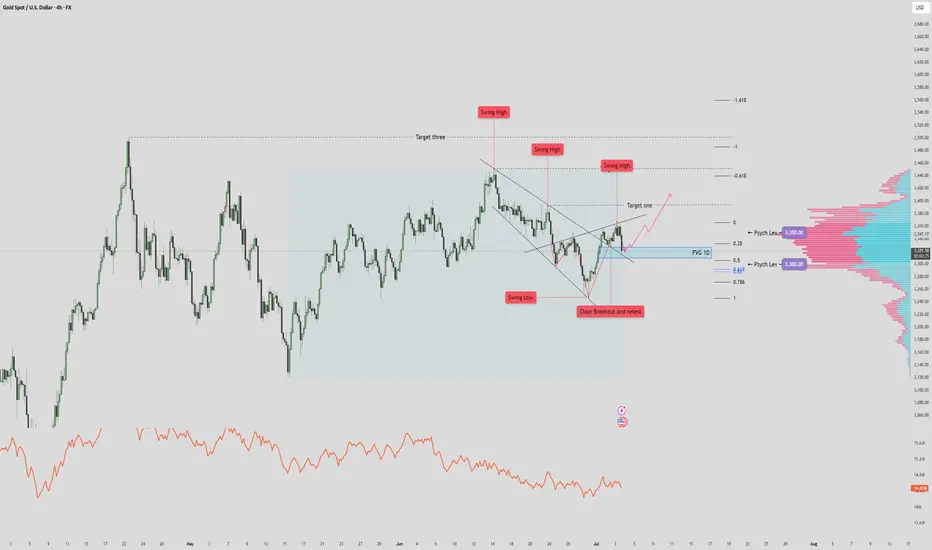
XAUUSD $3500 Recovery? Reverse Heads and Shoulders? 🔎 STRUCTURE & TECHNICAL ELEMENTS
1. Pattern:
A falling wedge was formed and broken cleanly to the upside → bullish reversal structure.
Breakout was followed by a successful retest at prior structure lows (marked “Clear Breakout and Retest”).
2. Fair Value Gap (FVG 1D) Zone:
Currently being tested. This zone coincides with:
Minor support from prior consolidation
Fib retracement (0.5 level)
Potential demand area (watch for bullish reaction/candle structure here)
3. Volume Profile:
3,350 = POC (Point of Control) → heavy resistance.
3,300 = Secondary HVN → strong support below current price.
Low-volume nodes just under current price → if broken, price likely accelerates into the GP zone.
4. Fibonacci & Liquidity Confluence:
Golden Pocket (3287) just below 3,300 = ideal liquidity draw if FVG fails.
Target 1 / 2 / 3 above are Fibonacci-based projections + historical swing zones.
✅ SCENARIO 1: Bullish Case – FVG Holds
If price respects the FVG 1D zone, expect:
Continuation up toward Target One (~3,430)
Extension to Target Two (~3,470) and even Target Three (~3,540+) possible
Confirmation: Bullish engulfing / high-volume bounce / sweep of intraday lows without close below FVG
Bias: Bullish continuation as long as price holds above FVG/0.5 Fib
🚨 SCENARIO 2: Bearish Case – FVG Breaks Down
If price closes below FVG zone, particularly below 3,312:
High probability drop toward 3,300 (psych level)
Liquidity sweep and deeper correction into Golden Pocket (~3,287) likely
This area can act as a high-probability long re-entry zone
Bias: Short-term bearish if close below FVG + swing structure invalidation
⚖️ REFINED SUMMARY
Price rejects off FVG - we can expect target 1 and 2 tagged.
Price breaks & closes below FVG zone - we can expect it to drop/wick to 3,300
Index
SPX500 | Bulls Need Break Above 6225 to Regain ControlSPX500 | Market Overview
The price has reached the previously mentioned resistance level at 6225.
As long as it trades below 6225, a technical correction is likely, with downside targets at 6161 and 6143. From there, the index would need to stabilize above 6143 to resume a bullish structure.
However, a 1H candle close below 6143 would confirm a deeper bearish move toward 6098.
On the upside, a 1H close above 6225 would reinforce bullish momentum, with potential to reach 6250 and 6287.
Key Technical Levels
Pivot Level: 6191
Support: 6161 / 6143 / 6098
Resistance: 6225 / 6250 / 6287

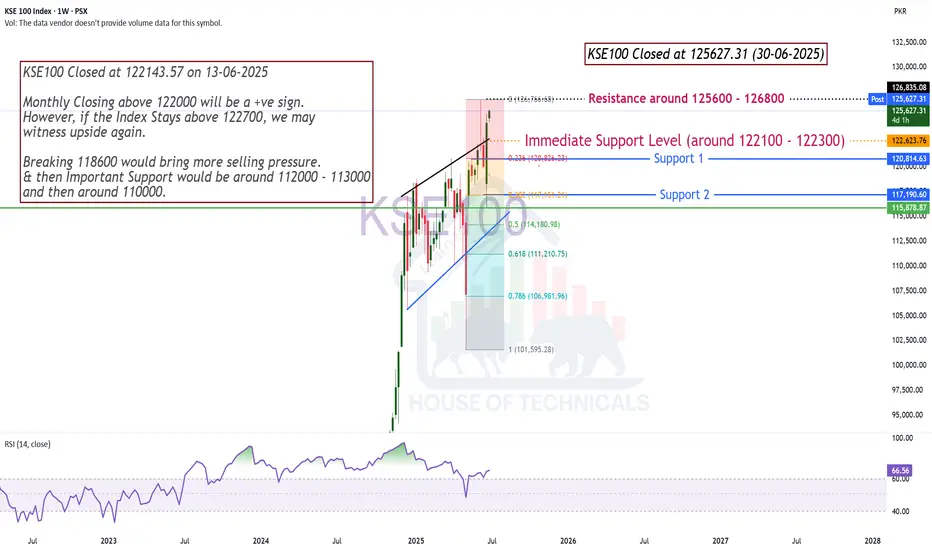
Bullish!Immediate Support Level (around 122100 - 122300)
Note the Resistance is around 125600 - 126800
DXY BANK VAULT BREAK-IN: Your Dollar Index Profit Blueprint🚨 DXY BANK HEIST: Dollar Index Breakout Robbery Plan (Long Setup) 🚨
🌟 Hi! Hola! Ola! Bonjour! Hallo! Marhaba! 🌟
Attention, Market Robbers & Dollar Bandits! 🏦💰💸
Using the 🔥Thief Trading Style🔥, we’re plotting a DXY (Dollar Index) bank heist—time to go LONG and escape near the ATR danger zone. Overbought? Yes. Risky? Absolutely. But the real robbery happens when weak hands panic. Take profits fast—you’ve earned this loot! 🏆💵
📈 ENTRY: BREAKOUT OR GET LEFT BEHIND!
Wait for DXY to cross 99.300 → Then strike hard!
Buy Stop Orders: Place above Moving Average.
Buy Limit Orders: Sneak in on 15M/30M pullbacks (swing lows/highs).
Pro Tip: Set a BREAKOUT ALARM—don’t miss the heist!
🛑 STOP LOSS: DON’T GET LOCKED UP!
For Buy Stop Orders: Never set SL before breakout—amateurs get caught!
Thief’s Safe Spot: Nearest swing low (2H chart).
Rebels: Place SL wherever… but your funeral! ⚰️
🏴☠️ TARGET: 102.300 (Bank Vault Cracked!)
Scalpers: Long only! Trail your SL like a pro thief.
Swing Traders: Ride this heist for maximum payout.
💵 MARKET CONTEXT: DXY IS BULLISH (But Traps Await!)
Fundamentals: COT Reports, Fed Plays, Geopolitics.
Intermarket Sentiment: Bonds, Gold, Stocks—all connected.
Full Analysis: Check our bio0 linkks 👉🔗 (Don’t trade blind!).
⚠️ ALERT: NEWS = VOLATILITY = TRAP ZONE!
Avoid new trades during high-impact news.
Lock profits with trailing stops—greed gets you caught!
💥 SUPPORT THE HEIST (OR GET LEFT BROKE!)
Smash that Boost Button 💖→ Stronger team = bigger scores!
Steal profits daily with the Thief Trading Style. 🎯🚀
Next heist coming soon… stay ready! 🤑🐱👤🔥

DXY Swing Short! Sell!
Hello,Traders!
DXY keeps falling down
And the index broke the
Key wide horizontal level
Around 97.800 which is now
A resistance and the breakout
Is confirmed so we are very
Bearish biased and we will
Be expecting a bearish
Continuation on Monday
Sell!
Comment and subscribe to help us grow!
Check out other forecasts below too!
Disclosure: I am part of Trade Nation's Influencer program and receive a monthly fee for using their TradingView charts in my analysis.

DXY STRONG DOWNTREND CONTINUES|SHORT|
✅DXY is going down currently
In a strong downtrend and the index
Broke the key structure level of 98.000
Which is now a resistance,
And after the pullback
And retest, I think the price
Will go further down next week
SHORT🔥
✅Like and subscribe to never miss a new idea!✅
Disclosure: I am part of Trade Nation's Influencer program and receive a monthly fee for using their TradingView charts in my analysis.

DOW JONES Will Keep Growing! Buy!
Hello,Traders!
US30 is trading in an
Uptrend and the index broke
The key horizontal level
Around 43,200 and the
Breakout is confirmed so
We are bullish biased
And we will be expecting a
Further bullish move up
Buy!
Comment and subscribe to help us grow!
Check out other forecasts below too!
Disclosure: I am part of Trade Nation's Influencer program and receive a monthly fee for using their TradingView charts in my analysis.

US100 BULLISH BREAKOUT|LONG|
✅US100 is going up
Now and the index made a bullish
Breakout of the key horizontal
Level of 22,222 and the breakout
Is confirmed so we are bullish
Biased and we will be expecting
A further bullish move up
LONG🚀
✅Like and subscribe to never miss a new idea!✅
Disclosure: I am part of Trade Nation's Influencer program and receive a monthly fee for using their TradingView charts in my analysis.

NASDAQ READY TO CONTINUE THE LONG-TERM WEEKLY BULLISH RUN
FX:NAS100
I just entered this buy trade on Nasdaq on the daily time frame.
The trade setup is a Swing trade following the monthly and weekly orderflow.
The Monthly is bullish, the weekly is also bullish, so I entered on the daily time frame retracement.
My overall take profit is a risk reward of 1:4.

$JPIRYY -Japan CPI (May/2025)ECONOMICS:JPIRYY
May/2025
source: Ministry of Internal Affairs & Communications
- Japan's annual inflation rate edged down to 3.5% in May 2025 from 3.6% in the previous two months, marking the lowest level since November.
Price growth eased for clothing (2.6% vs 2.7% in April), household items (3.6% vs 4.1%), and healthcare (2.0% vs 2.2%), while education costs fell further (-5.6%). In contrast, inflation held steady for transport (2.7%) and miscellaneous items (1.3%), but accelerated for housing (1.1% vs 1.0%), recreation (3.0% vs 2.7%), and communications (1.9% vs 1.1%).
Meanwhile, prices of electricity (11.3% vs 13.5%) and gas (5.4% vs 4.4%) remained elevated.
On the food side, prices increased by 6.5%, staying at the slowest pace in four months, though rice prices soared over 100%, underscoring the limited impact of government efforts to rein in staple food costs.
Meanwhile, the core inflation accelerated to 3.7% from 3.5% in April, reaching its highest level in over two years, ahead of the summer election.
Monthly, the CPI rose 0.3%, after a 0.1% gain in April.

GBIRYY - U.K Inflation (May/2025)ECONOMICS:GBIRYY
May/2025
source: Office for National Statistics
-The annual inflation rate in the UK edged down to 3.4% in May 2025 from 3.5% in April, matching expectations.
The largest downward contribution came from transport prices (0.7% vs 3.3%), reflecting falls in air fares (-5%) largely due to the timing of Easter and the associated school holidays, as well as falling motor fuel prices.
Additionally, the correction of an error in the Vehicle Excise Duty series contributed to the drop; the error affected April’s data, but the series has been corrected from May.
Further downward pressure came from cost for housing and household services (6.9% vs 7%), mostly owner occupiers' housing costs (6.7% vs 6.9%).
Services inflation also slowed to 4.7% from 5.4%. On the other hand, the largest, upward contributions came from food and non-alcoholic beverages (4.4% vs 3.4%), namely chocolate, confectionery and ice cream, and furniture and household goods (0.8%, the most since December 2023).
Compared to the previous month, the CPI rose 0.2%.

Great Depression 2.0 Starting in 2030?Looking at the Dow Jones, we can see clear cycles forming on this index. I believe we could see one more major run on the Dow between now and 2030, followed by a repeat of the Great Depression. I could easily be wrong, but the charts suggest this is a very real possibility.
So, between now and our potential top in 2030, we have an opportunity to make a significant amount of money in markets like crypto.
As always, stay profitable.
– Dalin Anderson

S&P500: 1D Golden Cross incoming. 6,300 sighted.S&P500 is on an excellent bullish technical outlook on 1D (RSI = 60.006, MACD = 86.860, ADX = 23.325), extending a May 23rd rebound on its 1D MA200. Soon the market will form a 1D Golden Cross, drawing valid comparisons with the 2020 COVID recovery. That pattern, following its 1D MA200 rebound, extended the uptrend all the way to the 1.136 Fibonacci extension before pulling back to the 1D MA50 again. Buy, TP = 6,300.
## If you like our free content follow our profile to get more daily ideas. ##
## Comments and likes are greatly appreciated. ##

Monthly Closing above 122000 will be a +ve sign.KSE100 Closed at 122143.57 on 13-06-2025
Monthly Closing above 122000 will be a +ve sign.
However, if the Index Stays above 122700, we may
witness upside again.
Breaking 118600 would bring more selling pressure.
& then Important Support would be around 112000 - 113000
and then around 110000.

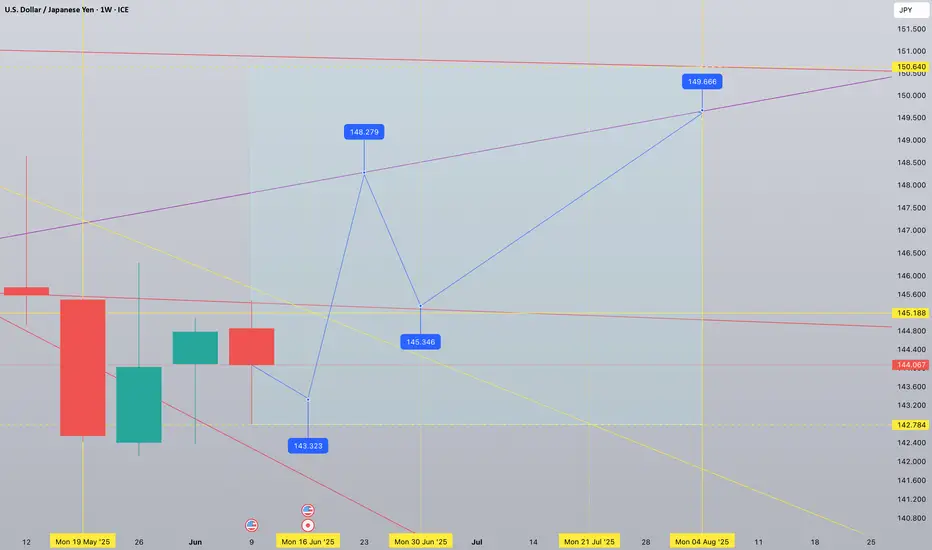
USDJPY 1W tf forecast until August 2025 Current midterm bias is bullish. 150,64 and 142,78 are extreme levels to be respected by the price action. One more week of red week of sideways movement will actually form a reversal pattern followed by a strong upward spike. A powerful breakout to 148,27 is to be retested at 145,34 - healthy retest. July will show an organic growth topping at 149.66 in the beginning of August 2025
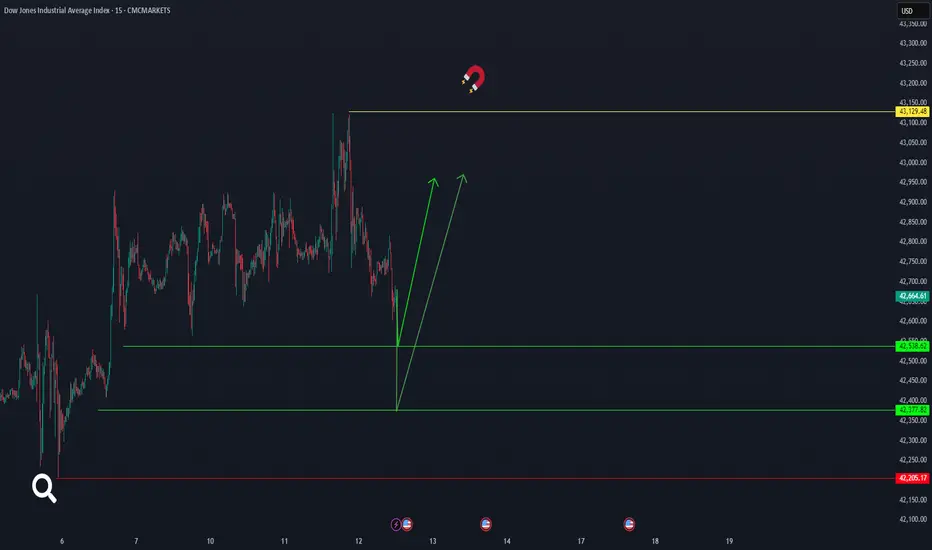
us30It seems that the Dow Jones will start moving again from the areas of 42377 or 42538 and the price will definitely reach 43129.48. Of course, the critical point is 42205. CMCMARKETS:US30
SPY SHORT FROM RESISTANCE|
✅SPY went up to retest
A horizontal resistance of 610$
Which is also an All-Time-High
So its a very strong level
Which makes me locally bearish biased
And I think that we will see a pullback
And a move down from the level
Towards the target below at 596.43$
SHORT🔥
✅Like and subscribe to never miss a new idea!✅
Disclosure: I am part of Trade Nation's Influencer program and receive a monthly fee for using their TradingView charts in my analysis.

DXY Support Ahead! Buy!
Hello,Traders!
DXY keeps going down
But the strong horizontal
Support is ahead around 98.000
So after the price hit the level
We will be expecting a
Local rebound and a move up
Buy!
Comment and subscribe to help us grow!
Check out other forecasts below too!
Disclosure: I am part of Trade Nation's Influencer program and receive a monthly fee for using their TradingView charts in my analysis.

SHORT ON SPY (SPX/USD)SPY has failed to create higher highs and given us a head and shoulders pattern.
I will be selling spy to the next level of demand looking to catch 50-60 points.

US100 Local Short! Sell!
Hello,Traders!
US100 keeps growing but
The index will soon hit a
Horizontal resistance
Of 22,243 so after the
Retest we will be expecting
A local pullback and a
Local move down
Sell!
Comment and subscribe to help us grow!
Check out other forecasts below too!
Disclosure: I am part of Trade Nation's Influencer program and receive a monthly fee for using their TradingView charts in my analysis.

A Follow up to: “Adjustments for Better Readings & VSA vs BTC"When a trend approaches its end, we typically observe the formation of a buying or selling climax. That was certainly the case during Wyckoff’s era. Everything he described—market manipulation, signals, footprints—remains relevant today. But you know what that also means: if it's out there, it’s old news.
Yes, this is still happening, but we need to acknowledge that this information is no longer exclusive. And when a method becomes well-known—especially among retail traders—it can be used against them. Wyckoff himself hinted at this: the manipulators can and do use these same technical patterns to deceive. His real message?
“Keep an open mind.”
📉 In our current BTC chart, we’re seeing a textbook example of potential manipulation. A selling climax is visible—normally a sign of trend exhaustion and a bullish reversal. But is that really the case here? Did the downtrend truly end?
On the 1-Hour timeframe, both the RSI and volume indicators suggest otherwise: a bearish continuation seems more likely.
🧱 We're also witnessing a real-time formation of a Double Top pattern, taking shape since June 6. Measured by body candle spreads (excluding wicks), we observe four touches within a key price rectangle. These align with a known candlestick pattern: the Tweezer Top, commonly associated with bearish reversals.
What’s more, all of this is happening within a supply zone—actually three marked zones on the chart. The most recent zone shows signs of offloading pressure, amplified by both the Double Top and bearish candlestick formations.
And I haven’t even touched on the rejection wicks or how bearish volume spikes are gaining strength. That’s where the principle of Effort vs. Result comes in—remember, nothing in the market is free.
📊 In line with our past two posts, note how price action (PA) shows equal highs while RSI diverges, reinforcing earlier signals. The signs are stacking up.
So, the critical question now is:
Are we heading below the $100.718 level for a confirmed Head & Shoulders pattern?
Or is this just a retest before another move?
If this way of reading the market resonates with you and you want to go deeper—whether it’s building confidence or spotting signals before they play out—I work with a small circle of traders sharing TA privately on a daily basis. Feel free to reach out.
Till next time be well and trade wisely!

Adjustments for Better ReadingsMany traders rely on technical indicators to identify opportunities for profit—that's the whole point of this game. Whether it’s scalping, day trading, swing trading, or shorting the market, most trading decisions are based on indicator readings—be it a single indicator or a combination of several.
But here’s the truth: not all traders truly understand what an indicator is. They don’t grasp its nature—let alone the fact that this nature can be adjusted.
Those who don’t understand how or why an indicator works often find themselves in stressful and uncomfortable situations. It’s no coincidence that we often hear the common phrase: “Only 1% of all traders succeed, while 80% blow their accounts, and the remaining 19% barely break even.”
Why? Because the elite traders understand something most don’t:
Whether an indicator is leading or lagging, it can be customized to behave differently across different timeframes.
These adjustments can be found in the settings section of every indicator.
Let’s take the Relative Strength Index (RSI), which I’ve mentioned in previous ideas. Some of you may have noticed that my RSI plot looks different from yours. That’s because I don’t use the default 14-period RSI, which averages out the last 14 candles.
RSI is naturally lagging by default—but that doesn’t mean it can’t be trusted. In fact, with the right adjustments, that lagging nature can become leading. Learn how to do this. Push yourself. Educate your mind. Master this, and you might just find yourself among the top 1%.
Markets react to signals—signals that are often hidden in plain sight, created by the big players who always leave behind footprints. This is the trader’s true skill: seeing the whole picture.
A good friend once told me: Be a detective.
Now let’s go to the chart.
We clearly see a bearish strength unfolding.
Not only is the 9-period RSI plot trending below the yellow 28-period Weighted Moving Average (WMA), but we also observe a healthy continuation of the downtrend, confirmed by the WMA itself.
Using a 9-period RSI gives faster signals, while the 28 WMA offers smoother confirmations. This combo is applied on the daily timeframe—but every timeframe has its own ideal settings.
Now, when the RSI plot trends above the WMA, this can act as a potential reversal signal or even a confirmation of a trend change, depending on the broader market structure and volume context. It's not just about the crossover—it’s about what follows next. That’s where the detective work begins.
What do we see today?
Looking solely at the daily timeframe, the downtrend seems far from over. But to analyze it professionally, we must wait for the candle of Friday, June 6th, 2025 to close.
Switching to the lower timeframes, we see something interesting—a sort of bullish dominance unfolding during this incomplete trading day. But the real question is: Is it actual dominance?
Let’s break it down:
We have a clearly formed Head & Shoulders pattern.
The bearish Marubozu candle from June 5th made a new lower low (LL).
But—it did not close below the key swing low at 100.718.
Therefore, the Head & Shoulders pattern is not confirmed—it hasn’t broken and closed below that swing level.
So what’s happening in the lower timeframes?
In the 4-hour timeframe, we’re seeing a real-time crossover above the WMA (though the session isn’t closed yet).
In the 1-hour timeframe, the crossover has already occurred.
Now, such a crossover—where the RSI plot moves above the WMA—can often act as an early signal for a reversal, or at the very least, indicate a strong pullback. But don’t take it at face value—context is king. This is why we pair it with other signals like divergence, price action, and volume behavior for confirmation.
Across the 4H, 3H, and 1H timeframes, we’re observing this bullish pullback, yet it’s accompanied by an RSI Hidden Bearish Divergence (see: Macro Noise vs Micro Truth: The Art of Hidden Divergences).
Is this pullback a true reversal?
According to Volume Spread Analysis (VSA) (read: VSA vs BTC: Into a Bearish Scenario or Not?), a new narrative is emerging—but not without contradiction.
Price is climbing, yes.
But bullish volume spikes are declining, supporting our RSI hidden divergence. This volume-price disagreement is a clue.
What will reveal the truth?
Today's closing candle.
If price action (PA) creates a higher high (HH) but RSI creates a lower high (LH) → Bearish Divergence
If RSI makes a HH but PA creates a LH → Hidden Bearish Divergence
And for those of you who truly understand market structure:
The 100.718 level was a buy opportunity to secure profits.
If you caught that—congratulations. You’ve done your homework.
Now, you can sit back, relaxed, and wait for the next signal.
The market is a breathing organism. If you’re in sync with it—you’ll feel it.
And for those who believe there’s more to learn—but are struggling to find answers—there’s no shame in asking questions.
Till next time, take care—and trade wisely.
P.S. RSI plot, WMA, candlestick patterns, and Volume Spread Analysis (VSA)—when combined and used properly—can become a powerful toolset. For those willing to go deeper, they’re more than enough.
