ROUTEMOBILE-BUYPlease strictly follow the levels on the chart.
Trigger Target and SL as provided.
For Second Target, carry only 25% of original purchase.
Indiastocks

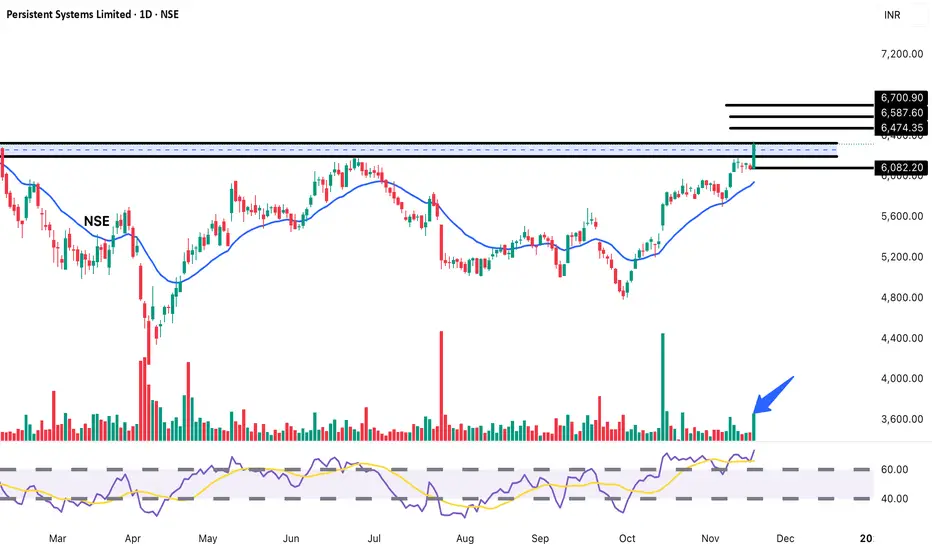
Persistent Systems: Explosive Breakout | Digital Transformation STRONG BUY Setup 💻
Entry: ₹6,316-6,340 (Current Level)
Target 1: ₹6,474-6,500
Target 2: ₹6,587-6,620
Target 3: ₹6,700-6,750
Target 4: ₹6,900-7,000+ (Extended Breakout Target)
Stop Loss: ₹6,082
Technical Rationale:
MASSIVE BREAKOUT from year-long resistance at 6,250 (horizontal black line at top)
Explosive +3.89% surge with exceptional volume spike (874.8K - highlighted with blue arrow)
Breaking above major resistance zone decisively on daily chart
Trading above long-term horizontal resistance after multiple tests throughout 2025
Volume is highest in months - institutional buying evident
Strong uptrend intact - trading above rising EMA (blue curve)
RSI around 65-70 - strong bullish momentum with room for upside
IT Services sector showing strength - digital transformation demand
Multiple resistance levels mapped: 6,474, 6,587, 6,700
Clear support established at breakout zone 6,250 and 6,082
Previous all-time high territory being challenged
Pattern shows consistent higher lows since October bottom
Risk-Reward: Excellent 1:2.5 to 1:4+ ratio depending on targets
Pattern: HORIZONTAL RESISTANCE BREAKOUT on DAILY Chart - breaking year-long ceiling with exceptional volume
Strategy: Medium-term swing to positional (weeks to months)
Book 20% at T1 (6,490), 20% at T2 (6,600), 20% at T3 (6,725)
Hold remaining 40% for extended target 6,900-7,000+
Trail SL to 6,320 after crossing T1
Disclaimer: For educational purposes only. Not SEBI registered.
Eicher Motors – Breakout Trade SetupPrice has broken out of a 2-month consolidation range (₹6,880–₹7,200) with strong volume.
This indicates momentum continuation toward upper resistance levels.
✅ Buy Above: ₹7,200 (Breakout confirmation zone)
🎯 Targets (Swing / Short-Term):
T1 – ₹7,227
T2 – ₹7,336
T2 – ₹7,468
🛡️ Stop-Loss: ₹6,880 (below range support + 20EMA area)
⏳ Duration:
5–10 trading sessions (short-term swing trade)
📈 Reasoning (Professional View):
Breakout from a long consolidation box
Strong bullish candle + volume expansion
RSI breakout above 60 shows momentum shift
Above 20EMA after a sharp reversal
education purpose only

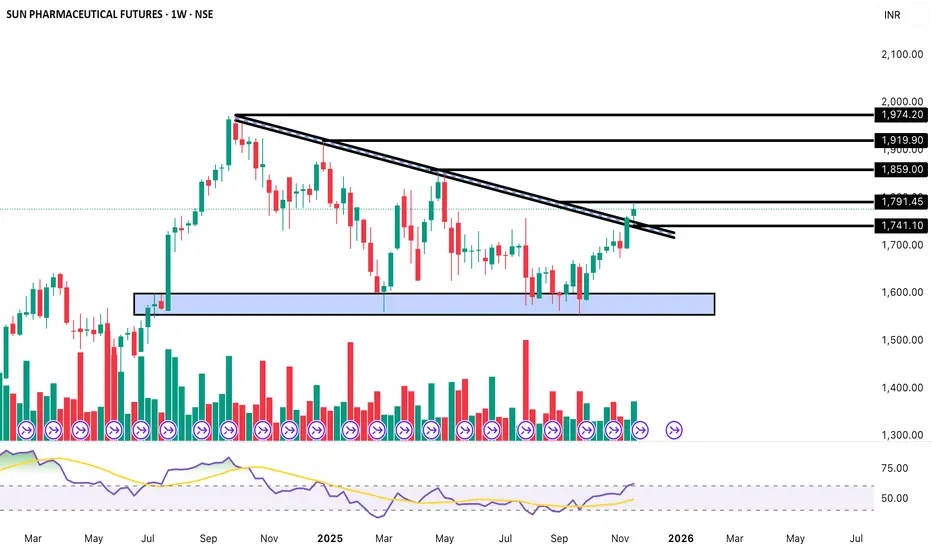
Major Trendline Breakout on Weekly | Multi-Month Rally Setup📌 Buy Zone (Weekly Breakout Confirmation):
₹1,780 – ₹1,795
🎯 Targets (Positional):
T1 – ₹1,859
T2 – ₹1,919
T3 – ₹1,974
🛡️ Stop-Loss (Weekly):
₹1,740 (below retest + trendline confluence)
⏳ Duration:
4–8 weeks (Positional swing)
SEQUENT: 12-Month Rectangle Breakout | Pharma Stock Explosion STRONG BUY Setup 🧬
Entry: ₹238-242 (Current Level)
Target 1: ₹246-250
Target 2: ₹254-258
Target 3: ₹265-275+ (Extended)
Stop Loss: ₹229
Technical Rationale:
MASSIVE BREAKOUT from year-long rectangle consolidation (160-230 range - blue shaded area)
Explosive +10.90% surge - strongest single-week move in chart history
Weekly chart showing powerful bullish momentum
Breakout candle with huge body - conviction move
Timer shows "1d 19h" - breakout just occurred, momentum building
Trading well above rising EMA - strong bullish reversal
RSI spiking above 80 - extreme strength (though overbought warning)
Volume at 6.98M - significant for weekly timeframe
Pharma/API sector showing renewed strength
12+ months of base building = strong foundation
Multiple resistance levels: 246, 250, 254
Clear support at breakout zone 229-230
Price action similar to Oct 2024 rally pattern
Risk-Reward: Excellent 1:3+ ratio for extended targets
Pattern: Rectangle Consolidation Breakout on WEEKLY Chart - extremely powerful setup. Year-long bases typically lead to sustained moves.
Strategy: Medium to long-term positional (weeks to months)
Book 20% at T1 (248), 20% at T2 (256), trail remaining 60% with SL at 235 after T1
Weekly breakouts require patience - don't exit too early
Key Levels:
Critical Breakout Zone: 229-230 (must hold for bullish case)
Strong Resistance: 246, 250, 254
Extended Targets: 270-280 (measured move from rectangle)
Major Support: 229, 220, 215
Timeframe: WEEKLY chart - this is a MAJOR positional setup for weeks/months, not a quick trade
Volume Analysis: 6.98M on weekly - substantial, confirms institutional participation
Sector: Pharma/Animal Health/API - Sequent is major API and animal health player
Measured Move: Rectangle height (~70 points) added to breakout = Target around 300
Historical Context:
Previous breakout attempts in late 2024 failed
This move has strongest momentum and cleanest breakout
Volume and price action suggest this time is different
Disclaimer: For educational purposes only. Not SEBI registered.

BSE Ltd: Breaking 6-Month Downtrend | Major Reversal SetupSTRONG BUY Setup 📈
Entry: ₹2,678-2,690 (Current Level)
Target 1: ₹2,720-2,740
Target 2: ₹2,777-2,800
Target 3: ₹2,826-2,850
Target 4: ₹2,875-2,900+ (Extended)
Stop Loss: ₹2,636
Technical Rationale:
MASSIVE BREAKOUT from 6-month falling wedge/channel (blue shaded area)
Explosive +9.07% surge with exceptional volume spike (20.3M - highlighted in cyan)
Breaking above descending trendline resistance decisively
Breaking out of "Breakout Zone" (2,500-2,636) marked on chart
Trading well above EMA (2,452.55) - strong bullish reversal
RSI at 69.05 - strong momentum with room before overbought
Price reclaiming all key moving averages
Financial services stock benefiting from market rallies
Volume is highest in months - institutional accumulation
Multiple resistance levels mapped: 2,720, 2,777, 2,826, 2,875
Clear support at breakout zone 2,636-2,650
Classic falling wedge breakout - one of most reliable bullish patterns
Risk-Reward: Excellent 1:5+ ratio for extended targets
Pattern: Falling Wedge Breakout on Daily Chart - extremely bullish reversal pattern after months of consolidation
Strategy: Medium-term swing to positional (weeks)
Book 20% at T1 (2,730), 20% at T2 (2,790), 20% at T3 (2,840), trail remaining 40% with SL at 2,700 after T1
This could be start of major uptrend
Key Levels:
Breakout Zone: 2,636-2,650 (critical support now)
Strong Resistance: 2,720, 2,777, 2,826, 2,875
Major Support: 2,636, 2,600
Timeframe: Daily chart - suitable for swing/positional traders
Volume Analysis: Exceptional volume spike (20.3M) - highest since May/June - confirms breakout authenticity and institutional buying
Sector: Financial Services/Exchange - benefits from market activity and volumes
Historical Pattern: Orange circles show previous resistance zones that were tested - now breaking out decisively
Measured Move: From wedge height, target extends to 2,900-3,000 zone
Disclaimer: For educational purposes only. Not SEBI registered.

GRSE: 6-Month Wedge Breakout | Shipbuilding Sector Rally StartSTRONG BUY Setup ⚓
Entry: ₹2,897-2,920 (Current Level)
Target 1: ₹2,955-2,980
Target 2: ₹3,018-3,050
Target 3: ₹3,087-3,120
Target 4: ₹3,200-3,300+ (Extended Breakout Target)
Stop Loss: ₹2,800
Technical Rationale:
BREAKING OUT from 6-month falling wedge/descending channel (marked with black trendlines)
Strong +5.36% surge on daily chart showing powerful momentum
Breaking above both descending trendlines convincingly
Volume at 3.47M - strong for daily timeframe
Price breaking above critical resistance zone at 2,900-2,950
Trading above major support level at 2,800 (blue horizontal line)
RSI trending upward around 65-70 - strong bullish momentum
Defense/Shipbuilding sector - strategic importance with government focus
Breaking above rectangle consolidation (2,700-2,900 range)
Multiple resistance levels clearly marked: 2,955, 3,018, 3,087
Clean breakout from multi-month consolidation
Previous high at 3,600+ shows significant upside potential
Risk-Reward: Excellent 1:4+ ratio for extended targets
Pattern: FALLING WEDGE BREAKOUT on DAILY Chart - highly reliable bullish reversal pattern combining with rectangle breakout
Strategy: Short to medium-term swing/positional (weeks to months)
Book 20% at T1 (2,970), 20% at T2 (3,035), 20% at T3 (3,100)
Hold remaining 40% for extended target 3,200-3,300+
Trail SL to 2,920 after crossing T1
Disclaimer: For educational purposes only. Not SEBI registered.

DATAPATTERNS: Year-Long Wedge Breakout | Defense Sector Monster STRONG BUY Setup 🛡️
Entry: ₹3,100-3,120 (Current Level)
Target 1: ₹3,271-3,300
Target 2: ₹3,438-3,470
Target 3: ₹3,600-3,650+ (Extended - Breakout Target)
Stop Loss: ₹2,884
Technical Rationale:
MAJOR BREAKOUT from year-long falling wedge/descending channel (blue shaded area)
Explosive +18.52% surge - massive weekly gain showing strong momentum
Breaking above descending trendline resistance decisively
Weekly chart showing powerful bullish reversal
Volume at 10.32M - exceptionally strong for weekly timeframe
Trading well above the descending channel that dominated since May 2024
RSI spiking towards 70 - strong bullish momentum
Defense/Electronics sector - strategic importance, government focus
Multiple resistance levels: 3,116, 3,271, 3,438
Strong support base established at 1,400-1,600 zone (blue horizontal area)
Breaking above critical 3,100 level that acted as resistance multiple times
Pattern similar to March 2024 rally that went from 2,300 to 3,600+
Risk-Reward: Excellent 1:2.5+ ratio for immediate targets, 1:5+ for extended
Pattern: FALLING WEDGE/DESCENDING CHANNEL BREAKOUT on WEEKLY Chart - one of the most reliable bullish reversal patterns
Strategy: Medium to long-term positional (weeks to months)
Book 25% at T1 (3,285), 25% at T2 (3,450), hold 50% for extended target 3,600+
Trail SL to 3,050 after crossing T1
This is momentum + pattern breakout - could be explosive
Disclaimer: For educational purposes only. Not SEBI registered.

BHARATFORG Breaking Out | Targets 1,400+BUY Setup 🔨
Entry: ₹1,300-1,305 (Current Level)
Target 1: ₹1,330-1,340
Target 2: ₹1,365-1,375
Target 3: ₹1,400+ (Extended)
Stop Loss: ₹1,275
Technical Rationale:
Strong bullish momentum with +4.56% gain today
Breaking above major descending trendline resistance (visible from June highs)
Consolidation breakout from 1,265-1,285 range
Good volume (3.45M) supporting the breakout
RSI around 65, showing strength with room for further upside
Price attempting to cross key resistance at 1,300 psychological level
Falling wedge pattern breakout - typically bullish
Auto sector strength supporting the move
Support established at 1,280 zone
Risk-Reward: Favorable 1:3 ratio
Pattern: Descending wedge breakout - classic bullish reversal pattern
Strategy: Positional trade - Book 40% at T1 (1,335), 30% at T2 (1,370), trail remaining with SL at 1,310 after T1
Key Levels:
Strong Resistance: 1,310, 1,340, 1,365
Support: 1,280, 1,265

SANGAM (INDIA) LTD – Volume Breakout with Bullish MomentumCMP: ₹466.6
🟢 Buy Zone: ₹460–465 (on minor pullback or consolidation)
🎯 Targets:
Target 1: ₹481
Target 2: ₹490
Target 3: ₹497
🔻 Stop Loss: ₹447 (below recent swing low)
⏳ Duration: 5–10 trading days (short-term swing setup)
SANGAM (India) Ltd has shown a strong bullish breakout above the resistance zone with a surge in volume (see chart). The RSI reversal from mid-levels confirms renewed momentum. Sustaining above ₹457 could push price towards ₹490–₹497 levels in the coming sessions. A healthy retest near ₹460–₹465 offers a low-risk entry opportunity.
Risk–Reward: 1:2.5 (Favorable for short-term swing traders)
⚠️ Disclaimer:
This analysis is for educational purposes only and not financial advice. Always do your own research before investing or trading.

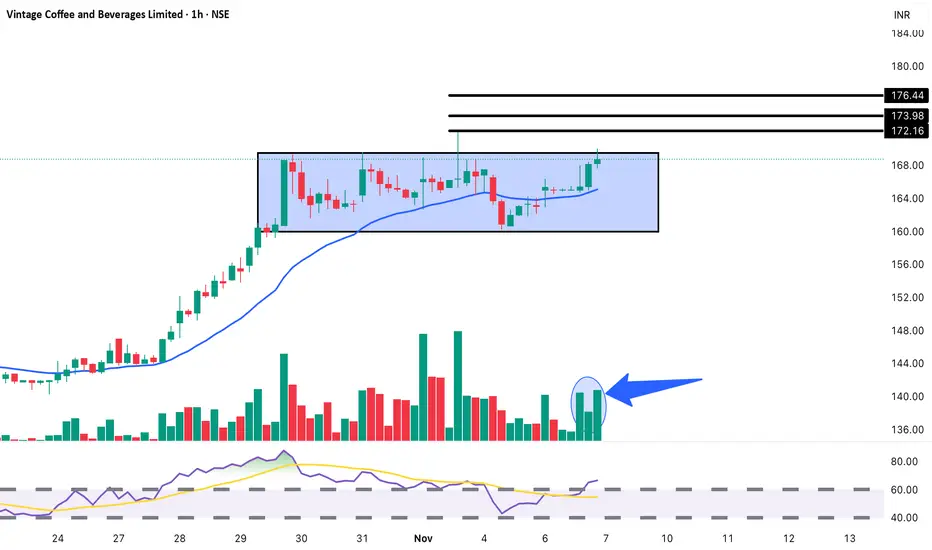
Vintage Coffee & Beverages: Rectangle Pattern Swing Trade SetupBUY Setup ☕
Entry: ₹168-169 (Current Level)
Target 1: ₹172-173
Target 2: ₹174-176
Target 3: ₹180+ (Breakout Extension)
Stop Loss: ₹164
Technical Rationale:
Rectangle consolidation pattern (160-169) visible on 1-hour chart (blue shaded zone)
Holding strong at upper range of consolidation
Volume spike highlighted (blue arrow) - showing buying interest
Strong uptrend from 144 to current levels
Trading above rising EMA - bullish trend intact
RSI trending upward around 70 - strong momentum
Small-cap F&B stock showing resilience
Volume at 1.31M - decent for 1H timeframe
Multiple resistance levels clearly marked: 172, 174, 176
Support well-established at 164-165 zone
Coiling pattern - compression before expansion
Risk-Reward: Good 1:3+ ratio
Pattern: Rectangle consolidation on 1H chart - typically a continuation pattern after strong uptrend
Strategy: Intraday to short-term swing (1-3 days)
Book 40% at T1 (172.50), 30% at T2 (175), trail remaining with SL at 169 after T1
Aggressive traders can add on break above 169.50 with volume
Key Levels:
Breakout Zone: 169-170 (upper rectangle boundary)
Strong Resistance: 172, 174, 176
Critical Support: 164, 162, 160 (rectangle base)
Timeframe: 1-hour chart - suitable for intraday/swing traders
Volume Analysis: Recent volume spike (highlighted) suggests accumulation at upper range - bullish sign
Sector: F&B/FMCG - relatively defensive sector
Note: Currently showing strength with +0.36% gain. Watch for breakout above 169.50 with volume for confirmation.
Disclaimer: For educational purposes only. Not SEBI registered.
Gap-Up Alert: Hind Rectifiers | Rectangle Breakout ConfirmedBUY Setup ⚡
Entry: ₹1,803-1,810 (Current Level)
Target 1: ₹1,832-1,840
Target 2: ₹1,851-1,860
Target 3: ₹1,875-1,890 (Extended)
Stop Loss: ₹1,775
Technical Rationale:
Massive breakout from rectangle consolidation (1,600-1,800 range)
Explosive +5.00% surge with exceptional volume (84.66K)
Breaking above long-term resistance at 1,800 with strong conviction
RSI spiking to 69.43 - strong bullish momentum
Gap-up opening showing institutional buying interest
Trading well above EMA (1,663.41) confirming uptrend
V-shaped recovery from October lows
Power electronics/rectifier sector gaining traction
Multiple resistance levels mapped: 1,832, 1,851, 1,875
Clear support established at 1,747-1,775 zone
Volume significantly above average confirming breakout
Risk-Reward: Good 1:2.5+ ratio
Pattern: Rectangle breakout + Gap-up - powerful combination for continuation
Strategy: Short to medium-term swing - Book 35% at T1 (1,835), 35% at T2 (1,855), trail remaining with SL at 1,810 after T1
Key Levels:
Breakout Zone: 1,800 (critical level crossed)
Strong Resistance: 1,832, 1,851, 1,875
Major Support: 1,775, 1,747, 1,720
Sector Catalyst:
Power sector demand increasing
Electronics manufacturing push
Infrastructure spending
Caution: Already up 5% today - consider waiting for minor pullback to 1,790-1,795 for better entry, or enter in tranches
Disclaimer: For educational purposes only. Not SEBI registered.

Buy Kfin Technologies above 1,145 INR Buy Kfin Technologies above 1,145 INR.
Target: 1,180 / 1,220 INR.
Stoploss: 1,078 INR.

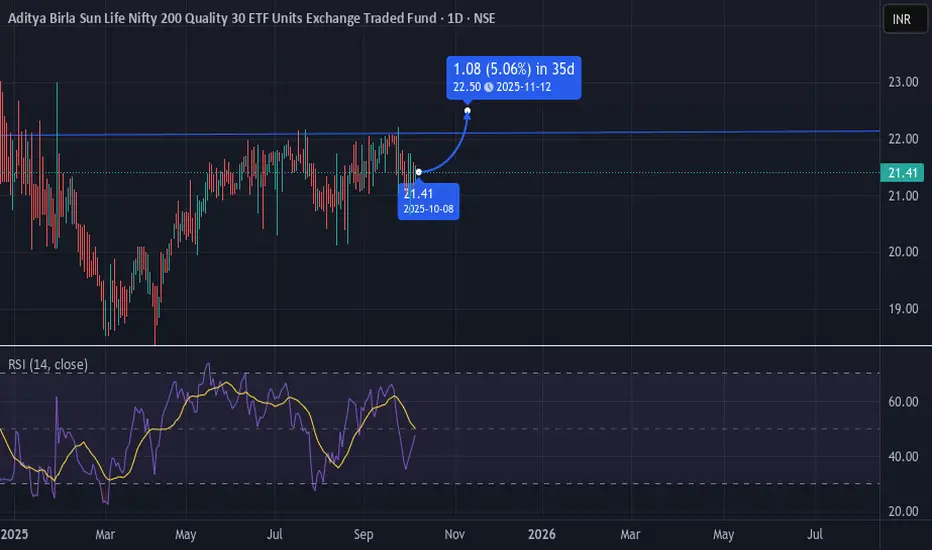
NIFTYQLITY LongNIFTYQLITY near resistance level, if this level breaks good chances of rally up
RSI level looks positive in long term 🟢
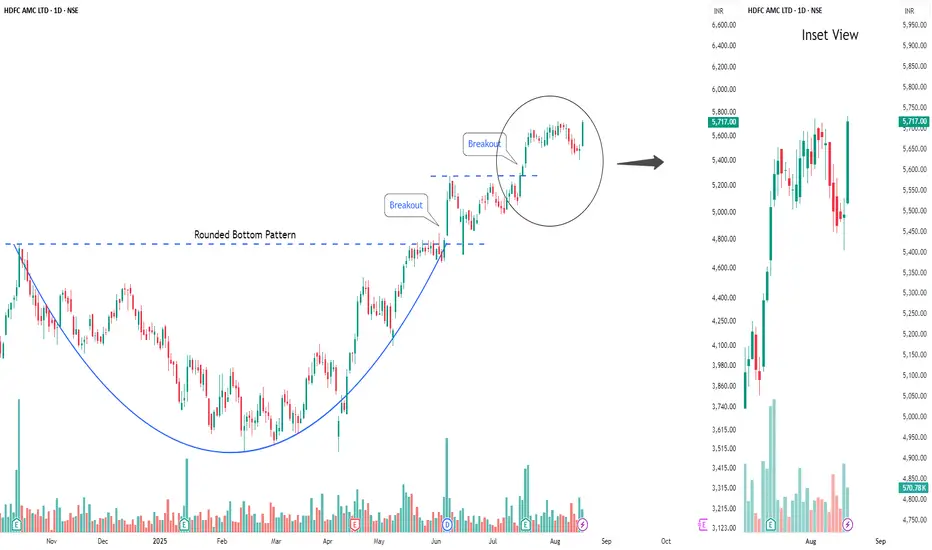
Buy HDFC AMCShort Term Trading Advice by Goodluck Capital
Buy HDFC AMC
● Buy Range- 5600 - 5700
● Target- 5900 - 6000
● StopLoss- below 5380
● Upside Potential- 4% -5%
● Approx trade duration 14 - 15 days
IREDA India should target 253.8Daily chart,
The stock NSE:IREDA has crossed a falling expanding wedge, and the target is 253.8, passing through a strong resistance level at 234.3
However, there is a strong Resistance line R, currently around 172.7
So, after stabilizing above 172.7 for 2 days, the target should be confirmed for a new entry (buy)
Consider a stop loss below 154, and raise the level along with the bullish movement.
Technical indicators:
RSI is forming a bullish direction - positive
MACD is about to cross up the zero line - To be assertive after crossing both the zero line and its signal.

JUSTDIAL LTD Falling Wedge (Bullish breakout)🔁 Chart Analysis Summary
Weekly RSI is reversing from oversold levels and shows bullish divergence.
Volume on breakout candle confirms strength.
Clear breakout above falling wedge indicates a trend reversal.
✅ Buy Recommendation
Buy above: ₹925 (Confirmation of breakout)
Target 1: ₹1,050
Target 2: ₹1,250
Target 3: ₹1,400+ (Long-term potential based on pattern projection)
❌ Stop Loss
SL: ₹840 (Below wedge support & recent low)
for educational purposes only

$NSE:TATAELXSI Learnings - Time correction/opportunity costNSE:TATAELXSI
🔰Analyzing Tata Elxsi: A Case of Valuation & Earnings Stability ⤵️
🔰 PE Ratio Halved: From 100 to 50
✅ The PE ratio dropped from around 100 to 50, signaling a shift in market sentiment or correction from an overvalued state.
🔰 Timewise Correction, Not a Price Drop
✅ The stock has gone through a timewise correction with sideways movement instead of a steep decline.
↳ This often indicates consolidation after a significant rally.
🔰 Earnings Stability
✅ Despite the PE decline, EPS (Earnings Per Share) remains stable or slightly increasing.
↳ A positive indicator that the company’s earnings capacity is intact.
🔰 Market Sentiment vs. Fundamentals
✅ The PE ratio drop without a corresponding decrease in earnings shows a recalibration of growth expectations.
↳ Remember, valuation and market sentiment can diverge from a company’s actual performance.
🔰 Timing is Key
✅ Entering when valuation is high can lead to modest returns, even if the company performs well.
↳ Patience and strategic timing are crucial.
🔰 Long-Term Perspective
✅ Tata Elxsi’s stable earnings during a timewise correction show the benefits of holding strong fundamentals over short-term volatility.
🔰 Strategic Takeaway
✅ Look beyond PE ratios—understand the business, sector dynamics, and macroeconomic factors.
↳ Align your investment strategy with market conditions and company performance.

Multiyear breakout- going steel strong !!BSE:RUDRA
Research Report: Rudra Global Infra Products Ltd.
1. Company Overview
Rudra Global Infra Products Ltd. (RGIPL) is a significant player in the Indian steel manufacturing sector, specifically focusing on TMT Bars production. Incorporated in Bhavnagar, Gujarat, RGIPL began as M.D. Inducto Cast Pvt. Ltd. in 2013, initially producing MS billets. By 2014, the company expanded into TMT Bars manufacturing, leveraging the rising demand for steel products in Gujarat. Rebranded in 2016, RGIPL has consistently grown, both in scale and scope, enhancing its capacity from 1.2 lakh tons to 2.4 lakh tons annually in its Steel Melting Shop (SMS) and Rolling Mill (RM) divisions.
Strategic Expansion:
Backward Integration: RGIPL has successfully implemented backward integration by using scrap from its ship recycling business to produce steel billets, minimizing environmental impact and reducing costs. This vertical integration provides RGIPL with a competitive edge, ensuring a steady supply of high-quality raw materials at lower costs.
Forward Integration: The company has also engaged in forward integration, expanding its product offerings and enhancing its market reach. The launch of the "Rudra TMX" brand in 2014 marked a significant milestone, positioning the company as a premium TMT Bars manufacturer.
Recent Developments:
RGIPL has diversified into aerospace and defense sectors through its subsidiary, Rudra Aerospace and Defence Pvt. Ltd., which focuses on precision and investment casting solutions.
The company has also been actively involved in sustainable practices, integrating renewable energy sources into its operations and adopting a circular economy model in its scrap processing activities.
2. Industry Outlook
Global and Indian Steel Industry:
The global steel industry is poised for moderate growth, driven by infrastructure development, urbanization, and government initiatives in emerging economies. According to the World Steel Association, the demand for steel is expected to grow steadily, with non-flat products like Bars & Rods, particularly in high demand.
India, being one of the largest steel producers globally, has seen significant growth in crude steel production, with an increase of 13.6% in 2023-24. The Indian government’s infrastructure projects, such as the National Infrastructure Pipeline (NIP) and PM Gati Shakti, are set to fuel the demand for steel products in the coming years.
Gujarat Steel Industry:
Gujarat, one of India’s most industrially developed states, contributes significantly to the country’s steel output. The state’s robust infrastructure, policy support, and strong industrial base make it a favorable location for steel manufacturing.
3. Technical Analysis
The monthly chart for Rudra Global Infra Products Ltd. (NSE: RUDRA) indicates a strong bullish breakout from a multi-year resistance level around ₹64.25, with the current price surging to ₹69.00. This breakout is accompanied by a substantial increase in trading volume, suggesting strong buying interest and potential for further upside.
Key Technical Indicators:
Moving Averages: The stock price is trading well above the 20-month and 50-month moving averages, indicating a sustained bullish trend.
Volume Analysis: The surge in volume during the breakout reinforces the strength of the move, suggesting that the stock is under accumulation by institutional investors.
Resistance and Support: Having broken through the previous resistance level, the next potential target could be ₹100, with strong support at ₹64.25.
4. Financial Highlights
Revenue Growth: RGIPL has seen consistent revenue growth, with a sales figure of ₹557.03 crores in FY 2024, up from ₹452.51 crores in FY 2023.
Profitability: The company has maintained a healthy EBITDA margin, reflecting efficient cost management and operational efficiency.
Leverage: With a debt-to-equity ratio that has decreased over the years, RGIPL is well-positioned to manage its financial obligations and fund future expansions.
5. Strategic Growth and Sustainability
RGIPL is focused on sustainable growth, integrating renewable energy sources such as wind and solar power into its operations. The company’s commitment to a zero-liquid discharge policy and efficient scrap processing highlights its dedication to environmental stewardship. These initiatives not only reduce operational costs but also enhance the company’s reputation as a socially responsible entity.
Key Milestones:
2019: Installation of a 20 MT induction furnace, doubling billet production capacity.
2023: Commencement of a continuous stand rolling mill, further increasing TMT Bar production capacity.
Future Plans: The company aims to become entirely energy self-sufficient by 2029, relying solely on renewable energy sources.
6. Conclusion
Rudra Global Infra Products Ltd. is strategically positioned to capitalize on the growing demand for steel in India, particularly in Gujarat. With its integrated operations, focus on sustainability, and recent technical breakout, RGIPL presents a compelling investment opportunity. The company’s strong financials, continuous capacity expansion, and diversification into new sectors like aerospace and defense further bolster its growth prospects.
Investment Thesis:
Bullish Outlook: The recent technical breakout and volume surge suggest a strong bullish outlook, with potential targets in the ₹100 range.
Long-Term Growth: RGIPL’s focus on backward and forward integration, along with its sustainable practices, positions it well for long-term growth in the Indian steel industry.
Recommendation:
Buy: Given the technical setup and strong fundamentals, RGIPL is a recommended buy for long-term investors looking to capitalize on growth in the Indian steel sector.
Disc: no investment as of now , however may add position if breakout sustain , if closes below previous month - exit sign
No recommendation
Source: Investor's presentation

NSE:CERA India toilet boom 🚽 get set go..Half of India couldn't access a toilet 5 years ago. Modi built 110M latrines
Incorporated in July 1998, Cera Sanitaryware Ltd is headed by Mr Vikram Somany; the company manufactures sanitaryware and faucets and outsources wellness products and tiles. The sanitaryware and faucet plants are in Kadi, Gujarat, with capacity of 36 lakh and 18.5 lakh pieces per annum, respectively.
#
The Company has been constantly launching new designs in Sanitaryware, Faucets and Tiles. The new designs are indigenously developed by in-house teams, after feedback from the market. This helps the Company to be seen a leader in product offerings. #
NSE:CERA

BSE ltd - what's my trade plan 📈💡NSE:BSE
Performance: BSE LTD's performance in the market has been stable with significant growth in its key business segments.
Market Dominance: BSE LTD continues to dominate as one of the leading stock exchanges in India, dealing with a wide array of asset classes.
Technological Advancements: BSE LTD has made significant technological advancements to provide efficient and robust trading systems.
Revenue Streams: BSE LTD has diverse revenue streams such as transaction charges, depository charges, membership fees, and listing fees, contributing to its stable financial performance.
Regulatory Compliance: BSE LTD operates under strict regulatory compliance, ensuring the interest of investors.
Partnerships: BSE LTD has formed strategic partnerships globally, enhancing its market reach and influence.
Investment Opportunities: With a high potential for growth, BSE LTD presents promising investment opportunities for traders and investors.
disc: Invested , will look for averaging up

Kovai Medical - Small and beautiful BSE:KOVAI
#kovaimedical
10 year Glance
Medical College
Added some new capex
Disc: Invested, DYOR

DALBHARAT has 55% upside open from CMP...15% in near term.Another day another Cement stock!
The cement sector does not seem to have any shortage of upside potential even in 2024.
Another stock with a good trading setup is DALBHARAT.
The stock is entering into wave III of Wave III of Wave 3(i know it sounds crazy but that's how the extensive sub-division of cement stocks has been)
INR 2260 which happens to be reversal point today intraday for the stock will act as a crucial support for the stock.
INR 2600 could be the very near-term target on the stock while INR 3500 will the target for those who wish to hold this for a bit longer duration.
The Risk-reward from current levels can not really get better.
