MAHLOG is on the verge of breaking out of 2.5years old trendlineThe stock is attempting to breakout from a major trend line resistance that has kept the stock in a 'downtrend' for almost 2.5years now.
A close above INR 400 could mean a quick run for the stock towards INR 420 level.
Above INR 420 however is the region where the stock would almost 'fly' towards INR 500.
But since 420 is a prior supply zone one could expect some congestion in the 400-420 zone before the stock takes out 420.
INR 360-420 can also be considered as a long term accumulation range in the stock. The stock has spent almost 10-11 months in this range giving ample time to the interested parties to accumulate it for the future.
A breakout above the trendline and also above 420 could provide some great momentum to the stock in coming weeks/months to scale up to INR 500 mark.
Note*- The explanation of chart is based on personal opinions/observations. Please do your own research before making any trading/investing decisions.
Indiastocks

TDPS preparing for a zonal breakout and 15-20% rally!!The stock had given a successful breakout from a major resistance/supply zone of INR263-270 in Nov 2023 and subsequently formed a one month trading range right above the breakout zone.
INR 285-290 is now the new resistance zone that the stock is now eyeing to breakout out from in order to go past the INR 300 mark.
On Wednesday's trading session the stock broke out from a minor trend line resistance with a slight uptick in volume. This minor breakout can provide the necessary fuel for the stock to clear the INR285-290 zone with some momentum.
CMP - 278
SL - 264(5%)
TARGET - 320(15%)
RR - 1:3
Note*- Not a suggestion to buy/sell but a personal opinion on the stock. Please do your own research before taking any investing/trading decisions.

A new wave began in BIOCON _35% upside The bio pharma company is on its way towards the 320 in a wave 3 structure according to the Elliot wave. That shall be a 35% jump from the CMP.
The biologics major had set out an impressive impulse wave from march 2023 - Sep. 2023 and rallied around 45% during this period.
Upon the completion of the wave 1 however the company slid down in wave 2 structure(Elliot wave zig zag in this case) and completed a crucial 61.8% retracement of the Wave 1 rise.
The stock is making a move right from this crucial 61.8% retracement support level.
The Wave 3 target is projected to be around 320 zone.
It is also important to note that Biocon posted a 168% year-on-year rise in its consolidated net profit for the September quarter to Rs 126 crore. Biocon's revenues grew by 50% to Rs 3,462.3 crore. The results were declared on Friday after the market hours and the stock gained a little over 3% on Muhurat Day trading(Sunday evening).
Note*- This chart is based on personal observations/opinions. Please do your own research/analysis before making any financial decisions.

NSE : UJJIVANSFB - Train of this small finance bank left NSE:UJJIVANSFB
Ujjivan Small Finance Bank Limited is a mass market focused bank in India, catering to financially unserved and underserved segments and committed to building financial inclusion in the country. It started its operations as Ujjivan Financial Services Limited, a Non-Banking Financial Company in 2005 with the mission to provide financial services to the ‘economically active poor’ who were not adequately served by financial institutions.
disc: Invested , do you own research .

Keep your trades simple_ZYDUS_TRADE_SETUPWhen a stock gives you a clean breakout, you take it!!
INR 650 level had been providing a strong resistance to this particular stock for more than 4 months now. The stock, in an attempt to go past this resistance made few dips and rallies which led to formation of an inverted head &shoulders pattern on the chart.
INR 650 was the neckline of the pattern and the stock broke the neckline and closed above it with vol expansion on Thursday's trading session.
The target pattern projection suggests an upward target of around INR720-730 for the stock.
INR 650 should be a major support now.
CMP - INR 657
SUPPORT - INR 650
TARGET - INR 720
SL - INR 635
Note*- The views expressed are based on personal observations/opinions. Please do you own research before making any trading decisions.

TATA CONSULTANCY STOCKS.Weekly analysisHello ladies and gentleman,according my analysis To TATA CONSULTANCY STOCK .there is agreat probability long to 3862 INR.

TRADE SETUP_25% Target in NRB BEARINGSNRB Bearings Limited, engages in the manufacture, marketing, and sale of ball and roller bearings for original equipment manufacturers(OEM's) in India and internationally.
The stock is displaying clean(without overlaps) Elliot waves since March 2023 bottom. Wave v of the current structure is now kicking in with a projected price of around 330-340 zone.
In the even bigger picture this anticipated wave v would become the wave v of a bigger wave 3 bringing the wave 3 to a pause.
From current levels however the stock offers good risk/reward for a short term trade with possibly 25% gains to be made.
CMP 268
SL 253
Target 330-340

Wave V of 3 in INDIGOThe airline company is seen trying to begin the wave iii of V of 3 in an attempt to go past previous ATH and then towards the 3K mark.
It should also be noted that Indian airlines will operate a total of 23,732 flights every week during the winter schedule( approved by the Directorate General of Civil Aviation (DGCA). As per the new order, the said number of departures is an 8 per cent rise in the number of flights compared to a year ago period.
Since indigo is the largest Indian passenger carrier it will benefit from this upbeat schedule.
It presents a good trading set up with excellent RR
SL- 2390
TGT- 2790

TRADE SETUP_LIC HOUSINGFIN_10% upsideThe stock was seen rising in march 2023 in wave 1 all the way till June 2023. The retracement to this wave came in next 1month through the month of July.
Then from July till late September the stock was seen advancing up in wave 3.It spend the month of October subsequently in wave 4 corrective phase and now towards the year end, the stock is ready for wave 5 take off and can move towards 500 mark in November-December.
It should be noted that since the wave 3 was shorter than wave 1 it should be presumed that wave 5 will be the shortest and therefore a modest target of 500 is projected for this stock.
The stock is currently near a strong support area of 450.
440 can be used as a SL.
Please note the wave counts have been studied and marked on a 3hour chart.
Note*- Views expressed here are my personal observations/opinions. Always do your own analysis/research before taking up any financial position.

ULTRATECH CEMENT- PATHWAY TO 12K AS PER WEEKLY WAVE COUNTSThe largest and most prosperous cement company of India- Ultratech Cement is expected to have more upside of 30-40% from current levels as the weekly wave counts suggest.
To put it in very simple words without using too much of Elliot wave jargon, the next leg up is unfolding now which can be projected going somewhere closer to 9200.(the current wave structure technically should be labeled as 1-2-I-II-i-ii-iii-iv-v, which is simply read as Wave v of Wave III of Wave 3).
The inner rising channel boundaries can be used as a pathway until the bigger wave 3 does not complete.
I hope the chart is self explanatory and would not require too much of decoding as to what i am trying to convey.
Note*- this is not a buy/sell recommendation. this post is for educational purpose only.

NSE:BANKINDIA Bank of India nice basing??? big jump coming Bank of India
I am building basket trading for PSB stocks ( Public Sector banks) India
bank of india has been on my radar for price action basis
Stocks is forming nice base , refuse to go down
taking support on 10 MA
BSE:BANKINDIA

Apex Frozen Foods Ltd (Apex) 🫳🏿 time now ??? Apex Frozen Foods Ltd (Apex) is an integrated producer and exporter of processed shrimps based in Andhra Pradesh, South India. The company has a capacity of 29,240MT.
In Q3-FY23, Apex experienced a 1% year-on-year decline in revenue due to reduced demand in key export markets such as the US and EU, as well as a supply shortage of specific-size raw materials.
Despite the decline in export prices, the company managed to maintain stable realisation year-on-year, helped by rupee depreciation. This is because the decrease in the export price in dollars was offset by the depreciation of the rupee.
Apex's future growth will be driven by its backward integration (hatchery), an increase in the newly-added capacity, and a larger contribution from value-added products.
The company has expanded its ready-to-eat (RTE) capacity from 5,000MT to 10,000MT and anticipates starting commercial production in Q4-FY23.
Apex is currently awaiting approval to sell RTE products from the new capacity in the European market. Europe currently contributes to only 18% of total revenue.
The company's earnings are expected to grow at a 45% Compound Annual Growth Rate (CAGR) over FY22-24.
Apex is currently trading at 9x 1Yr Forward Price to Earnings (Fwd P/E). The company is valued at 10x (3Yr Average=10x) on FY24 Earnings Per Share (EPS)
disc: Invested , first trance taken

NSE : JBMA - JBM Auto for next rally for over 100%??NSE:JBMA
JBM Auto Ltd is an automotive company engaged in the manufacturing and sale of sheet metal components, tools, dies & moulds, and buses, including spare parts and maintenance contracts. 🚗💡🔧🚌
The Auto Components Segment: 🚘
Manufactures auto systems and high-level assemblies such as chassis & suspension systems, aesthetical parts, and BIW parts & assemblies. 🛠️🔩
The OEM Segment: ⚡🚌
Focuses on manufacturing technologically superior buses customized for different operating patterns. 📈
Developed and delivered electric buses, with an order book of around 1500 buses, including 200 electric ones. ⚡🚌
Tool Room Division: 🔧💼📐
Manufactures tools and dies for turnkey projects.
Major focus on safety critical items like chassis & suspension systems and key aesthetical parts.
Customer Base: 🌐🤝
Includes major OEMs like Ashok Leyland, Daimler, Nissan, Renault, Ford, Toyota, Volvo, Tata, and more.
Manufacturing Capabilities: 🏭📍🚚
15 manufacturing facilities strategically located near major OEM hubs.
Amalgamation of Subsidiaries: 💼🤝🔄
JB MA Automotive Pvt Ltd and JBM Auto Systems Pvt Ltd amalgamated with JBM Auto Ltd.
(Note: Please consult the original source for more detailed and up-to-date information)
Disc: Invested , second trance added today ,

Godfrey Phillips Possible BreakoutThe idea here is about Godfrey Phillips:
Godfrey Phillips India Ltd. operates as a holding company. It engages in the manufacture and marketing of tobacco related products. The firm operates through the following segments: Cigarette, Tobacco and Related Products and Retail and Related Products. Its cigarette brands include Marlboro, Red & White, Cavanders, Four Square, Stellar, and North Pole and Tipper.
My view is bullish short term(Swing trade) for the below observed technical factors.
Points as per TA on a Weekly Chart:
1.Contracting or Symmetrical Triangle formation on a weekly chart as per below:
2. Double Bottom formation on a weekly chart as per below:
3. Possible Bearish Gartley harmonic pattern in progress at the time of publishing as per below:
4. Ichimoku cloud Senkou Span A support established on weekly chart as per below:
5. Support established on 20 EMA & trading way above 200 EMA on a weekly chart as per below:
6. Trading above 20 & 200 EMA on daily chart.
7. Ichimoku Cloud analysis: Kumo Breakout & Kumo Twist on a daily, weekly & monthly chart is Strong for an upward momentum at the time of publishing.
8. RSI is at 52.44 on a weekly Chart and 53.73 on daily chart at the time of publishing.
9. MACD above signal line on weekly & daily chart.
10. Hull Moving average and other moving averages on a daily,weekly & monthly chart is a strong buy.
11. ADX (Average directional index ) trend strength is at 10.69 on a weekly and 8.70 on a daily chart which indicates a absent or weak trend ( ADX between 0-25 is a Absent or weak trend).
Projected Target: provided in the chart.
Stop Loss: Provided in the chart.
Disclaimer: “The above is an Educational idea only and not any kind of financial or investment advice. So please do your own DD (Due Diligence) before any kind of investment”.
Do you like my TA & ideas!!
Want to keep yourself updated with current market action? Then don’t forget boost & to subscribe for more analysis.
Do leave your valuable feedback & comments for any improvisations.
Cheers.

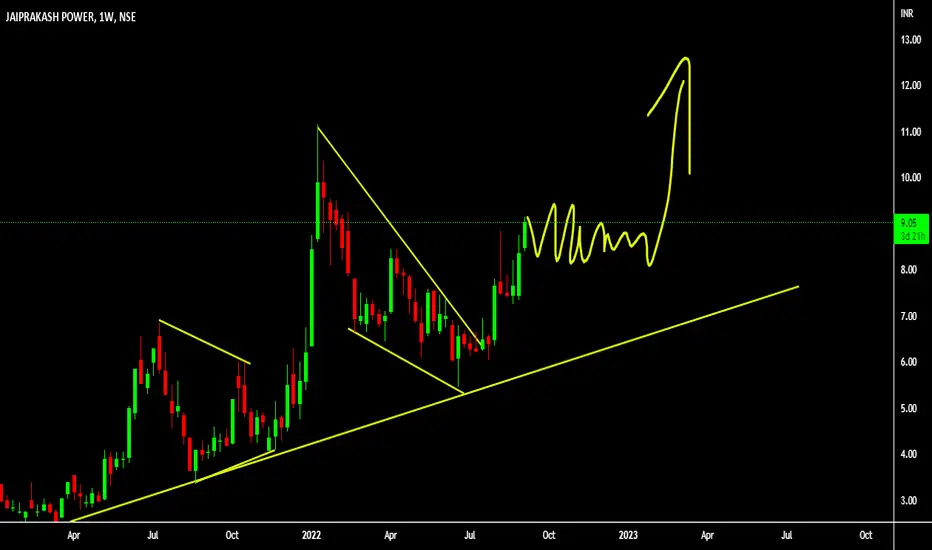
JPPOWER Wait for Bulls & Trend ReversalThe idea here is about Jai Prakash Power Ventures:
Jai prakash Power Ventures Ltd. engages in the generation of power. It operates through the following segments: Power and Transmission, Coal, and Other. The Power and Transmission segment includes generation, sale, and transmission of power. The Coal segment refers to the coal mining for captive use in energy generation. The Other segment consists of cement grinding.
My view is short term bearish & long term Bullish for the below observed technical factors.
Points as per TA on a Monthly, Weekly & daily Chart:
1. Contracting or symmetrical triangle formation observed with ABCD completed and expected move towards E on Elliott’s triangle pattern on a weekly chart as per below:
2. Cup & Handle formation observed on a Monthly chart & under ranging market at the time of publishing as per below:
3. Bearish Anti Butterfly Harmonic pattern completed swing target 2: A Swing = 6.45 which is also contracting or symmetrical triangle support zone as per below:
4. Bullish Gartley Harmonic Pattern CD leg in progress, min & max XD distance on Fib is 0.786 for Gartley which is 6.30. Which is also approx to contracting or symmetrical triangle support zone & Target 2 on Bearish Anti Butterfly Harmonic Pattern as per below:
5. Possible Inverse Head & Shoulder Pattern observed & price to be rejected @ 8.50 due to resistance zone & Bearish Anti Butterfly B point on a weekly chart as per below :
6. Elliott’s Bullish triangle ABCD points completed and Price direction towards E point on a weekly chart as per below:
7. Possible Head & Shoulder pattern observed on daily chart with support zone @ 6.75 as per below:
8. Trading way above 20 & 200 EMA on a weekly chart & 20 EMA cross over expected soon.
9. Trading above 200 EMA & 20 EMA Support on weekly chart.
10. Ichimoku Cloud analysis: Kumo Breakout & Kumo Twist on a daily & weekly is strong uptrend & monthly chart is consolidating at the time of publishing.
11. RSI is at 54.17 on a weekly Chart and 49.44 on daily chart at the time of publishing.
12. MACD above signal line on weekly & daily chart, However it is converging towards signal line on weekly chart.
13. Hull Moving average on daily is a sell and other moving averages on weekly & monthly chart is a strong buy.
14. ADX ( Average directional index ) trend strength is at 23.43 on a weekly & 11.70 on daily chart, which indicates a absent or weak trend ( ADX between 0-25 is a Absent or weak trend).
Projected Target with %: Wait for bulls to take over once the price hits 6.60 to 6.45 and enter long since the Risk to Reward looks damn good(Final % provided in chart), since the Earnings report which was on 22nd Oct 2022, looks good this week will give more clarity on Entry points,
Stop Loss: Entry only once we have confirmation for long.
Note: Any dip can be considered as accumulation.
Disclaimer: “The above is an Educational idea only and not any kind of financial or investment advice. So please do your own DD (Due Diligence) before any kind of investment”.
Do you like my TA & ideas!!
Want to keep yourself updated with current market action? Then don’t forget boost & to subscribe for more analysis.
Do leave your valuable feedback & comments for any improvisations.
Cheers.

Ambika Cotton 👚 - Result pop and long way to go from here?NSE:AMBIKCO
I am sharing my view on Ambika cotton previously several times -
from Rs1200.00 - stock is now poised for strong upside of above Rs 2200
Results that has come for this share has been exceptional
In the video I am sharing the technical and fundamental -result for 31 / 12 /2021
Disc: Invested , do you due diligence and research before taking action.

Madras Fertilizers Traiangle breakout The idea here is about Madras Fertilizers:
Madras Fertilizers Ltd. engages in the manufacture and marketing of ammonia, urea, and complex fertilizers. It also produces bio-fertilizers and markets organic fertilizers and neem pesticides.
I am short term bullish on Madras Fertilizers due to below observed technical factors.
1. Contracting or Symmetrical triangle formation on a weekly chart as per below:
2. Possible bearish Butterfly pattern under formation as per below:
3. Trading above 200 EMA & Support established on 20 EMA on a weekly chart as per below:
4. Ichimoku Cloud analysis: Senkou Span B support established on a daily chart as per below:
5. Ichimoku Cloud analysis: Kumo Break out and kumo twist strong buy for upward momentum on daily & Weekly chart.
6. RSI is at 49.47 on a Daily Chart & 55.97 on a weekly chart at the time of publishing.
7. MACD below signal line on weekly chart & way converging towards signal line on daily chart.
8. Hull Moving average on daily & monthly chart is buy & sell on Weekly chart & other moving average is a strong buy on Weekly & monthly chart.
9. ADX (Average directional index) trend strength is at 24.93 on a weekly and 25.83 on a daily chart which indicates a strong trend ( ADX between 25 - 50 is a strong trend) in the current direction.
Projected targets as per bearish butterfly patterns provided in the chart.
Stop Loss: provided in chart as per contracting or symmetrical triangle.
Disclaimer: “The above is an Educational idea only and not any kind of financial or investment advice. So please do your own DD (Due Diligence) before any kind of investment”.
Do you like my TA & ideas!!
Want to keep yourself updated with current market action? Then don’t forget boost & to subscribe for more analysis.
Do leave your valuable feedback & comments for any improvisations.
Note : use the Load new Bars forward button to know the current movement.
Cheers.

JP POWER WEEKLY TIME FRAMEThe Structure looks good to us, waiting for this instrument to correct and then give us these opportunities as shown on this instrument (Price Chart).
Note: its my view only and its for educational purpose only. only who has got knowledge about this strategy, will understand what to be done on this setup. its purely based on my technical analysis only (strategies). we don't focus on the short term moves, we look for only for Bullish or Bearish Impulsive moves on the setups after a good price action is formed as per the strategy. we never get into corrective moves. because it will test our patience and also it will be a bullish or a bearish trap. and try trade the big moves.
we do not get into bullish or bearish traps. we anticipate and get into only big bullish or bearish moves (Impulsive moves).
Just ride the bullish or bearish impulsive move. Learn & Know the Complete Market Cycle.
buy low and sell high concept. buy at cheaper price and sell at expensive price.
Keep it simple, keep it Unique.
please keep your comments useful & respectful.
Thanks for your support....
#BANKNIFTY Can Rise From The FCP Zone Traders,
BANKNIFTY Can Rise Intraday. We have an FCP zone and an unfilled gap. So watch out for this intraday opportunity. NIFTY
Rules:
1. Never trade too much
2. Never trade without a confirmation
3. Never rely on signals, do your own analysis and research too
✅ If you found this idea useful, hit the like button, subscribe and share it in other trading forums.
✅ Follow me for future ideas, trade set ups and the updates of this analysis
✅ Don't hesitate to share your ideas, comments, opinions and questions.
Take care and trade well
-Vik
____________________________________________________
📌 DISCLAIMER
The content on this analysis is subject to change at any time without notice, and is provided for the sole purpose of education only.
Not a financial advice or signal. Please make your own independent investment decisions.
____________________________________________________

ADANI TOTAL GAS (BUY)A new trend has already started and we are buying on the RSI (above the 50 zone). Here we really have a high probability of winning.

UPL - Bull Flag Pattern Consolidation - Short Term BearishUPL had a great run of 260% from COVID lows to recent All Time Highs. Now the stock has taken a breather and consolidating in a bull flag . It looks like its gonna take some more time to consolidate in the channel before giving another breakout. I see the stock is bearish short term and might just test the lower end of the channel and bounce to the upper side of the channel. UPL might retest the support levels marked on the chart 674, 635 and 621. Strong support at 621 , long term buyers can start accumulating at small positions from 635 and 621 levels.

Karnataka Bank Big Breakout after 4 Years₹Karnataka Bank Chart:-
₹Karnataka Bank Broke out Big Resistance after 4 Years.
Resistance and Inverted H&S Pattern both Broke out.
Entry:- ₹73-₹77
Targets:- ₹112/₹153
Exit:- Below $70

BANKNIFTY Chart Analysis for Friday ❗Hii Traders 😊
Welcome to BANKNIFTY Futures and options analysis for friday
🛑 if we see day frame chart of BANKNIFTY currnetly trading above all moving averages ie . 21 Day , 50 Day , 100 Day
🛑 Banknifty may take support from 21Day moving average currnetly 21 Day moving average is at 37150 whenever until banknifty managed to trade above this level then market sentiment will be positive
🎯 Key levels to watch out for day trader
🛑 Major resistance zone for BankNifty is at 37900-37950
◽ If market breakout resistance then we can see Target of 38100
◽ Whenever until breakout that resistance level don't trade
◽ Stop loss will be 37800
◽ Whenever until banknifty didn't closed above 38150 then we can expect short term correction
🛑 Major support level for BankNifty
◽ Support level for nifty lies at 37300-37350
◽ Whenever until breakdown this level don't take a trade
◽ if Market successfully breakdown this level then we can take a trade
◽ And we can see the Target 1 will be 37000
◽Target 2 will be 36850
◽STOP loss will be 37450
◽Use Target 1 as trailing Stoploss to achieve 2nd target I sure you will not gone loose money for market
◽ Market will be indecisive between 37300-37950 (I also told this in yesterday's market analysis you check whether it's right or worng)
🛑 levels for banknifty futures will be also same
◽Go long on banknifty Futures if it breakout the resistance
◽ Don't short the market until below the 37300
◽More shorter's were active when Banknifty traded below 37300-37250 zone
🛑 TRADESHOTS
◽ Resistance level for CE buyers /option buyers is at 37900-37950
◽ support zone to buy PUT / PE is at 37300-37350
◽ BankNifty will be weaker on intraday basis below the 37600
Thanks for reading 😊
I hope that it will help a lot and if I'm wrong kindly comment mine mistake surely I will correct it
If you like it do follow for more and give reputation which will boost mine confidence to do more.
have a nice day 😊
