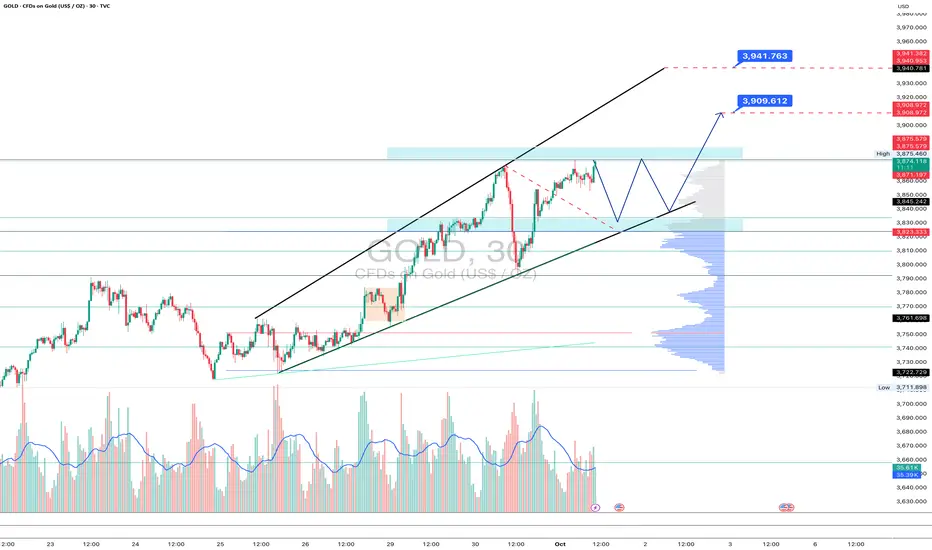
Gold is preparing a pause before a new breakthroughOn the 30-minute chart, gold remains inside the ascending channel but is showing local signs of overheating: price hit resistance around 3875 and pulled back.
The technical setup suggests a correction towards the channel support and the 0.5–0.618 Fibo zone (3833–3823), where buyers are expected to step in. If support holds, the bullish trend may resume with targets at 3909 and 3941.
Volume indicates selling pressure at highs, but the overall trend remains intact - moving averages are pointing upward, and the higher-high structure is still valid.
Tactical plan: watch how the 3833–3823 zone reacts; if buyers confirm control, gold has room for another strong push.
And if bulls rush without giving a pullback - that’s the classic “market never waits for your comfy chair” scenario.
Indicators
BRIEFING Week #39 : The Turning Point is HereHere's your weekly update ! Brought to you each weekend with years of track-record history..
Don't forget to hit the like/follow button if you feel like this post deserves it ;)
That's the best way to support me and help pushing this content to other users.
Kindly,
Phil

NVDA NVIDIA Corporation Options Ahead of EarningsIf you haven`t bought NVDA before the previous earnings:
Now analyzing the options chain and the chart patterns of NVDA NVIDIA Corporation prior to the earnings report this week,
I would consider purchasing the 150usd strike price Calls with
an expiration date of 2025-9-19,
for a premium of approximately $13.35.
If these options prove to be profitable prior to the earnings release, I would sell at least half of them.

SPY S&P 500 etf Oversold on the RSI ! 2025 Price Target ! The SPDR S&P 500 ETF Trust (SPY) is flashing a major buy signal, with its Relative Strength Index (RSI) currently sitting at 28.33 — firmly in oversold territory. Historically, every time SPY has entered oversold levels on the RSI, institutional buyers have stepped in aggressively, driving sharp rebounds in the following weeks and months.
The last time SPY dipped below the 30 RSI threshold was during market pullbacks in 2022 and 2023 — both of which were followed by significant rallies as institutions capitalized on discounted valuations. The current setup is no different. With earnings growth stabilizing, inflation cooling, and the Federal Reserve signaling a potential shift toward rate cuts in the second half of the year, the backdrop for a recovery is aligning perfectly.
Technically, SPY is also approaching key support levels that have held strong in past market corrections. The combination of an oversold RSI and strong institutional appetite at these levels creates a compelling case for a bounce.
My price target for SPY by year-end is $640, representing over 15% upside from current levels. With sentiment stretched to the downside and technical indicators flashing green, SPY looks primed for a sharp and sustained rebound. Now could be the perfect time to position for the next leg higher.

Russell 2000 Year-End Price Target and Technical Rebound OutlookIf you ahven`t bought the Double Bottom on RUT 2K:
Now the Russell 2000 Index (RUT), which tracks small-cap stocks, has recently entered oversold territory, signaling that a potential technical rebound could be on the horizon. Oversold conditions typically occur when selling pressure becomes excessive, driving the index below its fundamental value and creating an opportunity for a corrective bounce.
Several technical indicators, including the Relative Strength Index (RSI), have fallen below the 30 level — a classic oversold signal. Historically, similar setups have led to strong short-term recoveries as buying interest returns once the selling momentum exhausts itself.
Additionally, market breadth indicators suggest that the recent pullback has been broad-based, with a high percentage of RUT 2K components trading below their 50-day and 200-day moving averages. This type of widespread weakness often precedes a period of mean reversion, where prices bounce back toward key resistance levels.
Given these technical signals, my price target for RUT 2K is $2,450 by the end of the year. A rebound toward this level would represent a recovery of approximately 10-12% from current levels, aligning with previous post-oversold rallies in the index. If broader market sentiment stabilizes and small caps benefit from improving economic conditions or easing rate hike pressures, the path toward this target becomes increasingly plausible.
While downside risks remain — including ongoing macroeconomic uncertainty and geopolitical tensions — the technical setup suggests that RUT 2K is primed for a recovery in the coming months.

GOOG Alphabet Options Ahead of EarningsIf you haven`t bought GOOG before the previous rally:
Now analyzing the options chain and the chart patterns of GOOG Alphabet prior to the earnings report this week,
I would consider purchasing the 170usd strike price Calls with
an expiration date of 2025-7-18,
for a premium of approximately $4.35.
If these options prove to be profitable prior to the earnings release, I would sell at least half of them.

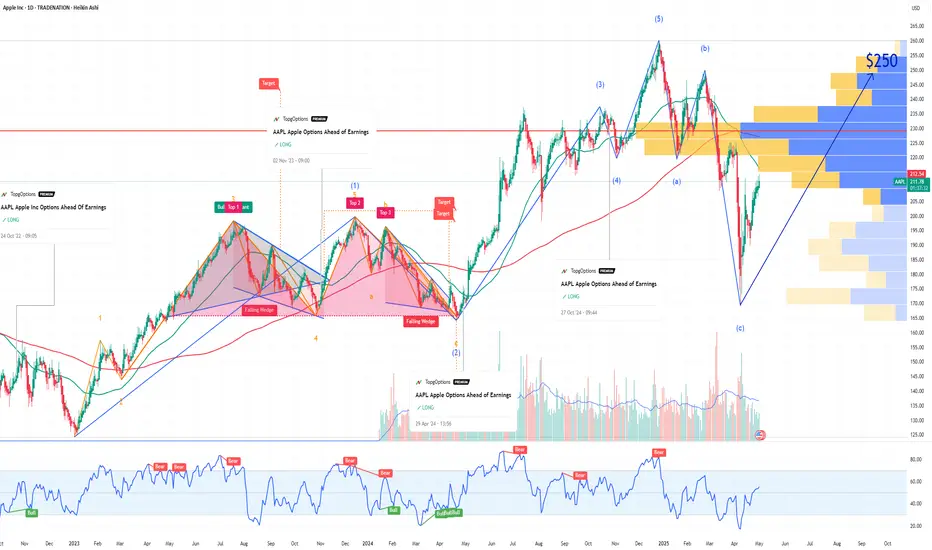
AAPL Apple Options Ahead of EarningsIf you haven`t bought AAPL before the previous rally:
Now analyzing the options chain and the chart patterns of AAPL Apple prior to the earnings report this week,
I would consider purchasing the 255usd strike price Calls with
an expiration date of 2026-1-16,
for a premium of approximately $7.30.
If these options prove to be profitable prior to the earnings release, I would sell at least half of them.
Disclosure: I am part of Trade Nation's Influencer program and receive a monthly fee for using their TradingView charts in my analysis.
BRIEFING Week #38 : Waiting for Something to Happen !Here's your weekly update ! Brought to you each weekend with years of track-record history..
Don't forget to hit the like/follow button if you feel like this post deserves it ;)
That's the best way to support me and help pushing this content to other users.
Kindly,
Phil

You See the Signals, So Why Are You Still Losing Money?The Crypto Conundrum: You See the Signals, So Why Are You Still Losing Money?
Every morning, thousands of traders boot up their rigs. Their screens light up with flashing RSI, MACD, and moving averages. Crypto Twitter is buzzing with analysts calling the next big move. All the information you could ever want is right at your fingertips. So why, by the end of the week, is your account balance smaller than when you started?
Let’s get one thing straight: the problem isn’t the indicators or the analysts. The problem is the "wetware"—the trader sitting in the chair.
You’re not losing because the signals are wrong. You’re losing because of how you react to them. Let's break down the real reasons your account is bleeding.
Reason #1: Psychology Trumps Logic. Every Single Time.
This is the #1 account killer. The market is an arena ruled by the twin demons of Fear and Greed. Your brilliant technical analysis is just a spectator.
FOMO (Fear Of Missing Out) – The Rocket Ship Trap
The Scene: Some altcoin, let's call it $WAGMI, has pumped 30% in an hour. Every indicator is screaming "overbought." Analysts are saying the news is already priced in. But all you see is a giant green candle. Your brain screams, "What if this thing 100x's? I gotta get in on this rocket ship!"
The Action: You ape in at the top.
The Result: The early buyers start taking profits, and the price nosedives. You're left holding the bag, wondering what went wrong and blaming "market manipulation."
The Mistake: You let an emotional impulse override every logical signal in front of you.
FUD (Fear, Uncertainty, and Doubt) – The Paper Hands Plague
The Scene: You entered a trade following your rules perfectly. The price bounced off a key support level, and the RSI showed a bullish divergence. But an hour later, the market dips slightly, and you're down 2%. A vague headline about crypto regulation in some far-off country flashes across your feed.
The Action: Panic. You slam the "close position" button to "cut your losses before it gets worse."
The Result: A few hours later, the price reverses and rips upward, hitting the exact target you originally set for a 15% gain.
The Mistake: You abandoned your own system because you got spooked by market "noise."
Reason #2: You Have No System. You Have a Gambling Habit.
An indicator signal isn't a magic bullet; it's just one piece of the puzzle.
"Indicator Soup"
The Scene: Your chart is a mess. You’ve got RSI, MACD, Stochastic, Bollinger Bands, and the Ichimoku Cloud all layered on top of each other. One says buy, another says sell, and a third is neutral.
The Action: You either freeze up from "paralysis by analysis" or, even worse, you cherry-pick the one signal that confirms what you wanted to do anyway.
The Result: A series of chaotic, random trades. Any profits are pure luck; the losses are inevitable.
The Mistake: Believing that more indicators equal more certainty. In reality, it just creates noise and confusion.
Ignoring the Stop-Loss: The Ultimate Sin
The Scene: You enter a long position based on a solid signal. But the price immediately starts moving against you. You told yourself you'd exit at a 5% loss, but as the price hits your stop level, you think, "It's gotta turn around any second now. I don't want to lock in a loss."
The Action: You delete your stop-loss, turning what was supposed to be a quick trade into a long-term "investment" you never wanted.
The Result: That 5% loss snowballs into a 20%, then 50% loss, tying up your capital and killing your account.
The Mistake: You violated the golden rule of trading: protect your capital. Hope is not a strategy.
Reason #3: You're Missing the Forest for the Trees
Indicators are useless without understanding the broader market context.
The Scene: The RSI on the 4-hour chart is deep in "oversold" territory—a classic buy signal.
The Action: You go long.
The Result: The price keeps tanking. Why? Because you failed to zoom out. On the daily chart, the asset is in a brutal, multi-month downtrend. A bullish signal in a bear market is often just a bull trap, a brief pause before the next leg down.
The Mistake: You analyzed a single timeframe in a vacuum, ignoring the primary trend.
So, What's the Fix? It's All About Strategy.
A real trading strategy isn't just "buy when the green line crosses the red one." It's a non-negotiable set of rules that dictates your every move. It must include:
Entry Trigger: Exactly what conditions must be met to open a position.
Example: The price must be above the 200-day EMA (confirming an uptrend), and MACD must have a bullish cross on the 4-hour chart.
Stop-Loss (Your Exit for a Loss): A pre-defined price point where you get out, no questions asked. This is your insurance policy against catastrophic loss.
Example: Place the stop-loss just below the most recent swing low.
Take-Profit (Your Exit for a Win): A pre-defined target where you lock in gains. Your potential profit should always be significantly larger than your potential loss (a good Risk/Reward Ratio is at least 2:1).
Example: If your stop-loss is 3% below your entry, your first take-profit target should be at least 6% above it.
A Simple, No-Nonsense Strategy Framework:
Concept: Trade with the trend, not against it.
Toolkit: The 200-day Exponential Moving Average (EMA) for the main trend, and basic support/resistance levels.
The Rules:
If the price is above the 200 EMA on the daily chart, you ONLY look for buys (longs).
Wait for the price to pull back to a key support level.
Enter a long position ONLY when you see a confirmation signal at that level (like a bullish engulfing candle).
Place your stop-loss below that support level. Place your take-profit at the next resistance level.
If the price is below the 200 EMA, you do the exact opposite and ONLY look for sells (shorts).
The Bottom Line
Indicators, charts, and expert analysis are just tools. In the hands of a disciplined craftsman, they can build wealth. In the hands of an emotional amateur, they’re just a way to smash your own thumb.
You lose money not because your tools are bad, but because you lack a plan, discipline, and risk management. Success in trading isn't about finding a holy grail indicator. It’s about the boring, repetitive work of following your rules, day in and day out.
The market doesn't pay you for being smart; it pays you for being disciplined. Period.

JOE ANALYSIS📊#JOE Analysis
✅There is a formation of Descending triangle pattern on daily chart🧐
Pattern signals potential bullish movement incoming after a small retest 📉
👀Current Price: $0.1944
🚀 Target Price: $0.2370
⚡️What to do ?
👀Keep an eye on #JOE price action and volume. We can trade according to the chart and make some profits⚡️⚡️
#JOE #Cryptocurrency #TechnicalAnalysis #DYOR

BB ANALYSIS🔆#BB Analysis : Channel Following ⛔️⛔️
As we can see that #BB is following ascending channel on daily time frame. We can see a bullish formation here. And if it trade with good volume then we can see a proper bullish move in #BB 📈📈
Also there is an instant resistance zone and if it breaks with good volume when we would see a huge movement
🔖 Current Price: $0.1714
⏳ Target Price: $0.2323
⁉️ What to do?
- Keep your eyes on the chart, observe trading volume and stay accustom to market moves.🚀💸
#BB #Cryptocurrency #ChartPattern #DYOR

Why AI Could Rise Sharply Before Friday's Options ExpirationIn a market where enterprise AI spending is projected to hit $100B+ by 2026, C3.ai's 130+ turnkey apps (from supply chain optimization to ESG tracking) position it as a must-have for Fortune 500 digital transformations.
Trading at around $17.27 as of midday September 15, down a staggering 33% over the past month, the stock has been battered by leadership turmoil and disappointing quarterly results.
But for options traders eyeing the September 19 expiration, this could be the setup for a sharp rebound. Last month, we loaded up on those $25 strike calls, a tough grind to profitability amid the sell-off, but with fresh tailwinds emerging.
From a charting perspective on TradingView, the stock is testing support near its 200-day moving average around $16.50, with volume spiking on the downside but showing signs of capitulation.A bounce from here isn't just wishful thinking—it's backed by historical patterns. In similar drawdowns earlier this year, NYSE:AI rebounded 15-20% within a week on lighter selling pressure. With the broader Nasdaq futures pointing higher amid cooling inflation data, a risk-on rotation could propel NYSE:AI toward $20+ resistance by expiration, putting those $25 calls back in the money.
Smart money appears to be accumulating; recent options flow shows unusual call volume at the $20 and $22 strikes, hinting at bets on a quick snapback.
New CEO Stephen Ehikian: A Stabilizing Force with Proven PedigreeThe elephant in the room has been the abrupt CEO transition. Founder Thomas Siebel stepped aside for health reasons in late July, triggering a sales slowdown and the withdrawn full-year guidance that spooked investors.
Ehikian isn't just a placeholder; he's a serial innovator with deep ties to enterprise software giants. He built RelateIQ (acquired by Salesforce to form Einstein) and Airkit.ai (now core to Salesforce's Agentforce), and most recently served as Acting Administrator of the U.S. General Services Administration under President Trump.
His track record in scaling AI integrations could accelerate C3.ai's federal deals, which already made up a chunk of Q1 wins (e.g., expansions with the U.S. Air Force).
In his first comments, Ehikian emphasized capturing the "immense market opportunity in Enterprise AI," and whispers from the Street suggest he's fast-tracking partner integrations with Microsoft and AWS—key channels that drove 155% YoY growth in partner-sourced deals last quarter.
This leadership reset screams "buy the dip" for contrarians.3. Solid Q1 Fundamentals Amid AI TailwindsDon't let the headlines fool you—C3.ai's fiscal Q1 2026 results (ended July 31) weren't a disaster; they were a pause in an otherwise accelerating growth story. Revenue hit a record $87.2 million, up 21% YoY, with subscription revenue (86% of total) climbing to $60.3 million.
The company closed 71 deals—more than double last year's tally—and federal expansions highlight sticky demand for its Agentic AI platform.
Options Expiration Gamma Squeeze: The Friday Catalyst With September 19 OPEX looming, NYSE:AI 's options chain is primed for fireworks. Open interest is heavy on out-of-the-money calls around $20-$25, mirroring last month's setup where we rode the $25 strikes through volatility.
As delta hedging ramps up, a modest 5-10% pop in the underlying could trigger gamma squeezes, forcing market makers to buy shares and amplifying the move.
If NYSE:AI clears $18.50 early this week (a key pivot on the daily chart), momentum could carry it to $22+ by Friday.

RKT Rocket Companies Options Ahead of EarningsIf you haven`t bought RKT before the previous earnings:
Now analyzing the options chain and the chart patterns of RKT Rocket Companies prior to the earnings report this week,
I would consider purchasing the 13usd strike price Calls with
an expiration date of 2026-1-16,
for a premium of approximately $1.37.
If these options prove to be profitable prior to the earnings release, I would sell at least half of them.

U Unity Is the Leader Powering the Mobile Gaming Boom in 2025If you haven`t bought the dip on U:
Now you need to know that U Unity Software stands as the dominant platform for mobile game development, fueling one of the fastest-growing segments in the global gaming industry. As mobile gaming continues its explosive expansion, Unity’s leadership in providing an accessible, powerful, and cross-platform game engine positions it for substantial growth and sustained market dominance in 2025 and beyond.
1. Unity Powers Over 70% of Mobile Games Worldwide
Unity is the engine behind more than 70% of all mobile games, a staggering market share that underscores its ubiquity and developer preference in the mobile gaming space.
This dominant position is supported by Unity’s user-friendly interface that appeals to a broad spectrum of developers—from indie studios to AAA game creators—enabling rapid prototyping and high-quality game production.
The company’s “build once, deploy anywhere” approach allows developers to launch games seamlessly across iOS, Android, consoles, and emerging platforms like AR/VR, saving time and development costs.
2. Mobile Gaming Market Growth Fuels Unity’s Expansion
The global mobile gaming market is projected to grow by $82.4 billion from 2025 to 2029, at a CAGR of 11.3%, driven by rising smartphone penetration, 5G connectivity, and increasing demand for multiplayer and free-to-play games.
Unity’s platform is uniquely positioned to capture this growth, as 90% of developers surveyed in 2025 reported launching their games on mobile devices.
The Asia-Pacific (APAC) region, accounting for over half of the mobile gaming market, represents a key growth area where Unity’s tools are widely adopted.
3. Cutting-Edge Technology and Innovation in Gaming Development
Unity’s continuous innovation, including the release of Unity 6 and Unity Vector, supports developers with advanced rendering, AI-driven content creation, and enhanced networking tools for smoother multiplayer experiences.
The platform’s integration of AI enables real-time, player-driven experiences such as dynamic content and adaptive storylines, which are becoming industry standards in 2025.
Unity’s cloud-based services and analytics empower developers to optimize monetization strategies, balancing user experience with in-app purchases and rewarded ads, which are booming in hybrid-casual games.
4. Thriving Developer Ecosystem and Support Network
Unity boasts a massive and active developer community, with over 8,000 companies worldwide adopting its platform for game development.
The Unity Asset Store and extensive tutorials reduce development time and costs, enabling faster time-to-market and innovation cycles.
This ecosystem fosters collaboration and accelerates problem-solving, making Unity the preferred choice for both startups and established studios.
5. Strong Financial Performance and Market Position
In Q1 2025, Unity reported revenue of $435 million with an adjusted EBITDA margin of 19%, reflecting operational discipline and strong demand for its platform.
Despite a GAAP net loss, Unity’s positive adjusted earnings per share ($0.24) and growing free cash flow demonstrate improving profitability metrics.
Unity’s leadership in mobile game development and expanding footprint in AR, VR, and metaverse projects provide multiple avenues for future revenue growth.
6. Cross-Platform and Metaverse Growth Opportunities
Unity’s “build once, deploy anywhere” philosophy extends beyond gaming into virtual concerts, interactive worlds, and digital marketplaces, positioning the company at the forefront of the metaverse evolution.
Enhanced networking and cloud gaming capabilities enable high-quality experiences across devices, including mobile phones and AR glasses, broadening Unity’s addressable market.

WULF TeraWulf Leader in Clean Crypto Mining & HPC InfrastructureIf you haven`t bought WULF before the rally:
Now TeraWulf WULF is emerging as a compelling growth story in the digital infrastructure and cryptocurrency mining sectors, distinguished by its commitment to zero-carbon energy and expanding high-performance computing (HPC) hosting capabilities. Despite near-term financial challenges, the company’s rapid capacity growth, strong cash position, and strategic initiatives position it well for substantial upside in 2025 and beyond.
1. Rapid Expansion of Mining Capacity and Hashrate Growth
TeraWulf energized Miner Building 5, increasing its total mining capacity to 245 MW and boosting its Bitcoin mining hashrate to 12.2 exahashes per second (EH/s), a 52.5% increase year-over-year.
This significant growth in self-mining capacity enhances revenue potential and operational scale, positioning TeraWulf among the more efficient and sizable clean-energy miners.
The company’s vertically integrated model, powered primarily by zero-carbon energy, aligns with increasing regulatory and investor demand for sustainable crypto mining.
2. Strategic Buildout of High-Performance Computing (HPC) Infrastructure
TeraWulf commenced the buildout of dedicated HPC data halls and remains on track to deliver 72.5 MW of gross HPC hosting infrastructure to Core42 in 2025.
The company is actively pursuing additional HPC customers, targeting 200–250 MW of operational HPC capacity by the end of 2026, which diversifies revenue streams beyond crypto mining.
HPC infrastructure is a high-growth segment driven by demand for AI, big data, and cloud computing, offering TeraWulf exposure to secular technology trends.
3. Strong Financial Position and Capital Allocation
As of March 31, 2025, TeraWulf held approximately $219.6 million in cash and bitcoin holdings, providing liquidity to fund expansion and weather market volatility.
The company has repurchased $33 million of common stock in 2025, signaling management’s confidence in the business and commitment to shareholder value.
While total outstanding debt is around $500 million, TeraWulf maintains a strong current ratio (~5.4), indicating solid short-term liquidity.
4. Industry-Leading Sustainability Profile
TeraWulf’s focus on zero-carbon energy for its mining operations differentiates it in an industry increasingly scrutinized for environmental impact.
This green positioning not only appeals to ESG-conscious investors but may also provide access to incentives, partnerships, and preferential contracts as governments and enterprises emphasize sustainability.
5. Revenue Growth Outlook and Market Opportunity
Despite a temporary revenue dip to $34.4 million in Q1 2025, the company is projected to deliver a 53% increase in revenue for the full year 2025, significantly outpacing industry averages.
The combination of expanding mining capacity and HPC hosting services positions TeraWulf to capitalize on the growing demand for digital infrastructure powered by clean energy.
6. Navigating Financial Challenges with Growth Focus
TeraWulf reported a GAAP net loss of $0.16 per share in Q1 2025, reflecting ongoing investments in capacity and infrastructure.
Operational cash flow remains positive and improving, with management focused on scaling efficiently and improving margins over time.

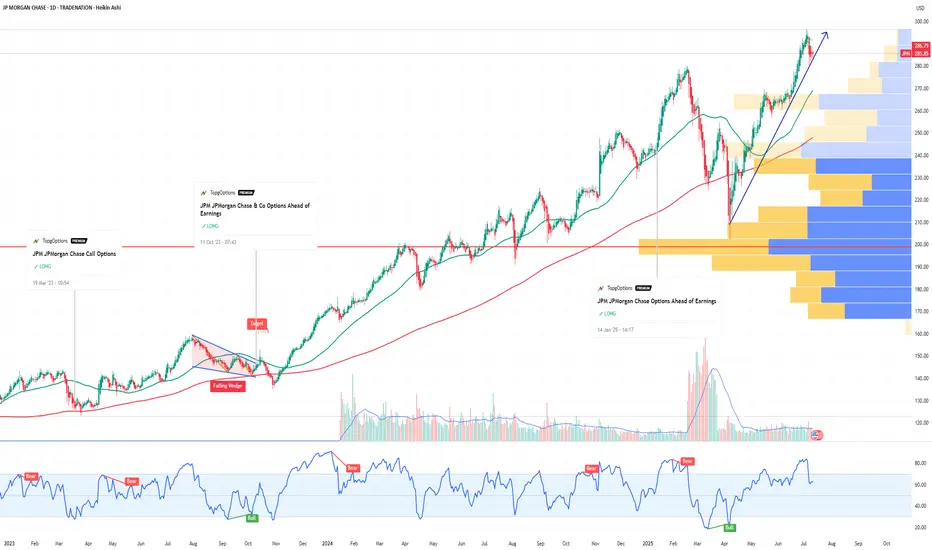
JPM JPMorgan Chase & Co Options Ahead of EarningsIf you haven`t bought JPM befor the rally:
Now analyzing the options chain and the chart patterns of JPM JPMorgan Chase & Co prior to the earnings report this week,
I would consider purchasing the 290usd strike price Calls with
an expiration date of 2026-1-16,
for a premium of approximately $20.20.
If these options prove to be profitable prior to the earnings release, I would sell at least half of them.
Disclosure: I am part of Trade Nation's Influencer program and receive a monthly fee for using their TradingView charts in my analysis.
UAL United Airlines Holdings Options Ahead of EarningsIf you haven`t exited UAL before the recent selloff:
Now analyzing the options chain and the chart patterns of UAL United Airlines Holdings prior to the earnings report this week,
I would consider purchasing the 92.5usd strike price Calls with
an expiration date of 2025-9-19,
for a premium of approximately $5.12.
If these options prove to be profitable prior to the earnings release, I would sell at least half of them.

TSLA Tesla Options Ahead of EarningsIf you haven`t bought TSLA before the recent rally:
Now analyzing the options chain and the chart patterns of TSLA Tesla prior to the earnings report this week,
I would consider purchasing the 350usd strike price Calls with
an expiration date of 2025-8-15,
for a premium of approximately $14.90.
If these options prove to be profitable prior to the earnings release, I would sell at least half of them.
Disclosure: I am part of Trade Nation's Influencer program and receive a monthly fee for using their TradingView charts in my analysis.

GOOGL Alphabet Options Ahead of EarningsIf you haven`t bought GOOGL before the rally:
Now analyzing the options chain and the chart patterns of GOOGL Alphabet prior to the earnings report this week,
I would consider purchasing the 215usd strike price Calls with
an expiration date of 2026-1-16,
for a premium of approximately $8.20.
If these options prove to be profitable prior to the earnings release, I would sell at least half of them.
Disclosure: I am part of Trade Nation's Influencer program and receive a monthly fee for using their TradingView charts in my analysis.

BABA Alibaba Options Ahead of EarningsIf you haven`t bought BABA before the rally:
Now analyzing the options chain and the chart patterns of BABA Alibaba Group Holding Limited prior to the earnings report this week,
I would consider purchasing the 135usd strike price Calls with
an expiration date of 2026-3-20,
for a premium of approximately $10.50.
If these options prove to be profitable prior to the earnings release, I would sell at least half of them.
Disclosure: I am part of Trade Nation's Influencer program and receive a monthly fee for using their TradingView charts in my analysis.

LULU Lululemon Athletica Options Ahead of EarningsIf you haven`t sold LULU before the previous earnings:
Now analyzing the options chain and the chart patterns of LULU Lululemon Athletica prior to the earnings report this week,
I would consider purchasing the 195usd strike price Puts with
an expiration date of 2025-10-17,
for a premium of approximately $14.05.
If these options prove to be profitable prior to the earnings release, I would sell at least half of them.
Disclosure: I am part of Trade Nation's Influencer program and receive a monthly fee for using their TradingView charts in my analysis.

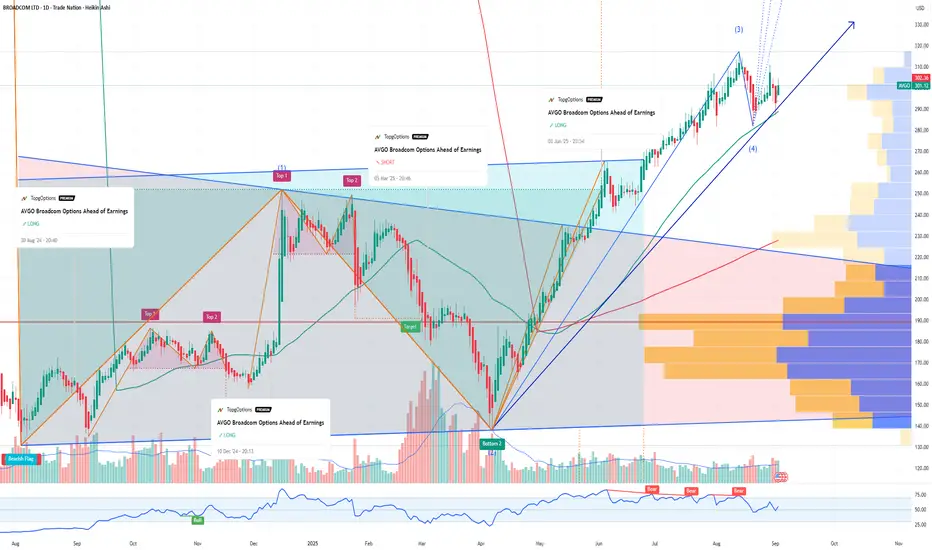
AVGO Broadcom Options Ahead of EarningsIf you haven`t bought AVGO before the rally:
Now analyzing the options chain and the chart patterns of AVGO Broadcom prior to the earnings report this week,
I would consider purchasing the 330usd strike price Calls with
an expiration date of 2025-10-17,
for a premium of approximately $8.35.
If these options prove to be profitable prior to the earnings release, I would sell at least half of them.
Disclosure: I am part of Trade Nation's Influencer program and receive a monthly fee for using their TradingView charts in my analysis.
BRIEFING Week #37 : Beware of the FOMCHere's your weekly update ! Brought to you each weekend with years of track-record history..
Don't forget to hit the like/follow button if you feel like this post deserves it ;)
That's the best way to support me and help pushing this content to other users.
Kindly,
Phil
