BRIEFING Week #34 : The Rotation may have BegunHere's your weekly update ! Brought to you each weekend with years of track-record history..
Don't forget to hit the like/follow button if you feel like this post deserves it ;)
That's the best way to support me and help pushing this content to other users.
Kindly,
Phil
Indicators

BRIEFING Week #33 : Status Quo... for nowHere's your weekly update ! Brought to you each weekend with years of track-record history..
Don't forget to hit the like/follow button if you feel like this post deserves it ;)
That's the best way to support me and help pushing this content to other users.
Kindly,
Phil

Gold Trading Strategy XAUUSD August 14, 2025Gold Trading Strategy XAUUSD August 14, 2025:
Gold prices continued to rise in the European session on August 13, 2025 as mild US inflation data raised expectations of a Federal Reserve rate cut in September, while a weaker US dollar also boosted demand for gold.
Fundamental news: The US labor market report earlier this month initially weighed on the greenback, but the latest US CPI data added pressure as it did not show a clear acceleration in inflation due to tariffs in July. The inflation data reinforced the possibility that the Fed will take a more dovish stance in September, which is what the market is expecting.
Technical analysis: After a deep correction to the 3330 area, gold prices showed signs of increasing again. On the H1 frame, an upward price channel has been formed, but the current MA lines are still moving sideways, not showing a clear trend. The 3350 - 3355 area will be the important area to decide whether this uptrend channel can hold or not. RSI on H1 and H4 timeframes has entered the buy zone, this is a very good condition for us to trade. We will trade at the support zones and large liquidity zones of gold prices.
Important price zones today: 3350 - 3355, 3335 - 3340.
Today's trading trend: BUY.
Recommended orders:
Plan 1: BUY XAUUSD zone 3350 - 3352
SL 3347
TP 3355 - 3365 - 3375 - 3390.
Plan 2: BUY XAUUSD zone 3335 - 3337
SL 3332
TP 3340 - 3350 - 3370 - 3390.
Plan 3: SELL XAUUSD zone 3388 - 3390
SL 3393
TP 3385 - 3375 - 3365 - 3355 (small volume).
Wish you a safe, successful and profitable trading day.🥰🥰🥰🥰🥰

NBIS Nebius Group Among My Top 10 Picks for 2025 | Price TargetNebius Group N.V. (NBIS) presents a compelling bullish case for a potential doubling of its stock price by the end of 2025, driven by several fundamental factors that highlight its growth trajectory within the rapidly expanding AI infrastructure market.
NVIDIA Corporation (NVDA) has made a significant investment in Nebius Group N.V. (NBIS), contributing to a $700 million funding round aimed at expanding Nebius's AI infrastructure capabilities. This investment aligns with NVIDIA's strategic focus on enhancing its presence in the rapidly growing AI market.
Explosive Revenue Growth:
Nebius Group has demonstrated remarkable revenue growth, with Q3 2024 revenues reaching $43.3 million, representing a 1.7-fold increase compared to the previous quarter and a staggering 766% year-over-year increase. This surge is primarily driven by the company's core AI infrastructure business, which grew 2.7 times quarter-over-quarter and 6.5 times year-over-year. Analysts expect this momentum to continue, projecting annual revenues of approximately $731.96 million for 2025, reflecting a robust demand for AI-centric services and solutions.
Strategic Investments in AI Infrastructure:
The company is heavily investing in expanding its GPU cluster capabilities and data center capacity, with plans to allocate over $1 billion towards these initiatives. This strategic focus on enhancing AI infrastructure positions Nebius to capture significant market share as the global demand for AI technologies continues to rise. The annualized run-rate for its cloud revenue has already surpassed $120 million, indicating strong customer adoption and a growing client base that includes Fortune 500 companies.
Strong Market Position and Competitive Advantage:
Nebius Group is uniquely positioned within the AI infrastructure landscape, specializing in full-stack solutions that cater to developers and enterprises looking to leverage AI technologies. As businesses increasingly prioritize AI integration into their operations, Nebius's comprehensive offerings make it an attractive partner for organizations seeking to enhance their technological capabilities. The company’s ability to provide scalable solutions will be crucial as the demand for AI services expands.
Healthy Financials and Cash Reserves:
As of September 30, 2024, Nebius reported cash and cash equivalents totaling approximately $2.29 billion, providing a solid financial foundation to support its growth initiatives without excessive reliance on debt. This strong liquidity position allows Nebius to invest aggressively in technology and infrastructure while maintaining operational flexibility 14. Additionally, with gross margins projected to remain robust at around 55% in 2025, the company is well-positioned to improve profitability as revenues grow.

BTC Bitcoin Among My Top 10 Picks for 2025 | Price TargetIf you haven`t bought BTC Bitcoin before the recent breakout:
My price target for BTC in 2025 is $125K, driven by the following fundamental factors:
Regulatory Developments Favoring Adoption:
The anticipated regulatory shifts in the United States are expected to create a more favorable environment for cryptocurrencies. With the potential for pro-crypto policies under a new administration, including the establishment of Bitcoin as a strategic reserve asset by major nations, investor confidence is likely to increase significantly. Analysts suggest that such developments could drive the total cryptocurrency market capitalization from approximately $3.3 trillion to around $8 trillion by 2025, with Bitcoin poised to capture a substantial share of this growth.
Increased Institutional Demand through ETFs:
The launch of Bitcoin exchange-traded funds (ETFs) has already begun to transform the investment landscape for Bitcoin, making it more accessible to institutional and retail investors alike. Following the successful introduction of multiple Bitcoin ETFs in 2024, analysts project that inflows could exceed $15 billion in 2025, further boosting demand for Bitcoin. This increased accessibility is expected to drive prices higher as more investors seek exposure to the asset class.
Supply Constraints from Halving Events:
Bitcoin's supply dynamics are fundamentally bullish due to its halving events, which occur approximately every four years and reduce the rate at which new Bitcoins are created. The most recent halving in April 2024 has led to a significant reduction in supply inflation, creating scarcity that historically correlates with price increases. As demand continues to rise while supply becomes more constrained, this fundamental imbalance is likely to support higher prices.
Growing Adoption as a Store of Value"
As macroeconomic conditions evolve, including persistent inflationary pressures and potential monetary policy easing, Bitcoin is increasingly viewed as a viable store of value akin to gold. This perception is bolstered by its finite supply and decentralized nature, making it an attractive hedge against inflation. Analysts suggest that as more investors turn to Bitcoin for wealth preservation, its price could see substantial appreciation

IBM International Business Machines Options Ahead of EarningsIf you haven`t bought IBM before the rally:
Now analyzing the options chain and the chart patterns of IBM International Business Machines prior to the earnings report this week,
I would consider purchasing the 290usd strike price Puts with
an expiration date of 2025-9-19,
for a premium of approximately $17.30.
If these options prove to be profitable prior to the earnings release, I would sell at least half of them.
Disclosure: I am part of Trade Nation's Influencer program and receive a monthly fee for using their TradingView charts in my analysis.

META Meta Platforms Options Ahead Of EarningsIf you haven`t bought META before the rally:
Now analyzing the options chain and the chart patterns of META Platforms prior to the earnings report this week,
I would consider purchasing the 710usd strike price in the money Calls with
an expiration date of 2026-6-18,
for a premium of approximately $89.30.
If these options prove to be profitable prior to the earnings release, I would sell at least half of them.
Disclosure: I am part of Trade Nation's Influencer program and receive a monthly fee for using their TradingView charts in my analysis.

BTC Elliott Wave medium term analysisCRYPTOCAP:BTC is still consolidating, as shown on the charts.
The structure is shaping up like a classic Elliott Wave 1–2–3–4–5 pattern, with the 4th wave now in play.
This could mean another retest of $110,500 before launching into the final, larger 5th wave 🚀.
The 4th wave might present a solid long entry opportunity heading into the 5th.
📊 DYOR – trade safe.

NVDA NVIDIA Price Target by Year-EndNVIDIA Corporation (NVDA) remains a dominant force in the AI and semiconductor markets, with its forward price-to-earnings (P/E) ratio currently at 19.37—a reasonable valuation considering its growth trajectory and market position.
NVIDIA’s leadership in the AI sector, particularly through its cutting-edge GPUs, has driven strong demand from data centers, cloud providers, and AI developers. The company’s recent product launches, including the Hopper and Blackwell architectures, have further solidified its competitive edge.
Despite recent market volatility, NVIDIA's consistent revenue growth and expanding profit margins support the bullish case. The current P/E of 19.37 reflects a balanced risk-reward profile, suggesting that the stock is not overvalued despite its impressive performance.
A price target of $145 by year-end reflects approximately 15% upside from current levels, driven by sustained AI demand and growing market penetration. Investors should watch for quarterly earnings reports and updates on AI chip demand, as these will likely act as key catalysts for upward momentum.

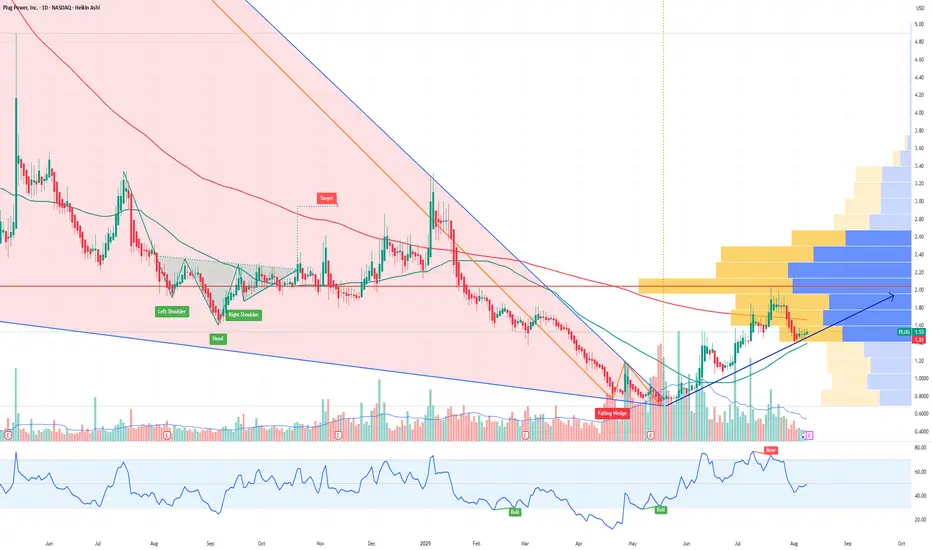
PLUG Plug Power Options Ahead of EarningsAnalyzing the options chain and the chart patterns of PLUG Plug Power prior to the earnings report this week,
I would consider purchasing the 6usd strike price in the money Calls with
an expiration date of 2027-1-15,
for a premium of approximately $0.0.49.
If these options prove to be profitable prior to the earnings release, I would sell at least half of them.
BBAI BigBear ai Holdings Options Ahead of EarningsIf you haven`t bought BBAI before the previous earnings:
Now analyzing the options chain and the chart patterns of BBAI BigBear ai Holdings prior to the earnings report this week,
I would consider purchasing the 7usd strike price Calls with
an expiration date of 2025-8-15,
for a premium of approximately $0.77.
If these options prove to be profitable prior to the earnings release, I would sell at least half of them.

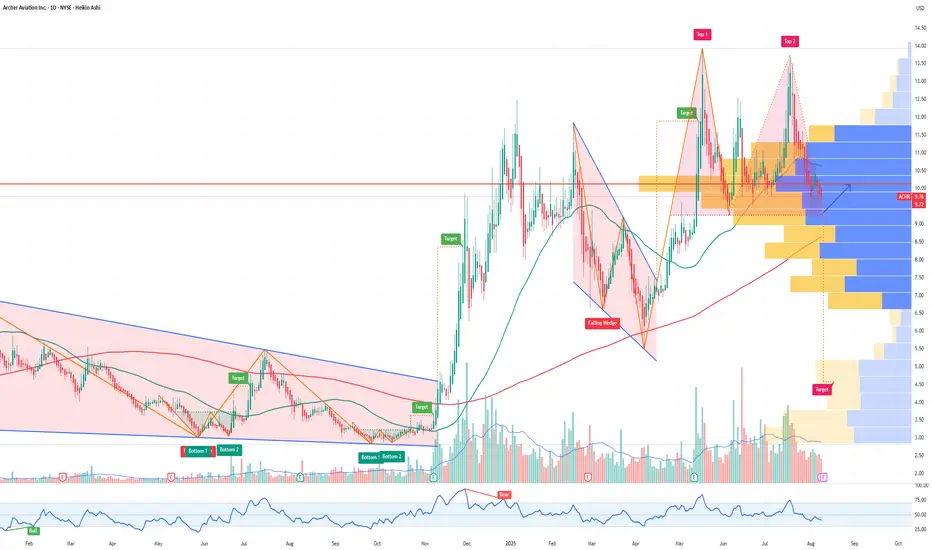
ACHR Archer Aviation Options Ahead of EarningsAnalyzing the options chain and the chart patterns of ACHR Archer Aviation prior to the earnings report this week,
I would consider purchasing the 10usd strike price Calls with
an expiration date of 2027-1-15,
for a premium of approximately $3.65.
If these options prove to be profitable prior to the earnings release, I would sell at least half of them.
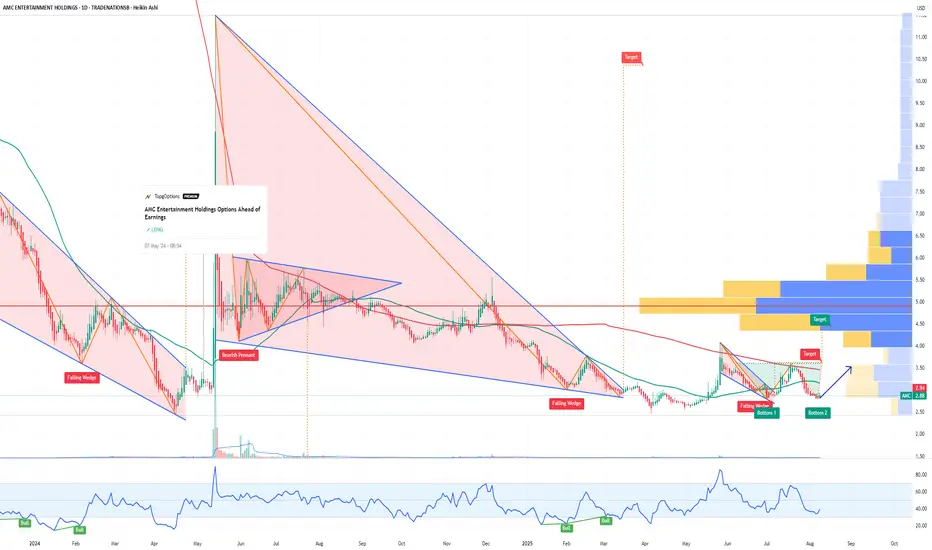
AMC Entertainment Holdings Options Ahead of EarningsIf you haven`t bought AMC before the last breakout:
Now analyzing the options chain and the chart patterns of AMC Entertainment Holdings prior to the earnings report this week,
I would consider purchasing the 2.50usd strike price Calls with
an expiration date of 2025-8-29,
for a premium of approximately $0.52.
If these options prove to be profitable prior to the earnings release, I would sell at least half of them.
Disclosure: I am part of Trade Nation's Influencer program and receive a monthly fee for using their TradingView charts in my analysis.
PINS Pinterest Options Ahead of EarningsIf you haven`t bought PINS before the previous earnings:
Now analyzing the options chain and the chart patterns of PINS Pinterest prior to the earnings report this week,
I would consider purchasing the 39usd strike price Calls with
an expiration date of 2025-8-8,
for a premium of approximately $2.22.
If these options prove to be profitable prior to the earnings release, I would sell at least half of them.

BRIEFING Week #31 : S&P ATH may have been a TrapHere's your weekly update ! Brought to you each weekend with years of track-record history..
Don't forget to hit the like/follow button if you feel like this post deserves it ;)
That's the best way to support me and help pushing this content to other users.
Kindly,
Phil

Xmoon Indicator Tutorial – Part 2 – Pivots🔻🔻🔻+ Persian translation below 🔻🔻🔻
🔹 What Is a Pivot?
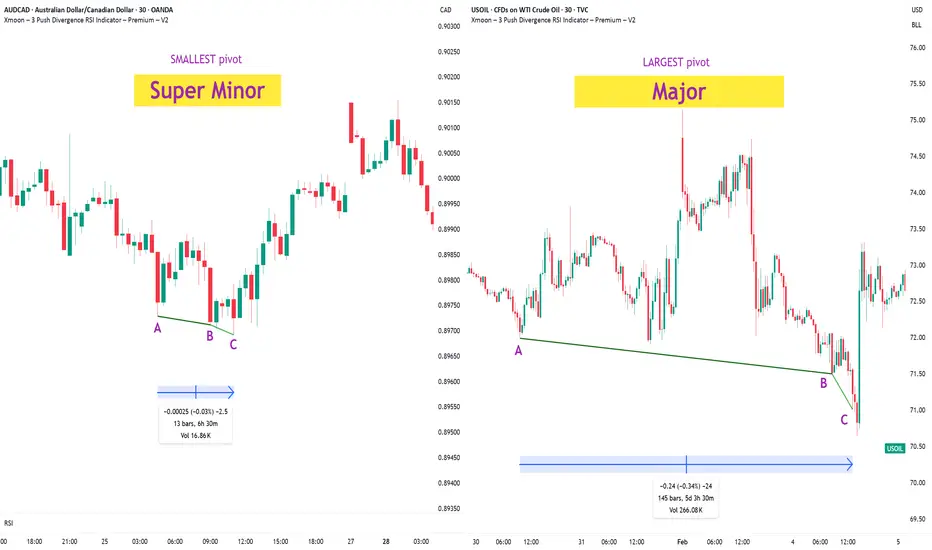
In the Xmoon strategy, every high or low that forms on the chart is considered a pivot.
The number of candles between two highs or two lows defines the size of the pivot.
The more candles there are between them, the larger and more reliable the pivot becomes.
🔸 Types of Pivots in the Xmoon Indicator Settings
In the settings panel, you can choose which types of pivots the patterns should be based on.
There are 4 pivot types :
• Super Minor → the smallest pivot
• Minor
• Mid Major
• Major → the largest pivot
⏫ As you move from Super Minor to Major, the strength of the pivot increases — but the number of signals decreases.
⚖️ Choosing the Right Pivot = Your Trading Style
• Want more signals? → Use smaller pivots like Minor or Super Minor
• Prefer higher accuracy and lower risk? → Use larger pivots like Major or Mid Major
💡 Pro Tip: On higher timeframes, pivots perform better and help reduce risk.
✍️ Summary
If you're looking for frequent signals, trade on lower timeframes, and can handle higher volatility and pressure, then smaller pivots like Super Minor and Minor are a better choice.
But if you prefer quality over quantity, work on higher timeframes, and value clarity, peace of mind, and higher success rates, then larger pivots like Mid Major and Major are the way to go.
📣 If you have any questions or need guidance, feel free to ask us. We’d be happy to help.
🔻🔻🔻 Persian Section – بخش فارسی 🔻🔻🔻
🔹 پیوت چیست؟
در استراتژی ایکسمون، هر قله یا درهای که روی چارت شکل میگیرد، یک پیوت محسوب می شود
فاصله زمانی بین دو قله یا دو دره (یعنی تعداد کندلهایی که بینشان قرار دارد) اندازهی پیوت را مشخص میکند
هرچه تعداد کندل بین دو سقف یا کف بیشتر باشد، آن پیوت بزرگتر و معتبرتر است
🔸 انواع پیوت در تنظیمات اندیکاتور ایکسمون
در بخش تنظیمات، میتوانید مشخص کنید که الگوها بر اساس چه نوع پیوتهایی شناسایی شوند
ما ۴ نوع پیوت داریم
• سوپر مینور ← کوچکترین پیوت
• مینور
• میدماژور
• ماژور ← بزرگترین پیوت
⏫ هرچه از سوپرمینور به سمت ماژور برویم، قدرت پیوت بیشتر میشود، ولی تعداد سیگنالها کمتر می شود
⚖️ انتخاب پیوت مناسب = سبک معاملاتی شما
• به دنبال سیگنال زیاد هستید ← پیوت کوچک تر = مینور و سوپرمینور
• به دنبال دقت بیشتر و ریسک کمتر هستید← پیوت بزرگتر = ماژور و میدماژور
💡 نکته حرفهای: در تایمفریمهای بالا، پیوتها عملکرد بهتری دارند و به کنترل ریسک کمک میکنند
✍️ جمعبندی
اگر دنبال سیگنالهای زیاد هستید، در تایمفریمهای کوچکتر کار میکنید و میتونید نوسانات و فشار روانی بالاتر رو تحمل کنید، پیوتهای کوچکتر مثل سوپرمینور و مینور انتخاب مناسبتری هستند
اما اگر در تایم فریم های بزرگتر کار می کنید و کیفیت سیگنال، آرامش ذهنی و احتمال موفقیت برایتان مهمتر است، پیوتهای بزرگتر مثل میدماژور و ماژور انتخاب بهتری هستند
📣 اگر سوالی دارید یا نیاز به راهنمایی دارید، خوشحال میشویم از ما بپرسید
با کمال میل در خدمتتان هستیم
Xmoon Indicator Tutorial – Part 1 – Strategy🔻🔻🔻+ Persian version below🔻🔻🔻
📘 Xmoon Indicator Tutorial – Part 1
🎯 3Push Divergence RSI Strategy
🔥 The core of the Xmoon indicator
is built upon one of the most powerful strategies in technical analysis:
The advanced 3Push Divergence RSI pattern
🔁 A pattern that typically appears at key market turning points.
📉 When the price moves in the same direction three consecutive times on pivot points (e.g., making lower lows or higher highs), but the RSI shows the opposite behavior, it indicates a clear divergence !
💡 This divergence can act as a strong signal for a potential trend reversal.
🎯 The Xmoon Indicator is designed to detect this critical moment.
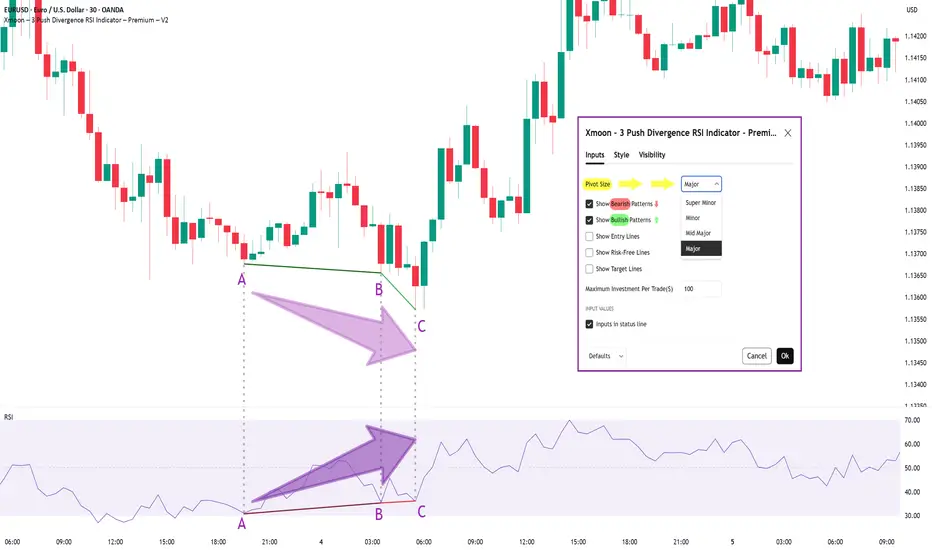
⚙️ Xmoon Indicator Settings Panel
The Xmoon settings panel offers the following options:
🔸 Pattern Type Selection: In the first and second lines, you can specify which type of pattern should be displayed: only bullish patterns or only bearish ones. You can also check both options.
🔸 Pivot Type Selection: From the dropdown menu, you can choose one of four pivot types:
“Super Minor”, “Minor”, “Mid-Major”, and “Major”, ordered from smallest to largest.
📌 Educational Note: The greater the distance (in candle count) between two lows or two highs, the larger the pivot is considered.
A Major Pivot is the largest among them.
✅ Larger Pivot = Higher Accuracy
❗ But naturally = Fewer Signals
📣 If you have any questions or need guidance, feel free to ask us. We’d be happy to help.
🔻🔻🔻بخش فارسی – Persian Section 🔻🔻🔻
📘 آموزش اندیکاتور ایکسمون - قسمت اول
🎯 استراتژی سهپوش واگرایی (3Push Divergence RSI)
🔥 هسته اصلی ایکسمون
بر پایه یکی از قویترین استراتژیهای تحلیل تکنیکال طراحی شده است
الگوی پیشرفته سهپوش واگرایی
🔁 الگویی که معمولاً در نقاط چرخش مهم بازار ظاهر میشود
📉 وقتی قیمت سه بار پشت سر هم روی نقاط پیوت ، در یک جهت حرکت میکند (مثلاً کفهای پایینتر یا سقفهای بالاتر میسازد) ، اما آر-اِس-آی خلاف آن را نشان میدهد، یعنی یک واگرایی آشکار رخ داده است
💡این واگرایی میتواند سیگنالی قوی برای برگشت روند باشد
🎯 اندیکاتور ایکسمون این لحظه را شناسایی میکند
⚙️ پنجره تنظیمات اندیکاتور ایکسمون
در بخش تنظیمات اندیکاتور ایکسمون، امکاناتی در اختیار شما قرار دارند
🔸 انتخاب نوع الگو: در خط اول و دوم میتوانید مشخص کنید چه نوع الگویی نمایش داده شود
فقط الگوهای صعودی یا فقط نزولی. همچنین می توانید تیک هر دو گزینه را بزنید
🔸 انتخاب نوع پیوتها: از پنجره کشویی بالا، می توانید یکی از ۴ نوع پیوت را انتخاب کنید
پیوت ها به ترتیب از کوچک به بزرگ عبارتند از: سوپر مینور ، مینور ، میدماژور و ماژور
📌 نکته آموزشی: هرچه فاصله بین دو کف یا دو سقف بیشتر باشد (یعنی تعداد کندلهای بین آنها زیادتر باشد)، آن پیوت، بزرگتر محسوب میشود
پیوت ماژور از بقیه بزرگ تر است
✅ پیوت بزرگتر = دقت بالاتر
❗ اما طبیعتاً = تعداد سیگنال کمتر
📣 اگر سوالی دارید یا نیاز به راهنمایی دارید، خوشحال میشویم از ما بپرسید
با کمال میل در خدمتتان هستیم
TMUS T-Mobile US Options Ahead of EarningsIf you haven`t bought TMUS before the rally:
Now analyzing the options chain and the chart patterns of TMUS T-Mobile US prior to the earnings report this week,
I would consider purchasing the 227.5usd strike price Puts with
an expiration date of 2025-7-25,
for a premium of approximately $3.50.
If these options prove to be profitable prior to the earnings release, I would sell at least half of them.
Disclosure: I am part of Trade Nation's Influencer program and receive a monthly fee for using their TradingView charts in my analysis.

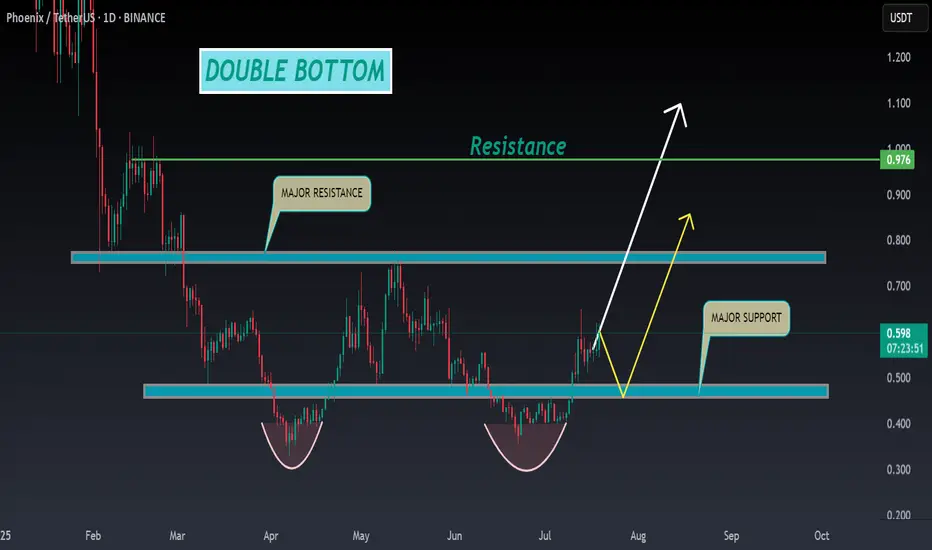
PHB ANALYSIS🔮#PHB Analysis :
📈📈 #PHB is making perfect Double Bottom Pattern. We can see a good pump if #PHB breakout the major resistance zone with good volume and sustains the higher price after breakout 🚀🚀
📊 Current Price: $0.595
⏳ Target Price: $0.780
⁉️ What to do?
- We can trade according to the chart and make some profits in #PHB. Keep your eyes on the chart, observe trading volume and stay accustom to market moves.💲💲
#PHB #Cryptocurrency #Pump #DYOR #Breakout
BRIEFING Week #29-30 : BTC stalling, ETH & then Alts ?Here's your weekly update ! Brought to you each weekend with years of track-record history..
Don't forget to hit the like/follow button if you feel like this post deserves it ;)
That's the best way to support me and help pushing this content to other users.
Kindly,
Phil

Arbitrage Opportunity!I believe I’ve identified an arbitrage opportunity involving the DEFI cryptocurrency: it trades at $0.003200 on Bybit, compared to only $0.002390 on MEXC.
I recall encountering a similar situation with Shiba Inu, when the price gap between Binance and Coinbase was as high as 8X. Feel free to play the chart below to see the outcome:
I also remember the 2016–2017 period, when such arbitrage opportunities existed even with Bitcoin, due to price discrepancies between Asian exchanges and those available to European traders.

SCHW The Charles Schwab Corporation Options Ahead of EarningsIf you haven`t sold SCHW before the sell-off:
Now analyzing the options chain and the chart patterns of SCHW The Charles Schwab Corporation prior to the earnings report this week,
I would consider purchasing the 92.5usd strike price Calls with
an expiration date of 2026-1-16,
for a premium of approximately $7.15.
If these options prove to be profitable prior to the earnings release, I would sell at least half of them.
Disclosure: I am part of Trade Nation's Influencer program and receive a monthly fee for using their TradingView charts in my analysis.

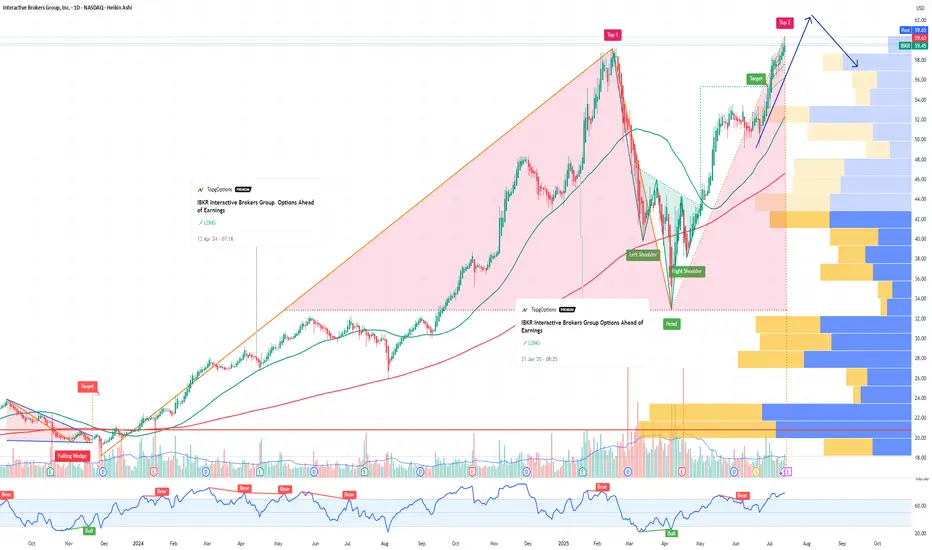
IBKR Interactive Brokers Group Options Ahead of EarningsIf you haven`t bought IBKR before the rally:
Now analyzing the options chain and the chart patterns of IBKR Interactive Brokers prior to the earnings report this week,
I would consider purchasing the 60usd strike price Calls with
an expiration date of 2025-9-19,
for a premium of approximately $3.90.
If these options prove to be profitable prior to the earnings release, I would sell at least half of them.