O Realty Income Corporation Options Ahead of EarningsAnalyzing the options chain and the chart patterns of O Realty Income Corporation prior to the earnings report this week,
I would consider purchasing the 50usd strike price Puts with
an expiration date of 2024-9-20,
for a premium of approximately $2.53.
If these options prove to be profitable prior to the earnings release, I would sell at least half of them.
Indicators

SUSHI after breaking above the short-term resistance can go upSUSHI after breaking above the short-term resistance can go up. Here is the potential entry zone with TPs and SL
🔵Entry Zone 1.224 - 1.280
🔴SL 1.1304
🟢TP1 1.3909
🟢TP2 1.4697
🟢TP3 1.6079
Risk Warning
Trading Forex, CFDs, Crypto, Futures, and Stocks involve a risk of loss. Please consider carefully if such trading is appropriate for you. Past performance is not indicative of future results.
If you liked our ideas, please support us with your likes 👍 and comments.

MINA has formed a Bullish FlagMINAMINA has formed a Bullish Flag. After the breakout we can expect the trend continuation.
🔵Entry Zone 1.3558 - 1.4278
🔴SL 1.2511
🟢TP1 1.4879
🟢TP2 1.5969
🟢TP3 1.7216
Risk Warning
Trading Forex, CFDs, Crypto, Futures, and Stocks involve a risk of loss. Please consider carefully if such trading is appropriate for you. Past performance is not indicative of future results.
If you liked our ideas, please support us with your likes 👍 and comments.

BOND after the breakout is continuing to go upBOND after the breakout is continuing to go up.
🔵Entry Zone 3.639 - 3.775
🔴SL 3.335
🟢TP1 4.128
🟢TP2 4.528
Risk Warning
Trading Forex, CFDs, Crypto, Futures, and Stocks involve a risk of loss. Please consider carefully if such trading is appropriate for you. Past performance is not indicative of future results.
If you liked our ideas, please support us with your likes 👍 and comments.
BLong

BNX is continuing to go up after the breakoutBNX is continuing to go up after the breakout. the trend is most likely to continue.
🔵Entry Zone 0.2874 - 0.2924
🔴SL 0.2756
🟢TP1 0.3074
🟢TP2 0.3500
Risk Warning
Trading Forex, CFDs, Crypto, Futures, and Stocks involve a risk of loss. Please consider carefully if such trading is appropriate for you. Past performance is not indicative of future results.
If you liked our ideas, please support us with your likes 👍 and comments.
BLong

XEM has broken above the Uptrend channelXEM has broken above the Uptrend channel. the trend is supposed to continue.
🔵Entry Zone 0.03724 - 0.03854
🔴SL 0.03495
🟢TP1 0.03991
🟢TP2 0.04250
🟢TP3 0.04735
Risk Warning
Trading Forex, CFDs, Crypto, Futures, and Stocks involve a risk of loss. Please consider carefully if such trading is appropriate for you. Past performance is not indicative of future results.
If you liked our ideas, please support us with your likes 👍 and comments.
XLong

TIA has formed a Bullish flagTIA has formed a Bullish flag, it can continue to go lower to 17.545 Before it moving up.
🔵Entry Zone 17.5451 - 18.4544
🔴SL 16.1969
🟢TP1 19.2169
🟢TP2 20.5598
🟢TP3 21.8846
Risk Warning
Trading Forex, CFDs, Crypto, Futures, and Stocks involve a risk of loss. Please consider carefully if such trading is appropriate for you. Past performance is not indicative of future results.
If you liked our ideas, please support us with your likes 👍 and comments.

MBLUSDT has formed a Bullish channelMBLUSDT has formed a Bullish channel. The trend has the potential go continue
MBLUSDT
🔵Entry Zone 0.004418 - 0.004298
🔴SL 0.004124
🟢TP1 0.004678
🟢TP2 0.005079
🟢TP3 0.005384
Risk Warning
Trading Forex, CFDs, Crypto, Futures, and Stocks involve a risk of loss. Please consider carefully if such trading is appropriate for you. Past performance is not indicative of future results.
If you liked our ideas, please support us with your likes 👍 and comments.

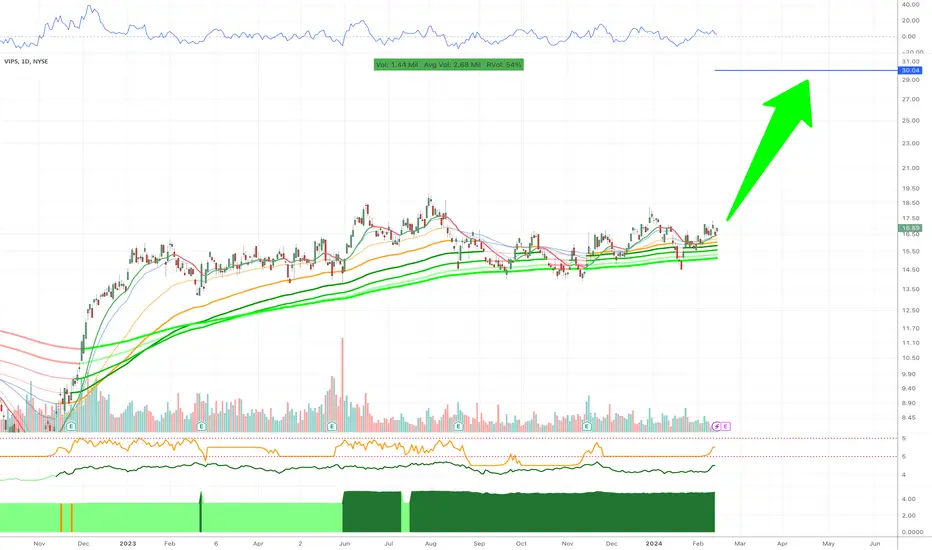
Vipshop Holdings LimitedVipshop Holdings Limited (NYSE:VIPS) has shown significant performance in the stock market with an impressive 11% increase over the past month. This growth prompts a deeper look into the company's key performance indicators, especially considering the high return on equity (ROE) of 23%, indicating the company's efficiency in generating profits from its shareholder investments. This high ROE, coupled with a net income growth of 21% over the past five years, surpasses the industry average and highlights Vipshop's strong market position and operational efficiency.
Despite facing challenges in the market, Vipshop has managed to exceed expectations with its latest quarterly earnings, reporting $3.33 earnings per share, a significant leap from the consensus estimate of $0.40. This performance reflects not only the company's ability to navigate market volatility but also its strategic focus on growth and profitability.
Vipshop's commitment to sustainable development is further demonstrated by its upgraded MSCI ESG Rating to AA, showcasing its capabilities in environmental, social, and governance aspects. Additionally, partnerships aimed at ecological conservation and the release of its Environmental, Social, and Governance (ESG) Report, set to achieve carbon neutrality in its operations by 2030, underscore Vipshop's dedication to sustainable business practices.
For investors, Vipshop's consistent financial performance, strategic growth initiatives, and commitment to sustainability make it a compelling option in the online retail sector. The company's focus on leveraging its strong market position, along with its effective use of retained earnings for business expansion, presents a solid case for investment consideration.
NOT TRADING ADVICE. ALWAYS DO YOUR OWN RESEARCH.
NGD: New Horizons for New Gold Inc in the Gold Mining SectorNew Gold Inc. (ARCA:NGD) , a company engaged in gold mining, offers investors a unique opportunity to invest in the precious metals sector. With the latest earnings report showing C$0.04 per share for the quarter and total revenues of C$270.07 million, the company demonstrates stability in its operations, despite a negative net margin of 7.20% and a negative return on equity of 5.66%.
With a current market capitalization of C$1.15 billion and a price range over the last year from C$1.13 to C$2.12, NGD shares are of interest to both short-term and long-term investors exploring opportunities in the gold mining sector. The company continues to explore and develop its main assets in Canada and Mexico, highlighting the potential for future growth and expansion.
Significant insider activity, including the sale of a substantial number of shares by management, may indicate an internal view of the current stock value. Such sales, including transactions worth more than C$830,000 in the last quarter, underline the importance for investors to closely analyze insider movements and their potential impact on market value.
The future outlook for NGD is full of both opportunities and challenges. When evaluating the investment potential of the company, factors such as fluctuations in gold prices, changes in the regulatory environment, and the company's ability to efficiently manage its operational expenses and debt obligations should be considered.
For investors interested in the gold mining sector, New Gold Inc. offers the opportunity to invest in a company with a stable portfolio of operations and potential for growth in a climate of increased demand for precious metals. However, as with any investment, it is important to conduct thorough analysis and risk assessment.
NOT TRADING ADVICE. ALWAYS DO YOUR OWN RESEARCH.

Bitcoin - THIS INDICATOR calls the TOP📉Hi Traders, Investors and Speculators of Charts📈
It's always good to refer back to the MACRO trend when watching BTC. From a macro perspective; we're definitely overdue for that proper bull-cycle correction - also important to keep in mind the halving coming up in April.
We can confirm this bias by taking a look at a very specific indicator called the Balance of Power. Historically, on a macro timeframe, this indicator has been great at calling local tops and bottoms.
If you found this content helpful, please remember to hit like and subscribe and never miss a moment in the markets.
_______________________
📢Follow us here on TradingView for daily updates📢
👍Hit like & Follow 👍
CryptoCheck
BINANCE:BTCUSDT

MoneyLion IncMoneyLion Inc. (NASDAQ:ML ) is a prominent player in the financial technology sector, powering a range of personalized products and services designed to enhance the financial well-being of its customers. The company has been actively involved in several initiatives aimed at accelerating digital transformation within the banking sector and extending financial services to a broader audience. A recent alliance with EY underscores MoneyLion's commitment to driving innovation and growth within the banking industry, highlighting its role in facilitating banks' digital transformation efforts.
MoneyLion's participation in Needham's 26th Annual Growth Conference and its consistent efforts in community engagement, such as partnering with Bubba Wallace, Tyler Reddick, and 23XI Racing for charitable initiatives, reflect its active involvement in both industry discussions and social responsibility. These activities not only strengthen MoneyLion's market presence but also emphasize its dedication to leveraging technology for financial inclusion and community support.
The company's achievement in being awarded "Best Financial Literacy Tool" at Benzinga's 2023 Global Fintech Awards further validates its effectiveness in providing valuable financial education and tools to its users. This recognition is a testament to MoneyLion's innovative approach to financial technology, focusing on personalization and user empowerment.
For investors and stakeholders, MoneyLion's recent activities and recognitions might indicate a strong potential for growth and innovation in the fintech space. With a current stock price showing positive momentum and a performance outlook that suggests optimism in the short to long term, MoneyLion appears to be a noteworthy consideration for those interested in the fintech industry.
NOT TRADING ADVICE. ALWAYS DO YOUR OWN RESEARCH.
MLong

BVS: Bioventus – Innovations and Growth in Medical TechnologiesBioventus Inc. (Nasdaq:BVS) , a company specializing in medical devices and active treatments, has demonstrated significant achievements despite challenges. Recent research and company decisions indicate potential for further growth and innovations in the healthcare sector.
The company recently reported financial results for the third quarter of 2023, confirming its ability to manage costs and increase efficiency. Improved performance in pain treatment and ongoing cost management contributed to an upgraded financial forecast for the full fiscal year. Despite a decrease in net sales, the company's results exceeded expectations, allowing it to raise the financial forecast for the entire year.
Bioventus is also actively working on reducing debt and optimizing its cost structure. Recent appointments to senior management, including new President and CEO Robert Klai, with more than two decades of experience in medical devices, underline the company's commitment to improving operational efficiency and revenue growth.
Furthermore, Bioventus secured a nationwide contract with Aetna™ Medicare Advantage plans for DUROLANE®, used in knee osteoarthritis treatment, reflecting recognition of their products' effectiveness and market expansion.
For investors looking for opportunities in the healthcare sector, BVS shares offer a unique balance of innovation, growth, and strategic focus on financial performance improvement. With a strong management team, strategic partnerships, and growth potential in medical technologies, Bioventus represents an attractive investment opportunity.
NOT TRADING ADVICE. ALWAYS DO YOUR OWN RESEARCH.

Strengthening Hooker Furnishings' Position in the Furniture Hooker Furnishings Corporation (NASDAQ:HOFT) , a leading furniture manufacturer, demonstrated significant achievements in the third quarter of the 2024 fiscal year, highlighting the company's resilience and strategic vision. With earnings of $0.65 per share exceeding analysts' expectations and total revenue of $116.83 million, HOFT confirms its ability to overcome market challenges and strengthen its position in the furniture market.
The company announced quarterly dividends of $0.23 per share, an increase compared to the previous quarter, and demonstrated its commitment to returning value to shareholders. This, along with the announcement of a $150 million share repurchase program, underscores the financial stability and management's optimism for future growth.
Key success factors for HOFT include strategic inventory management, cost reduction, and market visibility expansion through new showrooms and active engagement of new customers. With a $32 million reduction in inventory levels compared to the end of the previous year and an increase in cash to $40 million, the company shows a healthy financial position and readiness for further growth.
Despite challenging conditions in the furniture industry, HOFT continues to take measures to strengthen its market position by optimizing operational efficiency and focusing on strategic growth initiatives. The company expects its next earnings report on April 12, 2024, which will provide additional information about its financial health and future plans.
For investors interested in the consumer goods sector and looking for a company with sustainable income and growth potential, Hooker Furnishings offers an attractive investment opportunity. With a focus on quality, innovation, and meeting customer needs, HOFT is poised to overcome current and future market challenges.
NOT TRADING ADVICE. ALWAYS DO YOUR OWN RESEARCH.

SLVM: Sustainable Growth and Renewable Investments Sylvamo Corporation (NYSE:SLVM) , a leading global paper manufacturer, demonstrates strong financial results and an active strategy for returning capital to shareholders. In the third quarter of 2023, the company reported net income from continuing operations of $58 million or $1.37 per diluted share, significantly above the previous quarter ($49 million or $1.14 per diluted share). These results highlight the efficiency of management and Sylvamo's strategic direction towards increasing free cash flow and optimizing operational activities.
The company has also initiated the "Project Horizon" cost reduction program, aimed at achieving expense savings of at least $110 million by the end of 2024. This includes optimizing operations and reducing the global workforce by approximately 150 positions. For the fourth quarter, Sylvamo forecasts adjusted EBITDA in the range of $90 million to $110 million, reflecting expected volume improvements despite anticipated increases in operational and other expenses.
In addition, Sylvamo announced the payment of quarterly dividends of $0.30 per share and special dividends, as well as a $150 million share repurchase program. These measures underscore the company's commitment to returning value to shareholders and confidence in its financial stability and growth.
Sylvamo, with a focus on producing paper from renewable resources and operations in Europe, Latin America, and North America, strengthens its position as the preferred choice for investors interested in sustainable development and innovations in the paper industry. Considering strong financial indicators, strategic cost-cutting initiatives, and an active policy regarding shareholders, Sylvamo represents an attractive investment opportunity.
NOT TRADING ADVICE. ALWAYS DO YOUR OWN RESEARCH.

XEMPopped on my breakout finder
📈 *Symbol*: `XEM/USDT`
✅ *Qualification*: All MAs within 1% of MA7.
💰 *Market Cap*: `$314,594,092.89`
I'm noticing on the day the adx crossed below a level it never has and when it did the MACD signaled a Buy
With ADX When it's going upward that means trend following indicators work best
when its going down we use things like oscilators
MACD being an ocsilator pinged a buy and we're starting to uptrend. We also had a nice bounce of the .318 fib along with another breakout and swing low back tot the .5 fib showing a health upward trend as you see how volatility has completely dropped thats what the breakout/breakdown finder looks for tokens like that
