BTC Bitcoin & Crypto Selloff Alert: Is a Second Wave Imminent?If you haven`t bought BTC before the rally:
The cryptocurrency market is still reeling from the brutal sell-off on Friday, October 10, 2025, triggered by U.S. President Donald Trump's announcement of 100% tariffs on Chinese imports. Bitcoin plummeted below $105,000, Ethereum dropped over 16% to under $3,700, and the broader market saw liquidations exceeding $19 billion—the largest single-day wipeout in crypto history, nine times bigger than February 2025's crash.
While Monday and Tuesday brought some recovery, with Bitcoin climbing back above $115,000 and the total market cap topping $4 trillion, underlying issues like inflated trading volumes, massive altcoin losses, and a prominent whale re-entering a short position suggest this might just be a dead-cat bounce. This article explores why a second leg down could be imminent, incorporating technical analysis for TradingView users eyeing volatility plays.
The Friday Flash Crash: A Perfect Storm Amplified by Fake Volumes
The October 10 crash unfolded rapidly, with Bitcoin shedding nearly 10% in hours and over $200 billion erased from the market cap. But what made the drop so severe, especially for altcoins?
A key culprit: fake trading volumes driven by wash trading. Wash trading, where traders buy and sell the same asset to themselves to inflate volumes, creates the illusion of liquidity and interest without real economic activity. Estimates suggest that up to 87-88% of crypto volumes are fake, often used in pump-and-dump schemes or to lure retail investors.
In thin markets like crypto, these artificial volumes mask true liquidity. When real selling pressure hit—amplified by leveraged positions and the tariff news—exchanges like Binance saw cascading liquidations due to flawed margin systems. This "flash crash" wiped out $600–900 million in longs alone, but the fake volumes meant the market couldn't absorb the shock, leading to exaggerated drops.
Analysts note that such illusions persist in 2025, with AI tools now exposing them, but regulators lag behind. If volumes remain overstated, any renewed catalyst could trigger another liquidity vacuum, setting up a second leg down.
Altcoin Bloodbath: 50–90% Drops Expose Vulnerabilities
While Bitcoin and Ethereum recovered somewhat, altcoins bore the brunt of the carnage. An index tracking altcoins (excluding BTC, ETH, and stablecoins) cratered about 33% in just 25 minutes, with some tokens plunging 50–90%. Tokens like Solana, XRP, and Dogecoin lost 20–60%, but lesser-known altcoins saw even steeper declines, highlighting the sector's over-leveraged and illiquid nature.
This disproportionate pain stems from altcoins' reliance on hype and speculative inflows, often propped up by those same fake volumes. In a risk-off environment, capital flees to safer assets like Bitcoin, whose dominance spiked during the crash.
Altseason indicators are now cooling (76–78 previously).
Bitcoin dominance dropped below 59% post-crash.
If earnings season in traditional markets reveals economic weakness, spilling over to crypto, altcoins could lead the next sell-off wave, potentially dropping another 20–50% if support levels break.
The Whale Factor: $192M Profit, Then Re-Entry Signals Bearish Conviction
Adding fuel to the fire is a mysterious crypto whale who timed the crash impeccably. Just 30 minutes before Trump's tariff announcement, this entity opened a massive short position on Bitcoin, pocketing $192 million in profits as the market tanked.
Speculation abounds: Was it insider knowledge, or just savvy trading? Either way, the whale didn't stop there—they've re-entered with another short, increasing their position to $340 million, and even opened a fresh $163 million bearish bet.
Other whales have followed suit, including:
A Satoshi-era entity shorting $1.1 billion before the news
An OG whale opening a $392 million short
These moves suggest high conviction in further declines, possibly tied to ongoing trade tensions or macroeconomic risks. In a market where whales can move prices, this re-entry could catalyze the second leg, especially if it triggers more liquidations.
My price target for Bitcoin is $95K
Indicators

Gold price developments today, November 141. Trendline
Descending trendline (upper red): Price is repeatedly rejected here → a strong dynamic resistance.
Ascending trendline (lower red): Price has bounced multiple times → an important dynamic support, forming a confluence with the 0.618 Fibonacci level.
2. Resistance
4,215 – 4,225:
Supply zone + confluence with the descending trendline → a high-probability selling area.
If price breaks strongly above 4,225, the next expansion target is 4,244.
3. Support
4,172 – 4,155 (Fibo 0.5 – 0.618):
Nearest support, likely to see a reaction.
4,127 – 4,130:
The strongest support zone, aligned with the ascending trendline → a potential buying area.
4. Price Scenarios
Scenario 1 (primary):
Price retraces to retest 4,215–4,225, gets rejected → declines toward 4,155 or deeper to 4,127.
Scenario 2:
If the descending trendline breaks, price could rally strongly toward 4,244.
BUY GOLD : 4127 - 4130
Stoploss : 4113
Take Profit : 100-300-500pips
SELL GOLD : 4221-4224
Stoploss : 4233
Take Profit : 100-300-500pips

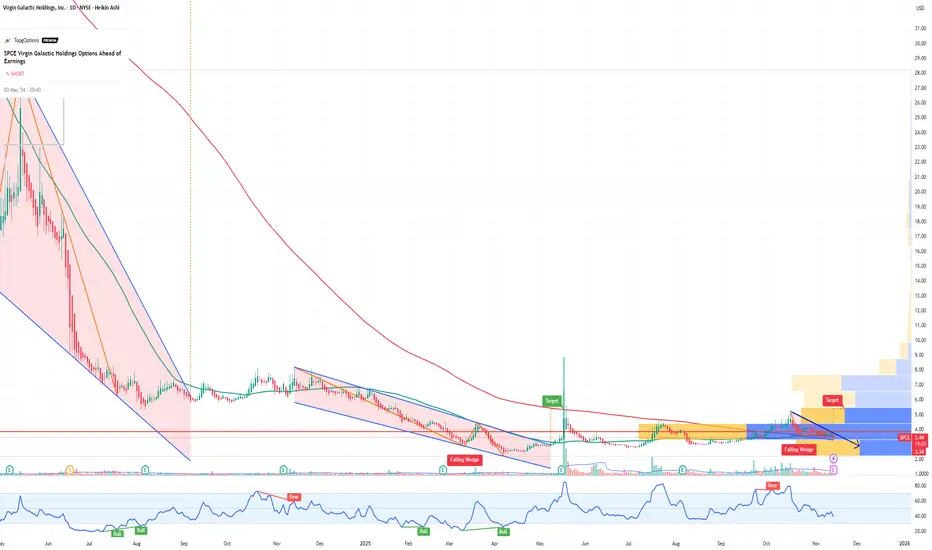
SPCE Virgin Galactic Holdings Options Ahead of EarningsIf you haven`t sold SPCE before the share dilution:
Now analyzing the options chain and the chart patterns of SPCE Virgin Galactic Holdings prior to the earnings report this week,
I would consider purchasing the 3.50usd strike price Puts with
an expiration date of 2025-11-14,
for a premium of approximately $0.37.
If these options prove to be profitable prior to the earnings release, I would sell at least half of them.
BREAKING NEWS - GOLD SURGES ABOVE $4,200!🔥 XAUUSD DAILY MARKET ANALYSIS
Wednesday, November 13, 2025
💰 BREAKING NEWS - GOLD SURGES ABOVE $4,200! 🚀
Current Price: $4,187 - $4,210 ⬆️⬆️⬆️
Daily Change: +2% (UP 80+ PIPS!) 📈
Opening Price: $4,127
Today's Range: $4,098 - $4,210
Status: 🟢 STRONG BULLISH MOMENTUM
🎯 WHAT HAPPENED TODAY?
EXPLOSIVE RALLY! Gold has BLASTED through the $4,200 barrier for the first time in THREE WEEKS! This is a massive breakout after consolidating below $4,160 resistance for days.
Why Gold is Surging:
🇺🇸 US Government Shutdown Ending - Senate passed deal, House voting today (7 PM ET)
💵 Dollar Weakness - USD giving back gains, DXY falling to 99.60
📉 Treasury Yields Dropping - 10-year yield falling, boosting gold appeal
💼 Fed Rate Cut Bets SURGING - Now 68% probability for December cut (up from 62%)
📊 Weak Jobs Data - 11,000+ jobs cut weekly through October
🔥 NO CPI DATA TODAY - Government shutdown delayed critical data, creating uncertainty = GOLD UP!
📊 TECHNICAL ANALYSIS
Market Structure: BULLISH BREAKOUT 🟢🟢🟢
✅ Gold broke above $4,160 resistance with STRONG volume
✅ Price now testing $4,210 - new 3-week high
✅ Bullish trend confirmed - 5 consecutive green days!
✅ All moving averages pointing UP
Key Support Levels (BUY ZONES)
🔵 Support 1: $4,157 - $4,160 (Former resistance, now support - STRONG)
🔵 Support 2: $4,120 - $4,127 (Today's open - Critical)
🔵 Support 3: $4,098 - $4,100 (Today's low - Major)
🔵 Support 4: $4,048 - $4,039 (Breakout base)
Key Resistance Levels (TAKE PROFIT ZONES)
🔴 Resistance 1: $4,210 - $4,220 (Current test)
🔴 Resistance 2: $4,243 - $4,254 (Next target)
🔴 Resistance 3: $4,307 (October channel high)
🔴 Resistance 4: $4,374 - $4,381 (All-time high)
📈 TECHNICAL INDICATORS
RSI (14): 67 (Bullish momentum, not overbought yet) ✅
MACD: Strong bullish crossover - BUY signal confirmed ✅
Moving Averages:
Price ABOVE all major EMAs ✅
EMA 20/50/200 all pointing UP ✅
Golden Cross pattern forming ✅
Volume: INCREASING on breakout - Strong conviction ✅
🎯 TRADING STRATEGIES FOR TODAY
SCENARIO 1: CONTINUATION PLAY 🚀 (70% Probability)
IF Gold Holds Above $4,160:
LONG Entry Options:
Aggressive: BUY NOW at $4,187-$4,200
TP1: $4,243 📍 (+56 pips)
TP2: $4,280 📍 (+93 pips)
TP3: $4,307 📍 (+120 pips)
SL: $4,155 (Below breakout level)
Conservative: WAIT for pullback to $4,160-$4,170
TP1: $4,210 📍
TP2: $4,254 📍
TP3: $4,307 📍
SL: $4,140
Risk/Reward: 1:3 ratio minimum ✅
SCENARIO 2: FAKE BREAKOUT 📉 (30% Probability)
IF Gold Breaks Below $4,160:
SHORT Setup:
Entry: Break below $4,157 with volume
Targets:
TP1: $4,127 📍
TP2: $4,098 📍
TP3: $4,048 📍
Stop Loss: $4,175
⚠️ NOTE: This is AGAINST the trend, so smaller position size recommended!
🌍 FUNDAMENTAL CATALYSTS TODAY
BULLISH FACTORS ⬆️⬆️⬆️
✅ US Shutdown Resolution - Creates positive sentiment but maintains uncertainty
✅ Fed Dovish Pivot - 68% chance December rate cut (was 62% yesterday)
✅ Weak Employment Data - 11,000+ weekly job losses supporting rate cuts
✅ Dollar Weakness - DXY down 0.14% to 99.60
✅ Lower Bond Yields - Making non-yielding gold more attractive
✅ No CPI Data - Delayed economic data = uncertainty = GOLD RALLY
✅ Central Bank Buying - Continuous institutional demand
✅ Consumer Sentiment LOW - Lowest since June 2022 (50.3)
BEARISH RISKS ⬇️
⚠️ Overbought Technically - RSI approaching 70
⚠️ Profit Taking Risk - After +2% move in one day
⚠️ Resistance at $4,210 - Previous highs may cap gains
⚠️ US-China Tensions Easing - Reducing safe-haven premium
🔥 MARKET SENTIMENT: EXTREMELY BULLISH
Analyst Targets for End 2025:
Conservative: $4,300
Base Case: $4,400-$4,500
Bullish: $4,700-$5,000 (UBS/Goldman Sachs)
This Week's Targets:
Short term: $4,243-$4,254
Medium term: $4,307
Aggressive: Retest $4,381 all-time high
💡 TODAY'S GAME PLAN
For ACTIVE Traders:
🎯 BUY THE BREAKOUT - If you're aggressive, enter around $4,190-$4,200 with tight stop at $4,155. Target $4,243 first, then $4,280.
For CONSERVATIVE Traders:
⏰ WAIT FOR PULLBACK - Let price retrace to $4,160-$4,170, then enter LONG. This is safer with better risk/reward.
For SCALPERS:
⚡ Trade the Range - If price consolidates between $4,180-$4,210, scalp between these levels with tight stops (15-20 pip targets).
📅 KEY EVENTS TO WATCH
TODAY:
⏰ 7:00 PM ET - US House vote on shutdown (CRITICAL!)
Expect volatility around this news
THIS WEEK:
Fed speakers (watch for rate cut signals)
US economic data releases (delayed but coming)
Government shutdown resolution impact
📊 PROFESSIONAL ANALYSIS
Current Market Phase: BREAKOUT & EXPANSION 🚀
Gold has successfully broken out of the $4,080-$4,160 consolidation range that held for a week. The move is supported by:
Strong fundamental backdrop
Technical confirmation
Institutional buying
Retail FOMO (fear of missing out)
Key Level: $4,160 is now the LINE IN THE SAND. As long as gold holds above this level, the trend is UP. A close below $4,160 would signal caution.
🎬 BOTTOM LINE (TL;DR)
BIAS: 🟢 STRONGLY BULLISH
ACTION: BUY DIPS (Don't chase at $4,210!)
BEST ENTRY: $4,160-$4,170 on pullback
TARGET: $4,243 → $4,307 → $4,374
STOP LOSS: Below $4,155
RISK LEVEL: MEDIUM (High volatility expected)
🔔 TRADING TIPS
✅ Don't Chase - Wait for pullbacks to $4,160-$4,170
✅ Use Stop Loss - ALWAYS protect your capital
✅ Take Partial Profits - Lock in gains at each target level
✅ Manage Risk - Never risk more than 2% per trade
✅ Watch $4,160 - This is your key support now
⚠️ RISK MANAGEMENT RULES
Position Size: Max 2% of account per trade
Stop Loss: MANDATORY (Never trade without it)
Take Profit: Lock in 50% at TP1, let rest run
Trailing Stop: Once in 50+ pips profit, trail stop
🎯 SWING TRADER SETUP
Entry: $4,160-$4,170 (Wait for pullback)
Target 1: $4,254 (Hold 3-5 days)
Target 2: $4,307 (Hold 1 week)
Target 3: $4,381 (Hold 2-3 weeks)
Stop Loss: $4,120 (Wider for swing trade)
🏆 CONCLUSION
Today is a MAJOR breakout day for gold! The technical and fundamental stars are aligned for continued upside. However, be PATIENT - don't chase the price at $4,210. Wait for a healthy pullback to $4,160-$4,170 for optimal entry.
The trend is YOUR FRIEND - and right now, that trend is pointing UP! 📈🚀
⚠️ DISCLAIMER
This analysis is for educational purposes only. Trading involves significant risk. Always use proper risk management and never risk money you cannot afford to lose. Past performance does not guarantee future results.
📱 Follow for daily updates at 8:00 AM
💬 Share your trades in comments
🔔 Hit the bell for real-time alerts
👍 Like if this helped you!
#Gold #XAUUSD #ForexTrading #TechnicalAnalysis #TradingView #GoldBreakout #ForexSignals #DayTrading #SwingTrading #MarketAnalysis #TradingStrategy

What will gold do in the US trading session?📈 Market Structure
Price Action:
Price has just broken out of the accumulation zone, moving sharply toward the main resistance area.
📊 Trendlines
Lower Trendline (Red): Long-term dynamic support — price has bounced multiple times from this level.
Upper Trendline (Red): Main descending resistance — price is now approaching this zone.
🧱 Support Zones
3,970,000: Confluence of horizontal support and the lower trendline → key reaction area to monitor.
4,030 – 4,050 (Breakout Zone): Intermediate support if price pulls back after the breakout rally.
⚔️ Resistance Zones
4,100 – 4,115: Strong resistance aligning with the upper trendline and previous highs → possible correction zone.
🎯 Scenario
If price gets rejected around 4,115, it could pull back toward the 4,030 – 4,050 breakout zone, or even retest 3,970,000.
A clean breakout above 4,115 would confirm stronger bullish continuation.
🧭 Summary
Trend: Short-term bullish — currently testing major resistance.
Strategy: Watch price action near 4,115; wait for confirmation to re-enter buys around 4,030 – 3,970.
💼 Trading Plan
BUY GOLD: 4,030 – 4,028
Stop Loss: 4,018
Take Profit: 100 – 300 – 500 pips
SELL GOLD: 4,115 – 4,117
Stop Loss: 4,127
Take Profit: 100 – 300 – 500 pips

BRIEFING Week #45 : Growth made the TopHere's your weekly update ! Brought to you each weekend with years of track-record history..
Don't forget to hit the like/follow button if you feel like this post deserves it ;)
That's the best way to support me and help pushing this content to other users.
Kindly,
Phil

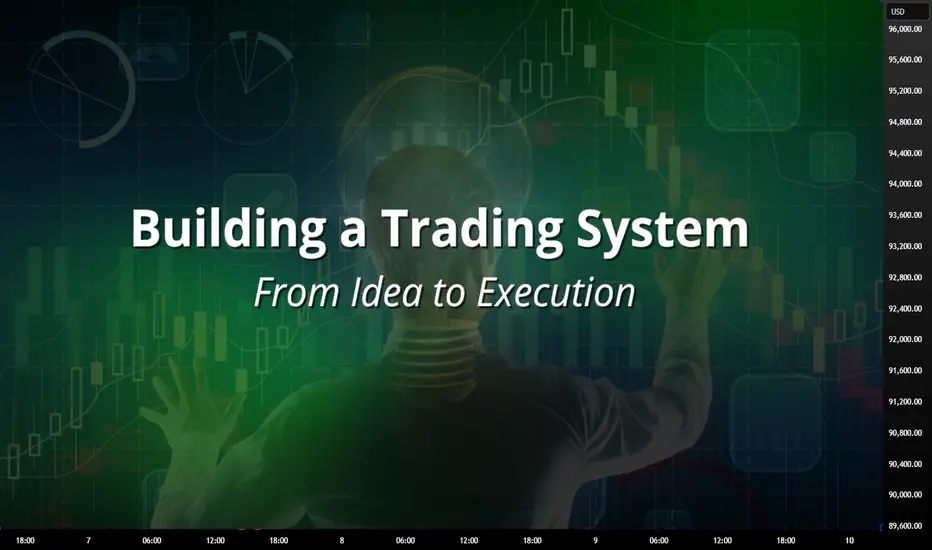
Building a Trading System: From Idea to ExecutionEvery trader starts with an idea — a setup, a pattern, a theory that seems to work.
But until that idea becomes a structured system, it’s just intuition.
A trading system gives your ideas rules, logic, and repeatability.
That’s the difference between a trader who hopes, and a trader who executes.
Define the Core Idea
Every system begins with an observation.
Maybe you notice breakouts after volume spikes, or reversals after RSI divergence.
Whatever the logic, write it down.
A system has to be specific, if you can’t define it clearly, you can’t test it.
Set Your Entry and Exit Rules
Your system should answer three things precisely:
When to enter a trade
When to exit a trade
How much to risk
Ambiguity is the enemy.
Rules make your strategy repeatable, testable, and objective.
Backtest the Logic
Before going live, test your rules on past data.
You’re not looking for perfection, you’re looking for consistency.
If your logic survives bull, bear, and sideways markets, it’s valid.
Track win rate, drawdown, and profit factor — they’ll tell you what’s working.
Execute With Discipline
A system only works if you do.
Follow the rules exactly as tested, even when it feels uncomfortable.
Consistency turns probability into profit — emotions destroy both.
Application
Here we have a very good example from our trading signals where we executed one of our strategies for 10 days. The strategy was designed with detailed inputs, logic and executed with a precise setup in a trading bot.
Refine and Evolve
Once live, keep notes.
Track how the system performs under real conditions.
Make small, measured improvements based on data, not emotion.
A system should evolve, not change its identity.
Redefining and tuning is a part of the process, there is no strategy that lasts forever, everything needs to evolve and adjust!
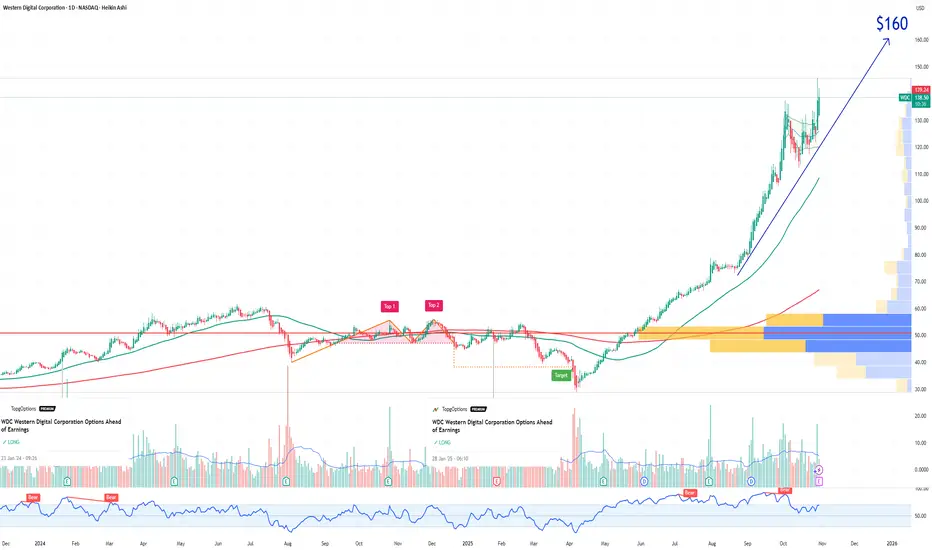
WDC Western Digital Corporation Options Ahead of EarningsIf you haven`t bought WDC before the rally:
Now analyzing the options chain and the chart patterns of WDC Western Digital Corporation prior to the earnings report this week,
I would consider purchasing the 160usd strike price Calls with
an expiration date of 2025-11-21,
for a premium of approximately $4.35.
If these options prove to be profitable prior to the earnings release, I would sell at least half of them.
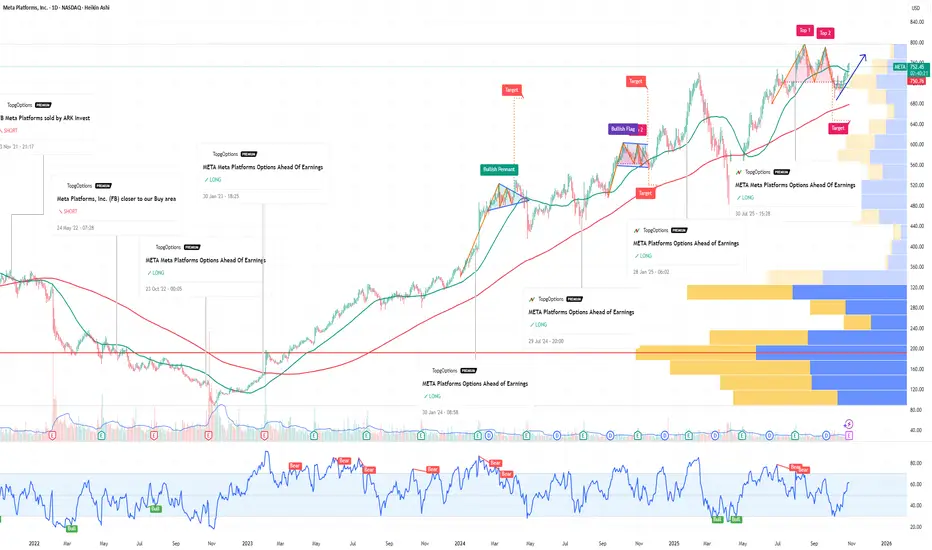
META Platforms Options Ahead of EarningsIf you haven`t bought META before the rally:
Now analyzing the options chain and the chart patterns of META Platforms prior to the earnings report this week,
I would consider purchasing the 720usd strike price Calls with
an expiration date of 2025-11-21,
for a premium of approximately $51.75.
If these options prove to be profitable prior to the earnings release, I would sell at least half of them.
Understanding Psychological LevelsDefinition:
In Trading, Psychological levels are often called round numbers or psy levels.
This is because the price ends in zeros and fives naturally attracting a trader’s attention.
Examples:
• Forex: 1.0000, 1.0500, 1.1000
• Stocks: $50, $100, $150, $200, $250
• Cryptocurrency: $10,000, $15,000, $20,000, $25,000
These levels are crucial as traders instinctively see targets in round numbers. (Or Incremental levels such as 5, 10, 15, 20, 25, 30 and so on...
This causes many buy, sell, and stop orders to cluster around the same price zones, creating self-reinforcing areas of interest in the market. Again, price sits at 113.2k – Psychological level is 115k.
___________________________________________________________________________________
Why Psychological Levels Matter in Trading
1) Human Bias:
Traders and investors often place orders at simple, rounded numbers. This makes their charts and order list “Clean.”
2) Institutional Targeting:
Large groups, whales or organizations use these levels to find liquidity or trigger stops. (Eg, BTC swept 125k before dumping)
3) Market Memory:
When a Psychological level reacts, traders remember it, and it often becomes relevant again in the future. (Turns into a prev liquidity sweep.)
5) Order Clustering:
Stop losses, take profits, and pending orders frequently build up around these areas. (As above, it builds liquidity.)
__________________________________________________________________________________
How to Identify Psychological Levels
Begin with marking clean, round (or quarterly) numbers on your chart. These are often major levels such as 4.0000, 5.0000, or 6.0000.
See the example below:
Then identify the midpoints/quarter points between them, like 4.5, 5.5, 6.5, 7.5, 8.5
See the example below:
For stronger assessments, look for psychological levels that align with other forms & tools of technical confluence—such as previous S & R, Supply/Demand, Highs & Lows, Fibonacci retracements, trendlines, or volume clusters.
See the example below:
When multiple forms of technical evidence converge near a round number, the level tends to have greater impact.
__________________________________________________________________________________
Trading Around Psychological Levels
When price approaches a psychological level, three common behaviors can occur:
1) Rejection:
Price touches the level and reverses quickly, suggesting strong defense by buyers or sellers. (Liquidity Sweep)
2) Break and Retest:
Price breaks through the level, then revisits it to confirm it as new support or resistance.
3) Compression or Grind:
Price consolidates near the level before a breakout as liquidity builds up.
Practical Application:
Enable alerts slightly before major psychological levels to observe reactions in real time (for example, 4.45 instead of 4.5 ). Wait for confirmation using price action such as a clear rejection wick, an engulfing candle, or a BOS (Break of Structure). Combine this analysis with liquidity or other forms of technical tools for a stronger assessment.
__________________________________________________________________________________
Trader Behavior at These Levels
Market reactions at psychological levels are largely directed by emotion and herd (Group) behavior. Fear of missing out can push price through a round number with momentum & speed while profit-taking can trigger short-term reversals & rejections. Stop hunts are also common, where smart money briefly pushes prices beyond a round level to collect liquidity before reversing. (From 4.0 up to 4.25 then down again)
Because many traders watch these same levels, reactions often repeat, reinforcing their significance.
__________________________________________________________________________________
Example: BTC/USD for $125k
When Bitcoin approaches $125k, many retail traders view it as a significant threshold. They might place short orders just below it or stop just above. Institutions recognize this and may intentionally push prices above $125k (sweeping $126k) to trigger those stops and fill large positions.
Once that liquidity is collected, price can reverse, and the $125k area may later serve as a new resistance zone.
This type of liquidity hunt and reversal pattern occurs frequently across all markets.
__________________________________________________________________________________
Practical Tips
1) Never trade purely based on a round number. Always wait for confirmation through structure or price action. (Retests, MSS, BOS, candle patterns etc)
2) Use alerts & alarms rather than fixed lines; prices often wick slightly above or below the exact level.
3) On higher timeframes, psychological levels often act as major turning zones. On lower timeframes, they tend to attract short-term reactions. (Lower the time frame, the more reactions = constant noise)
4) Combine psychological levels with liquidity, order flow, or volume analysis for a more complete view.
__________________________________________________________________________________
Summary
Psychological levels are where human reactions and liquidity meet. They represent areas of emotional and institutional/organizational interest rather than fixed points of reversal.
By understanding how traders behave around these zones and observing how price reacts to them, you can determine key movements with greater confidence.

LTC: long position!The month of trading proved to be good (LTC).
The general trend shows an increase in prices, with the last buy signal being given in the range of 92-94 USDT, after which the price continued to move up to the current level of about 102.39 USDT

BRIEFING Week #43 : The Value Trade
Here's your weekly update ! Brought to you each weekend with years of track-record history..
Don't forget to hit the like/follow button if you feel like this post deserves it ;)
That's the best way to support me and help pushing this content to other users.
Kindly,
Phil

Some notes to reflect on. A little how to for the indicatorHey everyone,
Hope you guys & gals are doing well using these indicators. I'm publishing a chart that I wrote some notes for. Notes are offering some insight on what look for when using this indicator. If you have any questions, let me know. I am planning to get videos up soon when I get some extra free time.
Thank you again for the support!
BYD Boyd Gaming Corporation Options Ahead of EarningsAnalyzing the options chain and the chart patterns of BYD Boyd Gaming Corporation prior to the earnings report this week,
I would consider purchasing the 95usd strike price Calls with
an expiration date of 2025-12-19,
for a premium of approximately $0.82.
If these options prove to be profitable prior to the earnings release, I would sell at least half of them.

PG The Procter & Gamble Company Options Ahead of EarningsIf you haven`t bought the dip on PG:
Now analyzing the options chain and the chart patterns of PG The Procter & Gamble Company prior to the earnings report this week,
I would consider purchasing the 152.50usd strike price Calls with
an expiration date of 2025-11-21,
for a premium of approximately $3.55.
If these options prove to be profitable prior to the earnings release, I would sell at least half of them.

TSLA Tesla Options Ahead of EarningsIf you haven`t bought the dip on TSLA:
Now analyzing the options chain and the chart patterns of TSLA Tesla prior to the earnings report this week,
I would consider purchasing the 800usd strike price Calls with
an expiration date of 2027-1-15,
for a premium of approximately $40.30.
If these options prove to be profitable prior to the earnings release, I would sell at least half of them.
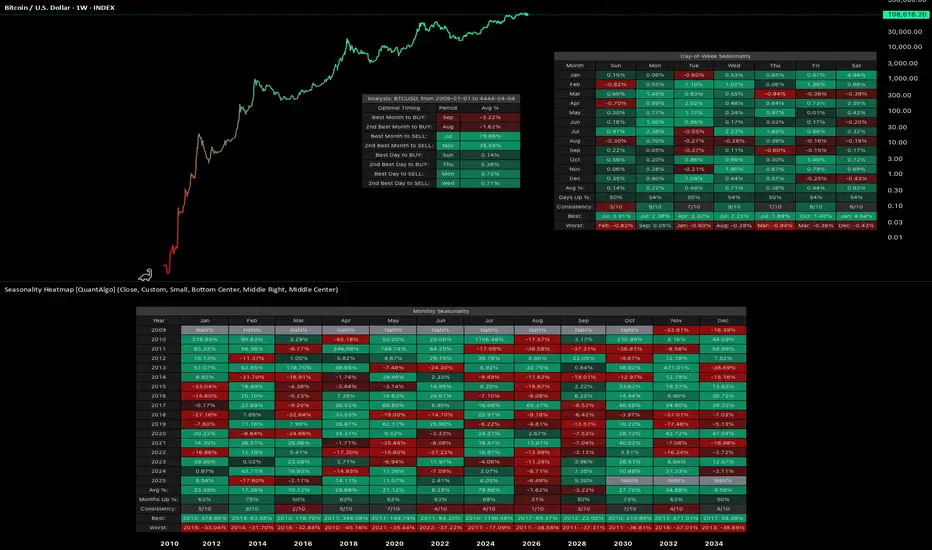
Market Seasonality: Finding Statistical Edges in Price Patterns🟢 Overview
Market seasonality refers to recurring, quantifiable patterns in asset price movements that appear consistently across different time periods. Rather than mystical predictions, these patterns reflect systematic behavioral trends, institutional flows, and market structures that have persisted across years, and in some cases, centuries, of trading history.
🟢 How Seasonality Works
Seasonality analysis examines historical price data to identify months or periods when specific assets have historically shown strength or weakness. The approach replaces emotion-driven decision-making with probabilistic insights based on historical performance across complete market cycles, including bull markets, bear markets, and periods of consolidation. By quantifying these patterns, traders and investors can identify potential statistical edges in their execution timing.
🟢 Evidence Across Asset Classes
1. Bitcoin INDEX:BTCUSD
Since the development of futures markets and institutional participation, Bitcoin has demonstrated notable seasonal patterns with measurable statistical significance. September has averaged -1.92% returns, establishing it as the weakest month. In contrast, October has emerged as the strongest performer with average returns of +21.59% and a 90% positive occurrence. This level of consistency suggests a robust statistical edge rather than random variation.
Day-of-week patterns in modern Bitcoin are relatively tight, with differences ranging from 0.07% to 0.50%. Monday edges out as the optimal day for selling positions. However, these daily patterns offer considerably less statistical significance than the monthly seasonality effects, as the weekly variations have smoothed out compared to Bitcoin's earlier history.
2. Ethereum INDEX:ETHUSD
Ethereum displays even more pronounced seasonal variations with stronger directional bias. September has been particularly challenging, averaging -10.04% returns and showing negative performance in eight out of ten years, representing an 80% probability of decline. June also demonstrates weakness at -7.20% average returns. Conversely, May stands out as the strongest month with average returns of +34.97%, positive 70% of the time across the dataset. May has delivered positive returns in seven out of ten years, providing a statistically meaningful edge.
Day-of-week analysis reveals differences of 0.2% to 0.6%, with Wednesday edging out slightly for selling and Tuesday showing marginally better performance for buying. However, these daily variations lack statistical significance when compared to the dramatic monthly patterns, representing more noise than actionable alpha for systematic strategies.
3. S&P 500 SP:SPX
With over 50 years of data dating back to 1971, the S&P 500 demonstrates the famous "September Effect." September averages -0.90% returns and has been negative with notable consistency, establishing statistical significance through sheer sample size. November, capturing typical year-end institutional positioning, averages +1.73% with positive performance 70% of the time. April comes in second at +1.44% average returns. The persistence of these patterns across five decades provides robust evidence of systematic seasonal effects even in highly efficient markets.
Day-of-week effects in the S&P 500 are minimal, ranging from just 0.01% to 0.07%. Monday shows a slight negative drift at -0.01%, while Wednesday edges up 0.07%. These intraday variations fall well within normal variance and lack statistical significance for execution timing. For this index, monthly patterns provide the primary source of seasonal alpha.
4. Gold OANDA:XAUUSD
Perhaps most compelling is gold's seasonal data spanning nearly 200 years since 1832, offering an extraordinarily large sample size for statistical validation. January shows the strongest average returns at +0.99% and has been positive 80% of the time, representing a highly reliable statistical edge. June represents the weakest period at -0.18% average returns, with October also serving as a potential entry point at just 0.05% average returns. July comes in as the second-best month at +0.79%. The consistency of these patterns across multiple centuries, world events, and monetary system changes indicates deeply embedded structural inefficiencies in market dynamics.
Day-of-week patterns in gold are similarly minimal. Thursday edges out at 0.09% for optimal selling, while Sunday shows 0.01% for buying opportunities. Like the S&P 500, gold trades predominantly on monthly patterns rather than daily variations, with intraweek effects lacking statistical significance.
🟢 TL;DR
1. Bitcoin INDEX:BTCUSD : Accumulate during September weakness (-1.92%), sell into October strength (+21.59%). October has been positive 9 out of 10 years since 2015, representing a 90% positive occurrence. Day of week: Sunday dips for buying, Monday for selling.
2. Ethereum INDEX:ETHUSD : Summer pain is real. September (-10.04%) and June (-7.20%) are buying opportunities. May (+34.97%) is the monster month historically, positive 7 out of 10 years (70% positive frequency). Day of week: Tuesday buying, Wednesday selling, but minimal statistical significance.
3. S&P 500 SP:SPX : The September Effect demonstrates statistical significance (-0.90% average over 50+ years). November (+1.73%) captures the year-end rally with 70% positive occurrence. Day of week effects are negligible (0.01-0.07%) and lack statistical significance.
4. Gold OANDA:XAUUSD : January strength (+0.99%, 80% positive frequency) after June weakness (-0.18%). Nearly 200 years of data backing these patterns provides exceptional statistical validation. Day of week: Sunday buying, Thursday selling, but minimal differences.
🟢 Final thoughts
Ultimately, seasonality analysis does not guarantee future results, but it provides a framework for probabilistic decision-making with quantifiable statistical edges. Rather than attempting to time markets based on sentiment or short-term price movements, systematic traders and investors can align decisions with periods that have historically shown consistent strength or weakness with statistical significance. This approach is particularly valuable for planning entry and exit points, portfolio rebalancing, and managing position sizing within a rules-based framework.
Notably, while day-of-week patterns exist in some assets, monthly seasonality tends to provide more significant and statistically reliable edges across most markets. The data suggests that seasonal patterns persist even in highly efficient markets, driven by recurring institutional behaviors, tax considerations, and structural market dynamics that create exploitable inefficiencies.
Market seasonality should be viewed as one analytical tool within a comprehensive quantitative framework, not a guarantee of performance, but a method to incorporate historical probabilities and statistical edges into systematic investment decisions.
This isn't about perfect timing either. It's about leveraging statistical edges based on historical probabilities instead of emotion. You'll still be wrong sometimes, but less often when operating with decades of data and quantifiable patterns rather than sentiment alone.
👉 Try the Seasonality Heatmap indicator yourself on TradingView to explore these patterns across different assets and timeframes.
*This analysis is for educational purposes only and is not financial advice. Past performance does not guarantee future results. Always do your own research and consult with a qualified financial advisor before making investment decisions.
SOL: intraday transactionsAfter a strong decline, intraday trades can be traded. While the long position is open, the part has already been fixed

BRIEFING Week #41 : Havoc on CryptosHere's your weekly update ! Brought to you each weekend with years of track-record history..
Don't forget to hit the like/follow button if you feel like this post deserves it ;)
That's the best way to support me and help pushing this content to other users.
Kindly,
Phil

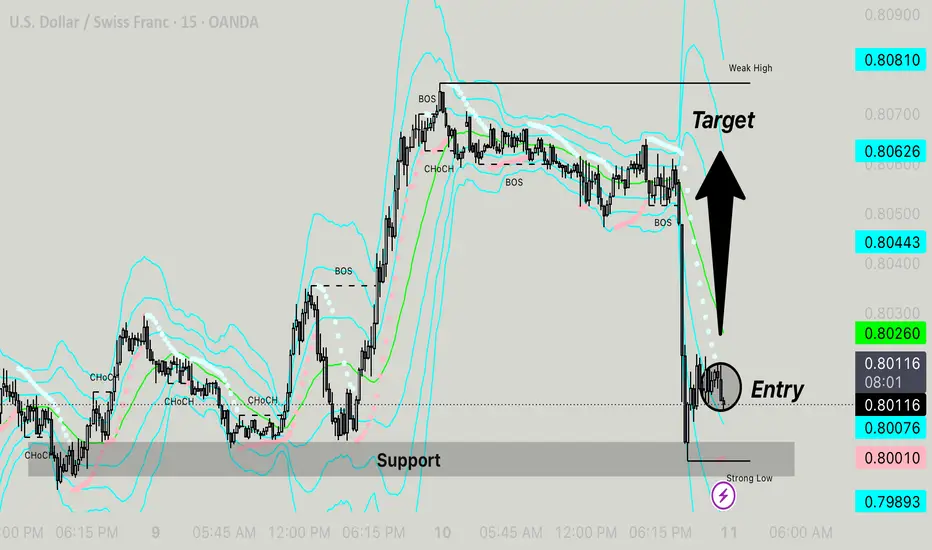
Smart Money Long SetupKey Concepts:
CHoCH (Change of Character) and BOS (Break of Structure) confirm shifts in market direction and continuation.
Liquidity Grab: Price swept a strong low and tapped into a major support zone, inducing sellers before reversing.
Entry Point: After the liquidity sweep, bullish reaction and structure formed a favorable entry (marked on chart).
Target: The target is set at a prior weak high, aligning with imbalance and liquidity resting above.
🔍 Confluences:
Price broke multiple minor structures (BOS) after the CHoCH.
Dynamic support from the Keltner/Bollinger-like bands shows mean reversion potential.
Strong rejection wick and consolidation at support confirm buyer interest.
Trade Idea:
Entry: ~0.80118
Target: ~0.80810
Stop Loss: Just below the strong low ~0.80010 or adjusted as per risk appetite.
Risk-Reward: Favorable R:R setup, especially if price reclaims mid-range levels above 0.80443.
ETH : analysis of the main timeframes!Hi😊
Today we'll be analyzing the ETH USDT trading pair.
We'll start with the higher timeframe and move on to the lower one.
Let's start with the daily chart: after breaking the high, the price continued to trade sideways.
The IMB was tested from below, which responded and sent the price into a correction toward the downward wave.
After the local liquidity drain, the price showed bearish aggression.
Nearest support zone $4 332 - $4 245
1h timeframe: the price is showing a corrective movement, and has identified zones above from which a reaction to a further decline may occur
15m timeframe: there is a buildup of local liquidity for asset growth and price delivery to nearby problem areas
Leave your reactions and comments if you like these short reviews

Bullish Thesis: Why AMD Stock Could Soar by Year-End 2025If you haven`t bought AMD before the previous rally:
What to consider now:
1. AI Tailwinds Are Accelerating
AMD is finally gaining serious traction in the AI GPU race. Its MI300X accelerator chips are being adopted by big names like Microsoft, Meta, and Oracle for data center AI workloads. While NVIDIA is still dominant, AMD is expected to grab 10–20% of the AI GPU market share by 2025, according to industry estimates. That’s a multibillion-dollar opportunity.
The MI300X already passed $1B in revenue within its first quarters.
AI server TAM (total addressable market) is expected to grow to $400B by 2027 — AMD is positioning itself aggressively to carve out its slice.
2. Valuation Looks Reasonable vs Peers
AMD trades at a forward P/E around 40, significantly below Nvidia (which trades over 60x) despite similar growth projections for the next 2 years.
Revenue expected to grow over 15–20% YoY in 2025.
Gross margins expanding as high-performance chips dominate the mix.
3. Diversified Growth: Beyond AI
Gaming segment (PlayStation 5 and Xbox Series X chips) remains strong.
Embedded segment from Xilinx acquisition continues to generate solid cash flow.
Client CPU business is rebounding as the PC market stabilizes.
4. Strong Management and Execution
CEO Lisa Su is widely respected for turning AMD around and guiding the company through major innovations and acquisitions (Xilinx, Pensando). Execution has remained consistent, especially in delivering cutting-edge performance-per-watt chips.
Disclosure: I am part of Trade Nation's Influencer program and receive a monthly fee for using their TradingView charts in my analysis.
