Potential bullish bounce off?Dow Jones (US30) has bounced off the pivot, which is a pullback support and could rise to the 1st resistance, which is a swing high resistance.
Pivot: 46,869.22
1st Support: 46,429.35
1st Resistance: 48,012.20
Disclaimer:
The above opinions given constitute general market commentary, and do not constitute the opinion or advice of IC Markets or any form of personal or investment advice.
Any opinions, news, research, analyses, prices, other information, or links to third-party sites contained on this website are provided on an "as-is" basis, are intended only to be informative, is not an advice nor a recommendation, nor research, or a record of our trading prices, or an offer of, or solicitation for a transaction in any financial instrument and thus should not be treated as such. The information provided does not involve any specific investment objectives, financial situation and needs of any specific person who may receive it. Please be aware, that past performance is not a reliable indicator of future performance and/or results. Past Performance or Forward-looking scenarios based upon the reasonable beliefs of the third-party provider are not a guarantee of future performance. Actual results may differ materially from those anticipated in forward-looking or past performance statements. IC Markets makes no representation or warranty and assumes no liability as to the accuracy or completeness of the information provided, nor any loss arising from any investment based on a recommendation, forecast or any information supplied by any third-party.
Indices

Intraday Range Expansion and Potential Repricing on the SPXFollowing a clean sweep of Friday’s high, price delivered a strong displacement to the downside, breaking short-term structure and rebalancing inefficiencies left behind. The subsequent rebound towards the daily open suggests a retracement into a premium area, potentially setting up for continuation lower if rejection holds around that zone.
If buyers fail to sustain price above the daily open, the market could aim for a full range fill back toward the previous low or discount zones below, maintaining the current bearish intraday order flow.
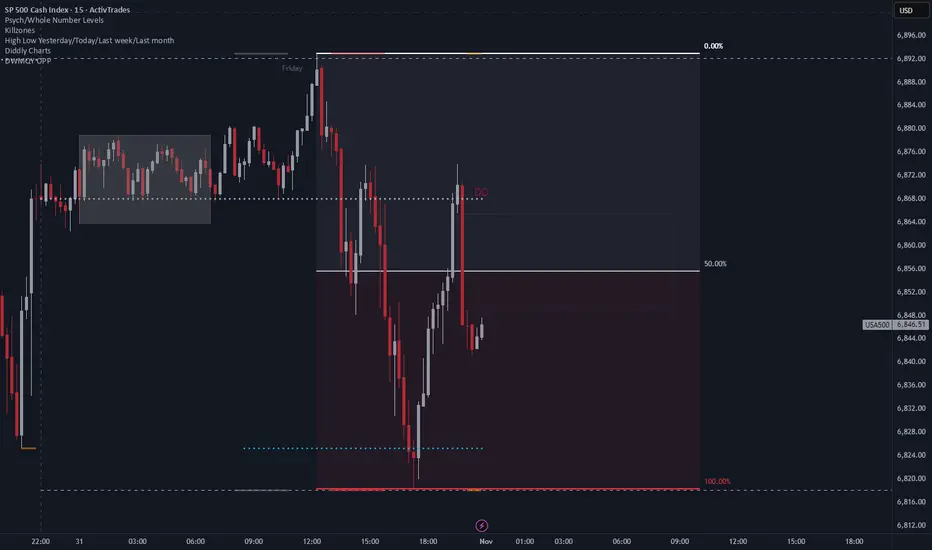
Potential Range Rebalance After Bullish Exhaustion on SP500Based on Candle Range Theory , the recent large bullish range has been followed by a series of smaller bearish candles, showing reduced momentum and potential exhaustion from buyers. Price is currently retracing into the lower range of the previous expansion, indicating that liquidity may be resting below.
If price fails to reclaim the upper range of the previous bullish candle, we could see continuation to the downside as the market seeks equilibrium within or below that expansion range. However, a strong rejection from the lower boundary could confirm range preservation and set up another bullish leg.
In short : the market’s next move depends on whether this retracement turns into a liquidity grab or a deeper correction beneath the prior candle range.

Bullish bounce off?DJ30 is falling towards the support level, which is a pullback support that aligns with the 38.2% Fibonacci retracement and could bounce from this level to our take-profit.
Entry: 47,0090.29
Why we like it:
There is a pullback support that aligns with the 38.2% Fibonacci retracement.
Stop loss: 46,642.72
Why we like it:
There is an overlap support that is slightly below the 50% Fibonacci retracement.
Take profit: 48,056.22
Why we like it:
There is a swing high resistance level.
Enjoying your TradingView experience? Review us!
Please be advised that the information presented on TradingView is provided to Vantage (‘Vantage Global Limited’, ‘we’) by a third-party provider (‘Everest Fortune Group’). Please be reminded that you are solely responsible for the trading decisions on your account. There is a very high degree of risk involved in trading. Any information and/or content is intended entirely for research, educational and informational purposes only and does not constitute investment or consultation advice or investment strategy. The information is not tailored to the investment needs of any specific person and therefore does not involve a consideration of any of the investment objectives, financial situation or needs of any viewer that may receive it. Kindly also note that past performance is not a reliable indicator of future results. Actual results may differ materially from those anticipated in forward-looking or past performance statements. We assume no liability as to the accuracy or completeness of any of the information and/or content provided herein and the Company cannot be held responsible for any omission, mistake nor for any loss or damage including without limitation to any loss of profit which may arise from reliance on any information supplied by Everest Fortune Group.

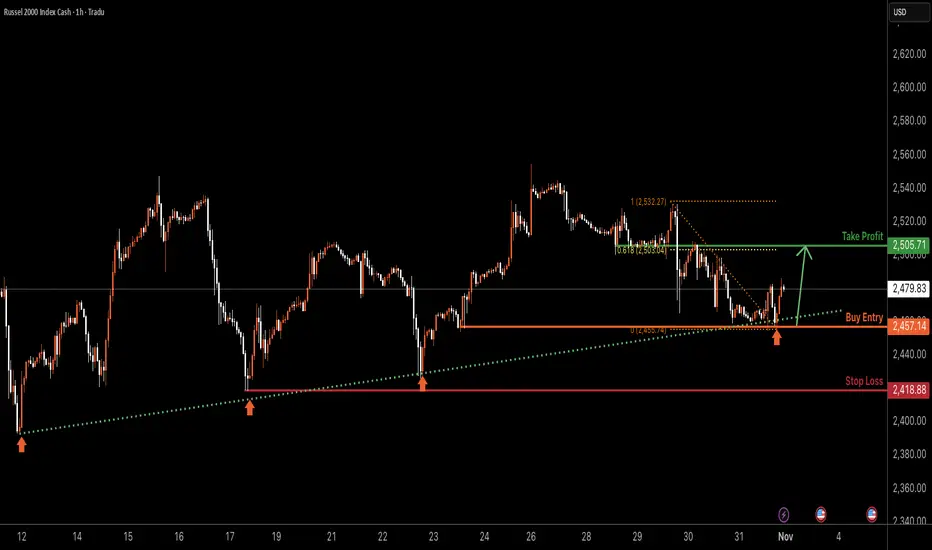
US2000 H1 | Bullish Bounce OffBased on the H1 chart analysis, we can see that the price has bounced off the buy entry, which is a pullback support and could rise from this level to the upside.
Buy entry is at 2,457.14, which is a pullback support.
Stop loss is at 2,418.88, which is a multi-swing low support.
Take profit is at 2,505.71, whic is an overlap resistance that aligns with the 61.8% Fibonacci retracement.
Stratos Markets Limited (tradu.com ):
CFDs are complex instruments and come with a high risk of losing money rapidly due to leverage. 68% of retail investor accounts lose money when trading CFDs with this provider. You should consider whether you understand how CFDs work and whether you can afford to take the high risk of losing your money.
Stratos Europe Ltd (tradu.com ):
CFDs are complex instruments and come with a high risk of losing money rapidly due to leverage. 70% of retail investor accounts lose money when trading CFDs with this provider. You should consider whether you understand how CFDs work and whether you can afford to take the high risk of losing your money.
GER30 H4 | Bullish Reversal from Overlap Support LevelBased on the H4 chart analysis, we could see the price fall to the buy entry which is an overlap support and could bounce from this level to the upside.
Buy entry is at 23,885.59, which is an overlap support.
Stop loss is at 23,661.20, whic is a pullback support that is slightly above the 100% Fibonacci projection.
Take profit is at 24,383.02, which is an overlap resistance.
Stratos Markets Limited (tradu.com ):
CFDs are complex instruments and come with a high risk of losing money rapidly due to leverage. 68% of retail investor accounts lose money when trading CFDs with this provider. You should consider whether you understand how CFDs work and whether you can afford to take the high risk of losing your money.
Stratos Europe Ltd (tradu.com ):
CFDs are complex instruments and come with a high risk of losing money rapidly due to leverage. 70% of retail investor accounts lose money when trading CFDs with this provider. You should consider whether you understand how CFDs work and whether you can afford to take the high risk of losing your money.

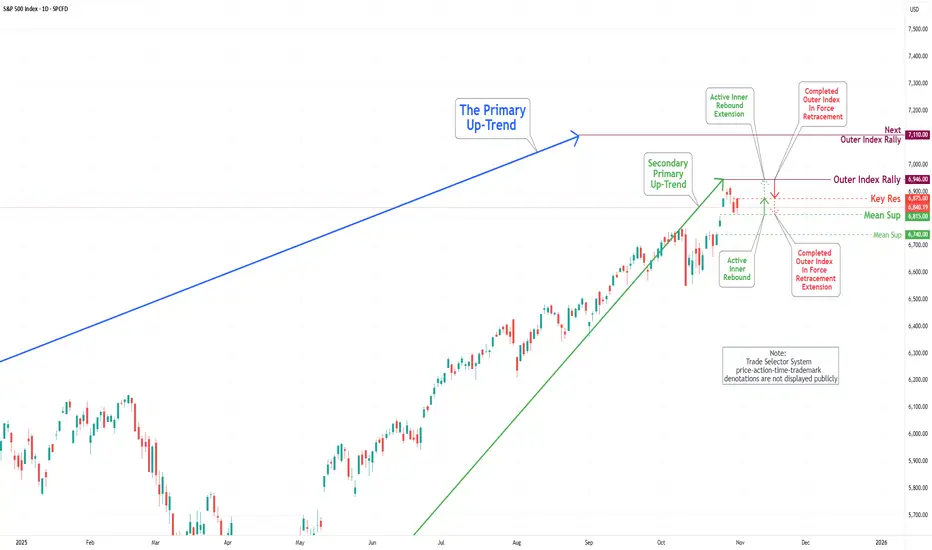
S&P 500 Daily Chart Analysis For Week of Oct 31, 2025Technical Analysis and Outlook:
During the recent trading session, the S&P 500 Index continued its wild ride, highlighting the importance of our key target, which stands as an Outer Index Rally at 6946. Fluctuations between the Mean Support at 6815 and the Key Resistance at 6875 serve as a crucial threshold for market participants. This positioning suggests the potential for further upward momentum, as the prevailing trend indicates a well-structured Active Inner Rebound extension toward the target stated above.
Nevertheless, it is essential to acknowledge the possibility of a sustained and gradual pullback within the current Active Inner Rebound zone. Such a pullback may retest the Mean Support at 6815 and could decline further to the Mean Support at 6740 before ultimately resuming an upward trajectory.
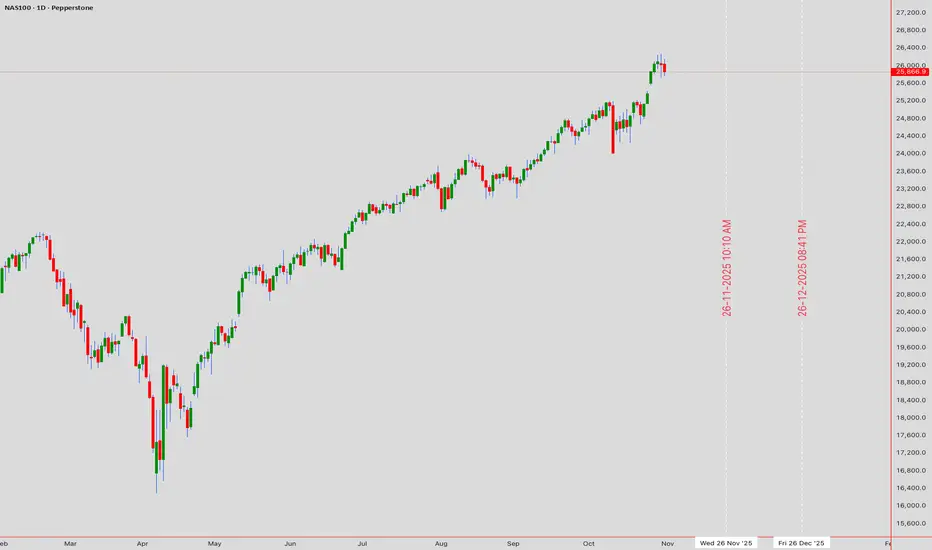
NAS100 Master Technical Analysis | Weekly Forecast Nov 3-7🚀 NAS100 NASDAQ-100 INDEX | Master Technical Analysis | Weekly Forecast Nov 3-7, 2025 🚀
📈 MULTI-TIMEFRAME ANALYSIS | INTRADAY & SWING TRADING BLUEPRINT | 25,866.9 📈
Closing Level: 25,866.9 | Analysis Date: November 1, 2025 | UTC+4
════════════════════════════════════════════════════════════════
🎯 MARKET OVERVIEW & CRITICAL LEVELS
NASDAQ-100 consolidates near all-time high territory at 25,866.9 , presenting a pivotal moment for tech bulls. Our comprehensive multi-timeframe analysis reveals a cautiously bullish stance with immediate resistance at 25,900 and crucial support at 25,750. The upcoming week offers exceptional opportunities for both scalpers and position traders as we navigate post-earnings volatility.
Major Support Levels: 📉
Immediate: 25,800 - 25,820
Secondary: 25,750 - 25,770
Critical: 25,650 - 25,680
Major: 25,500 - 25,550
Key Resistance Zones: 📈
Immediate: 25,900 - 25,920
Secondary: 25,980 - 26,000
Psychological: 26,100 - 26,150
Major Target: 26,250 - 26,300
════════════════════════════════════════════════════════════════
📊 WEEKLY TIMEFRAME (1W) - THE BIG PICTURE
Elliott Wave Structure: 🌊
Currently navigating Wave 4 correction within larger degree Wave 5 . The shallow retracement suggests strength, targeting 26,500+ upon completion. Alternate count places us in Wave B of an ABC correction - monitor 25,500 for validation.
Wyckoff Analysis: 📖
Textbook Re-accumulation Trading Range (TR) after upthrust. Volume signature confirms Phase C - Last Point of Support (LPS). Expect markup phase initiation above 25,920.
Ichimoku Cloud Perspective: ☁️
Price maintains position above weekly Kumo with Chikou Span confirmation. Tenkan-sen at 25,720 provides dynamic support. Bullish TK cross intact since October.
Harmonic Pattern Alert: 🦋
Potential Bullish Crab pattern forming with PRZ at 25,650-25,700. The 1.618 XA extension at 26,450 serves as measured target upon pattern completion.
Gann Analysis: 📐
Price respecting 1x1 Gann angle from September low. Next significant Gann resistance at 26,080 (45-degree angle from yearly pivot).
════════════════════════════════════════════════════════════════
📉 DAILY TIMEFRAME (1D) - SWING TRADER'S ROADMAP
Japanese Candlestick Patterns: 🕯️
Yesterday's Spinning Top at resistance signals indecision. Watch for today's close above 25,900 to confirm Three White Soldiers continuation pattern.
Pattern Recognition:
Ascending Triangle formation with horizontal resistance at 25,900. Successful breakout projects 26,250 target (350-point measured move).
Bollinger Bands Analysis:
Price kissing upper band (25,885) with bands expanding - volatility breakout imminent. Middle band at 25,720 serves as dynamic support.
RSI & Momentum Oscillators:
RSI at 62 - bullish but not overbought. Hidden bullish divergence on 4H timeframe supports continuation thesis.
Volume Profile: 📊
High Volume Node (HVN) at 25,750-25,800 acting as support magnet. Point of Control (POC) at 25,680 defines major support.
════════════════════════════════════════════════════════════════
⏰ 4-HOUR TIMEFRAME (4H) - SWING & INTRADAY FUSION
Dow Theory Application: 📈
Primary trend: Bullish (series of HH-HL intact)
Secondary trend: Consolidation phase
Minor trend: Testing resistance
Chart Pattern Alert:
Bull Flag completion targeting 26,050. Flag pole: 25,600-25,900 (300 points). Breakout confirmation above 25,920 activates pattern.
Moving Average Configuration:
EMA 20: 25,825 (immediate support)
EMA 50: 25,760 (strong support)
SMA 100: 25,680 (critical support)
SMA 200: 25,550 (major support)
VWAP Analysis:
Weekly VWAP at 25,810 acting as dynamic pivot. Price above VWAP = bullish intraday bias.
════════════════════════════════════════════════════════════════
🎪 1-HOUR TIMEFRAME (1H) - PRECISION ENTRIES
Immediate Setup: 💡
Inverse Head & Shoulders pattern developing. Left shoulder: 25,750, Head: 25,700, Right shoulder forming at 25,760. Neckline at 25,900 - breakout targets 26,100.
Support & Resistance Matrix:
R4: 26,150 (Weekly R2 Pivot)
R3: 26,050 (Pattern Target)
R2: 25,980 (Psychological)
R1: 25,920 (Neckline)
PIVOT: 25,866 (Current)
S1: 25,820 (1H Support)
S2: 25,760 (Right Shoulder)
S3: 25,700 (Pattern Low)
Entry Strategies: 🎯
Breakout Long: Above 25,920 | Stop: 25,850 | Target: 26,050
Pullback Long: 25,820 test | Stop: 25,760 | Target: 25,920
Reversal Long: 25,760 bounce | Stop: 25,700 | Target: 25,900
════════════════════════════════════════════════════════════════
⚡ 30-MINUTE TIMEFRAME (30M) - SCALPER'S PLAYGROUND
Micro Structure: 🔍
Rising Wedge pattern - bearish implications short-term. Expect pullback to 25,800 before continuation. Volume declining confirms pattern.
Scalping Zones: 🎯
Prime Buy Zones:
• Zone A: 25,820-25,830 (30M demand)
• Zone B: 25,790-25,800 (VWAP test)
• Zone C: 25,760-25,770 (Strong support)
Prime Sell Zones:
• Zone A: 25,900-25,910 (30M supply)
• Zone B: 25,940-25,950 (Extension)
• Zone C: 25,980-26,000 (Major resistance)
ATR & Volatility:
30M ATR(14): 35 points - optimal stop-loss range: 25-30 points
════════════════════════════════════════════════════════════════
🏃 15-MINUTE & 5-MINUTE ULTRA-SCALPING
15-Minute Momentum Setup: ⚠️
Bullish Pennant forming - breakout above 25,880 targets 25,920 (40-point quick move).
5-Minute Precision Matrix:
London Open: Range 25,840-25,880
NY Pre-market: Breakout potential above 25,900
NY Open: Volatility spike - 50+ point moves
NY Afternoon: Consolidation 25,850-25,900
RSI Scalping Strategy:
5M RSI < 25: Oversold bounce long
5M RSI > 75: Overbought short
15M RSI divergence: Position entry
Optimal RSI range: 40-60 for trends
════════════════════════════════════════════════════════════════
📅 WEEKLY FORECAST & DAILY GAMEPLAN (Nov 3-7, 2025)
Monday, November 3: 🚀
Gap-up potential to 25,920. First test of resistance.
Strategy: Wait for pullback to 25,850 for longs
Target: 25,950-25,980
Tuesday, November 4: 📊
Election uncertainty - expect 100+ point range.
Strategy: Fade extremes with tight stops
Range: 25,750-25,950
Wednesday, November 5: 💥
Breakout day - major move expected post-election.
Strategy: Momentum trades only
Breakout target: 26,100+
Thursday, November 6: 🔄
Consolidation/profit-taking day.
Strategy: Range trading 25,900-26,050
Focus: Mean reversion
Friday, November 7: 📈
Weekly options expiry - pin risk around 26,000.
Strategy: Fade moves away from 26,000
Close above 26,000 = Bullish weekly
════════════════════════════════════════════════════════════════
💼 COMPREHENSIVE TRADE MANAGEMENT
Intraday Risk Parameters: 🎮
Maximum risk per trade: 0.5-1% of capital
Risk-Reward minimum: 1:2.5 ratio
Daily stop loss: -2% of account
Trailing stop activation: After +30 points
Breakeven stop: After +20 points profit
Maximum daily trades: 3-5 quality setups
Swing Position Guidelines: 📊
Position sizing: 2-3% portfolio risk
Initial stop-loss: Below 25,650 (major support)
Target 1: 26,050 (30% exit)
Target 2: 26,150 (40% exit)
Target 3: 26,300 (20% exit)
Runner: 26,500 (10% moon shot)
════════════════════════════════════════════════════════════════
⚠️ RISK SCENARIOS & INVALIDATION TRIGGERS
Bearish Reversal Signals: 🐻
Hourly close below 25,800 = Caution mode
Daily close below 25,750 = Bearish shift
Break of 25,650 = Major support failure
Weekly close below 25,500 = Trend reversal
Black Swan Considerations: 🦢
• Tech earnings surprises
• Federal Reserve policy shifts
• Geopolitical tensions escalation
• Major tech regulatory news
• AI sector rotation risks
════════════════════════════════════════════════════════════════
🔥 HIGH-PROBABILITY CONFLUENCE ZONES
Ultimate Buy Zone: ✅
25,750-25,800
(EMA cluster + Fibonacci 61.8% + Volume POC + Daily pivot)
Ultimate Sell Zone: ❌
26,050-26,100
(Pattern targets + Weekly R1 + Psychological round number)
Breakout Trigger Zone: 🚀
25,920-25,950
(Multiple pattern completions + Resistance cluster)
════════════════════════════════════════════════════════════════
📝 WEEK AHEAD SUMMARY & ACTION ITEMS
The NASDAQ-100 stands at a critical technical juncture at 25,866.9. Multiple timeframe analysis confirms bullish bias above 25,750 with significant upside potential toward 26,300. The convergence of pattern completions, moving average support, and favorable volume dynamics creates an optimal risk-reward environment for disciplined traders.
Top 3 Trade Setups: 🏆
Swing Long: 25,750-25,800 zone | Target: 26,150
Breakout Long: Above 25,920 | Target: 26,050
Scalp Long: VWAP touches at 25,810 | Target: 25,900
Key Success Factors:
• Respect stop-losses religiously
• Scale in positions gradually
• Book partial profits at targets
• Trail stops on winners
• Stay patient for A+ setups
"The trend is your friend until the end when it bends" - Trade the trend, manage the risk!
════════════════════════════════════════════════════════════════
🎯 FINAL THOUGHTS
Tech bulls maintain control above 25,750. The path of least resistance remains HIGHER targeting 26,300. Election week volatility presents exceptional opportunities for prepared traders. Remember: Plan your trade, trade your plan!
Stay disciplined. Stay profitable. 💰
════════════════════════════════════════════════════════════════
#NAS100 #NASDAQ #TechnicalAnalysis #Trading #Indices #StockMarket #DayTrading #SwingTrading #ElliottWave #PriceAction #TradingStrategy #TradingView #MarketAnalysis #IndexTrading #TechStocks #SPX #QQQ #MarketForecast
🔔 Follow for Daily Premium Analysis! | Trade Smart, Not Hard! 📊
Risk Disclaimer: This analysis is for educational purposes only. Past performance doesn't guarantee future results. Always conduct your own research and implement proper risk management.
SPX500 H1 | Bullish Bounce OffS&P500 has bounced off the buy entry at 6,839.32, which is a pullback support that aligns with the 23.6% Fibonacci retracement and could rise from this level to the take profit.
Stop loss is at 6,793.88, which is a pullback support that lines up with the 50% Fibonacci retracement.
Take profit is at 6,926.57, which s a swing high resistance.
Stratos Markets Limited (tradu.com ):
CFDs are complex instruments and come with a high risk of losing money rapidly due to leverage. 68% of retail investor accounts lose money when trading CFDs with this provider. You should consider whether you understand how CFDs work and whether you can afford to take the high risk of losing your money.
Stratos Europe Ltd (tradu.com ):
CFDs are complex instruments and come with a high risk of losing money rapidly due to leverage. 70% of retail investor accounts lose money when trading CFDs with this provider. You should consider whether you understand how CFDs work and whether you can afford to take the high risk of losing your money.

US30 H1 | Bearish Reversal Off Pullback ResistanceThe price is rising towards the sell entry at 47,761.94, whichis a pullback resistance that aligns with the 50% Fibonacci retracement and could reverse from this level to the downside.
Stop loss is at 48,079.25, which is a multi-swing high resistance.
Take profit is at 47,337.75, which is a pullback support that is slightly above the 50% Fibonacci retracement.
Stratos Markets Limited (tradu.com ):
CFDs are complex instruments and come with a high risk of losing money rapidly due to leverage. 68% of retail investor accounts lose money when trading CFDs with this provider. You should consider whether you understand how CFDs work and whether you can afford to take the high risk of losing your money.
Stratos Europe Ltd (tradu.com ):
CFDs are complex instruments and come with a high risk of losing money rapidly due to leverage. 70% of retail investor accounts lose money when trading CFDs with this provider. You should consider whether you understand how CFDs work and whether you can afford to take the high risk of losing your money.

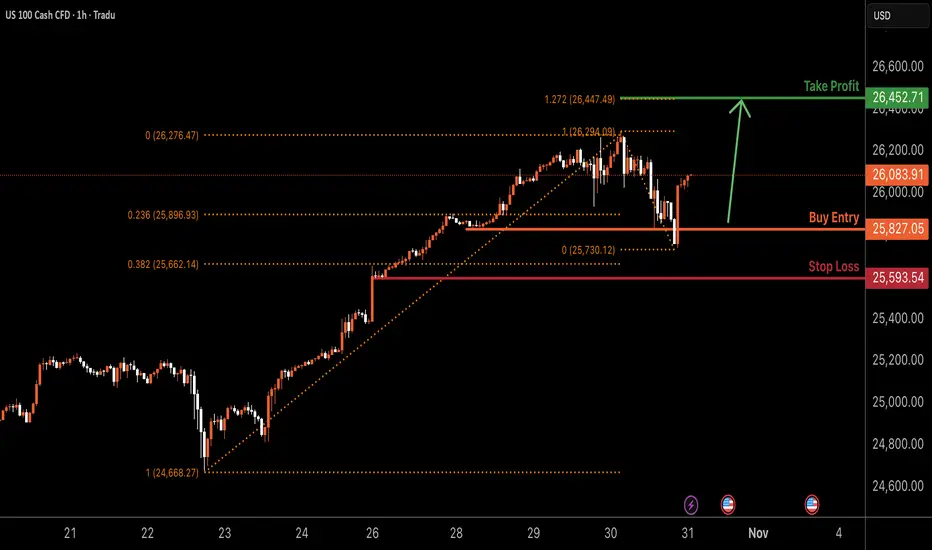
NAS100 H1 | Bullish Continuation In PlayNAS100 has bounced off the buy entry at 25,827.05, which is a pullback support that lines up with the 23.6% Fibonacci retracement and could rise from this level to the upside.
Stop loss is at 25,593.54, which is a pullback support that is slightly below the 50% Fibonacci retracement.
Take profit is at 26,452.71, which aligns with the 127.2% Fibonacci extension.
Stratos Markets Limited (tradu.com ):
CFDs are complex instruments and come with a high risk of losing money rapidly due to leverage. 68% of retail investor accounts lose money when trading CFDs with this provider. You should consider whether you understand how CFDs work and whether you can afford to take the high risk of losing your money.
Stratos Europe Ltd (tradu.com ):
CFDs are complex instruments and come with a high risk of losing money rapidly due to leverage. 70% of retail investor accounts lose money when trading CFDs with this provider. You should consider whether you understand how CFDs work and whether you can afford to take the high risk of losing your money.
US2000 H1 | Potential Bearish Drop Off US2000 has rejected the sell entry at 2,506.12, which is an overlap resistance and could drop from this level to the downside.
Stop loss is at 2,543.41, which is a swing high resistance.
Take profit is at 2,426.26, which is a multi swing low support.
Stratos Markets Limited (tradu.com ):
CFDs are complex instruments and come with a high risk of losing money rapidly due to leverage. 68% of retail investor accounts lose money when trading CFDs with this provider. You should consider whether you understand how CFDs work and whether you can afford to take the high risk of losing your money.
Stratos Europe Ltd (tradu.com ):
CFDs are complex instruments and come with a high risk of losing money rapidly due to leverage. 70% of retail investor accounts lose money when trading CFDs with this provider. You should consider whether you understand how CFDs work and whether you can afford to take the high risk of losing your money.

US30 Intraday Plan – Bullish Bias Above 47,700 - 28/10/2025US30 has been maintaining strong bullish structure with a series of higher highs and higher lows on the lower timeframes. After breaking through the 47,700 zone, price is now retesting that area — which may act as intraday support going into the U.S. session.
📊 Scenarios:
Bullish Scenario (Primary Bias)
Watch for a pullback into the 47,730–47,700 zone — this area may serve as a liquidity grab / confirmation zone before continuation.
If support holds, potential upside targets are:
TP1 → 47,850
TP2 → 47,950
TP3 → 48,000 (psychological level & round number target)
Bearish Scenario (Alternative)
If price rejects near 47,780 and fails to hold above 47,700, we could see a deeper retracement.
Downside targets in that case:
TP1 → 47,500
TP2 → 47,350–47,300
📈 Bias: Bullish above 47,700
📉 Invalidation: Sustained break below 47,600
This plan focuses on waiting for confirmation at key levels rather than chasing momentum. Watch the first 15–30 minutes after NY open for direction confirmation — expect volatility and potential fakeouts.

SPX500 H4 | Potential Bearish ReversalS&P500 is reacting off the sell entry at 6,888.42, which aligns with the 100% Fibonacci projection and could reverse from this level to the take profit.
Stop loss is at 6,950, whic is a swing high resistance level.
Take profit is at 6,761.08, which is a pullback support that aligns with the 38.2% Fibonacci retracement.
Stratos Markets Limited (tradu.com ):
CFDs are complex instruments and come with a high risk of losing money rapidly due to leverage. 68% of retail investor accounts lose money when trading CFDs with this provider. You should consider whether you understand how CFDs work and whether you can afford to take the high risk of losing your money.
Stratos Europe Ltd (tradu.com ):
CFDs are complex instruments and come with a high risk of losing money rapidly due to leverage. 70% of retail investor accounts lose money when trading CFDs with this provider. You should consider whether you understand how CFDs work and whether you can afford to take the high risk of losing your money.

US30 H4 | Bearish ReversalDow Jones (US30) is reacting off the sell entry, which aligns with hte 161.8% Fibonacci extension and the 61.8% Fibonacci projection, and could drop from this level to the downside.
Sell entry is at 47,651.31, which lines up with the 161.8% Fibonacci extension and the 61.8% Fibonacci projection.
Stop loss is at 48,228.80, whic lines up with the 100% Fibonacci projection.
Take profit is at 46,892.33, which is an overlap support that lines u;p with hte 38.2% Fibonacci retracement.
Stratos Markets Limited (tradu.com ):
CFDs are complex instruments and come with a high risk of losing money rapidly due to leverage. 68% of retail investor accounts lose money when trading CFDs with this provider. You should consider whether you understand how CFDs work and whether you can afford to take the high risk of losing your money.
Stratos Europe Ltd (tradu.com ):
CFDs are complex instruments and come with a high risk of losing money rapidly due to leverage. 70% of retail investor accounts lose money when trading CFDs with this provider. You should consider whether you understand how CFDs work and whether you can afford to take the high risk of losing your money.

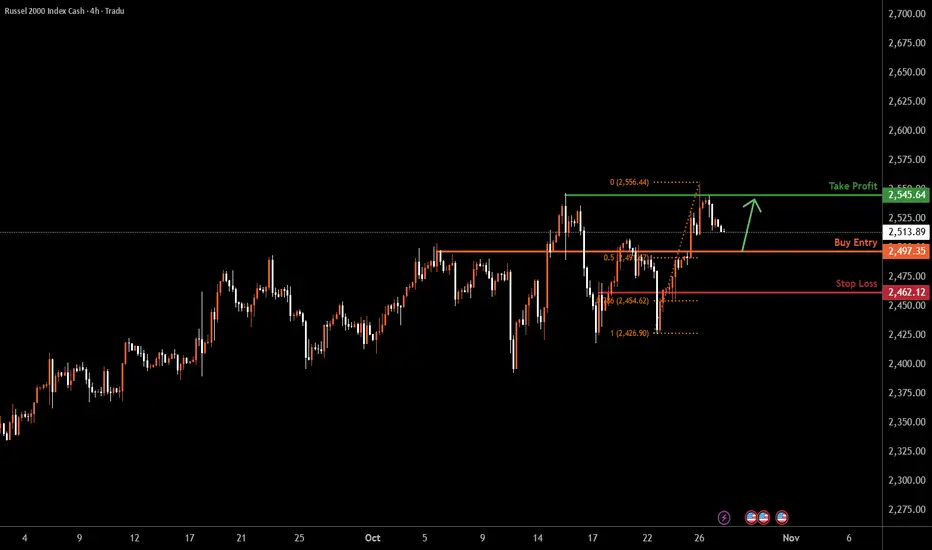
US2000 H4 | Bullish Bounce Off Key SupportUS2000 is falling towards the buy entry, which is an overlap support that aligns with the 50% Fibonacci retracement and could bounce from this level to the upside.
Buy entry is at 2,497.81, which is an overlap support that aligns with he 50% Fibonacci retracement.
Stop loss is at 2,462.12, whic is a pullback support that aligns with he 78.6% Fibonacci retracement.
Take profit is at 2,545.64, which is a multi swing high resistance.
Stratos Markets Limited (tradu.com ):
CFDs are complex instruments and come with a high risk of losing money rapidly due to leverage. 68% of retail investor accounts lose money when trading CFDs with this provider. You should consider whether you understand how CFDs work and whether you can afford to take the high risk of losing your money.
Stratos Europe Ltd (tradu.com ):
CFDs are complex instruments and come with a high risk of losing money rapidly due to leverage. 70% of retail investor accounts lose money when trading CFDs with this provider. You should consider whether you understand how CFDs work and whether you can afford to take the high risk of losing your money.
JPN225 H4 | Bullish Continuation SetupJPN225 is falling towards the buy entry at 49,979.88, which is a pullback support that is slightly below the 23.6% Fibonacci retracement and could bounce from this level to the upside.
Stop loss is at 48,579.49, which is an overlap support that is slightly above the 50% Fibonacci retracement.
Take profit is at 51,891.00, which lines up with the 78.6% Fibonacci projection.
Stratos Markets Limited (tradu.com ):
CFDs are complex instruments and come with a high risk of losing money rapidly due to leverage. 68% of retail investor accounts lose money when trading CFDs with this provider. You should consider whether you understand how CFDs work and whether you can afford to take the high risk of losing your money.
Stratos Europe Ltd (tradu.com ):
CFDs are complex instruments and come with a high risk of losing money rapidly due to leverage. 70% of retail investor accounts lose money when trading CFDs with this provider. You should consider whether you understand how CFDs work and whether you can afford to take the high risk of losing your money.

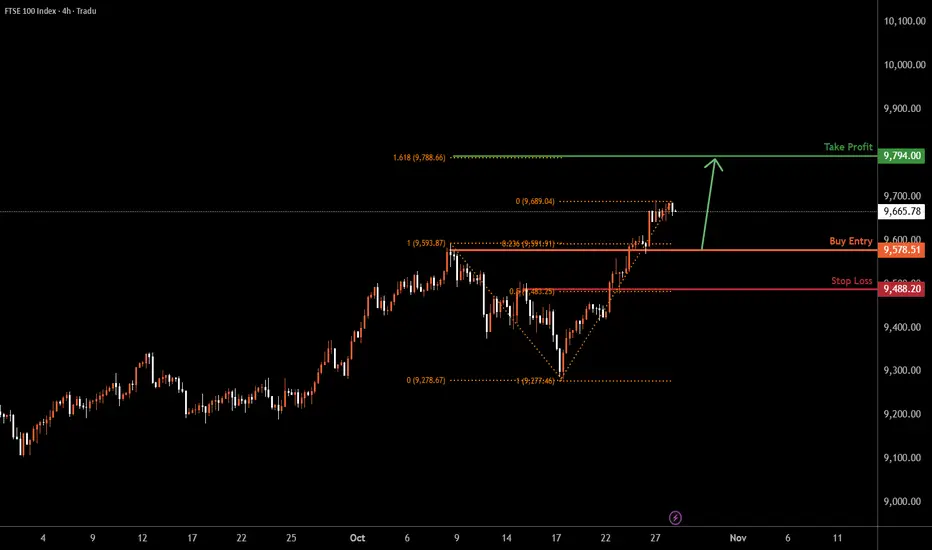
UK100 H4 | ullish Bounce off Pullback SupportUK100 is falling towards the buy entry, which is a pullback support that lines up with the 23.6% Fibonacci retracement and could bounce from this level to the upside.
Buy entry is at 9,578.51, which is a pullback support that aligns with the 23.6% Fibonacci retracement.
Stop loss is at 9,488.20, which is a pullback suport that aligns with the 50% Fibonacci retracement.
Take profit: 9,794.00, which is a resistance level that aligns with hte 161.8% Fibonacci extension.
Stratos Markets Limited (tradu.com):
CFDs are complex instruments and come with a high risk of losing money rapidly due to leverage. 68% of retail investor accounts lose money when trading CFDs with this provider. You should consider whether you understand how CFDs work and whether you can afford to take the high risk of losing your money.
Stratos Europe Ltd (tradu.com ):
CFDs are complex instruments and come with a high risk of losing money rapidly due to leverage. 70% of retail investor accounts lose money when trading CFDs with this provider. You should consider whether you understand how CFDs work and whether you can afford to take the high risk of losing your money.
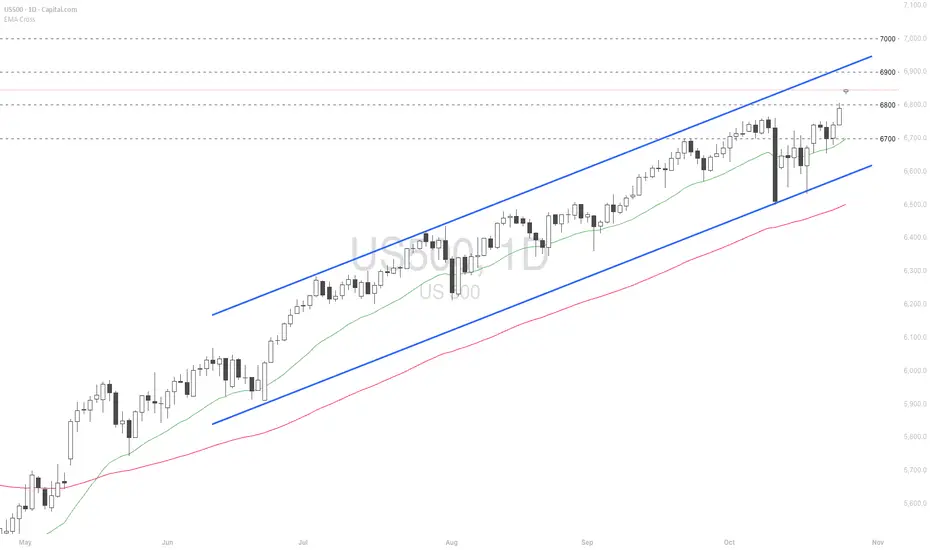
US stocks hit record highs on better-than-expected CPI
The Sep US CPI indicated that tariff-driven inflation has not materialized, reinforcing the Fed’s dovish policy stance and driving US equities to new record highs. The prevailing view in the market remains with “Don’t fight the Fed.” The stock market’s impressive resilience, defying the typical seasonal weakness through Oct, reflects a dovish Fed stance amid the absence of recession signals.
The S&P; 500 remained within the ascending channel, reaching a new high at 6,800. Diverging bullish EMAs suggest that the bullish structure may extend further. If the index closes above 6,800, it could advance toward 6,900. Conversely, a drop below 6,800 may lead the price to retreat toward 6,700, which coincides with EMA21.
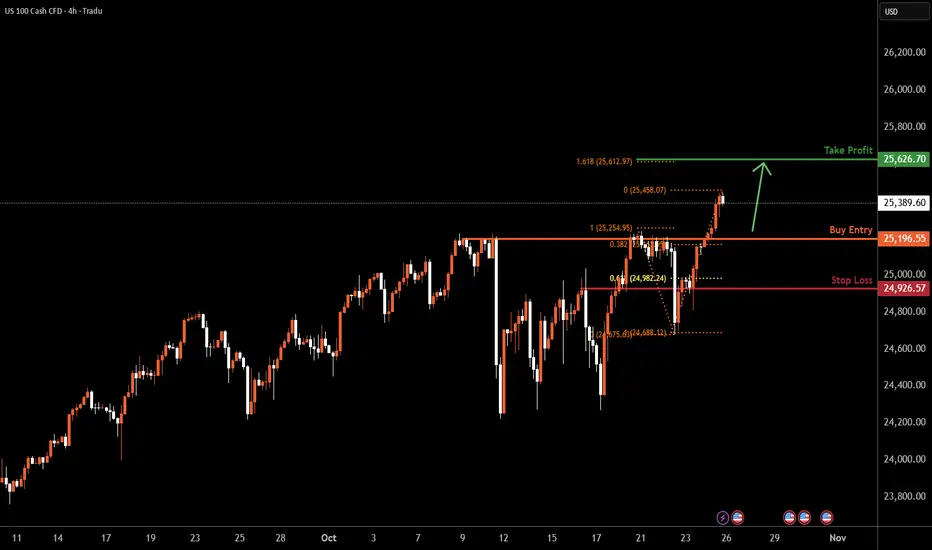
NAS100 | Bullish Momentum ExpectedBased on the H4 chart analysis, we could see the price fall to the buy entry at 25,196.55, which is a pullbakc support that lines up with the 38.2% Fibonacci retracement and could bounce from this level to the upside.
Stop loss is at 24,926.57, which is a pullback support that is slightly below the 61.8% Fibonacci retracement.
Take profit is at 25,626.70, which aligns with the 161.8% Fibonacci extension.
Stratos Markets Limited (tradu.com ):
CFDs are complex instruments and come with a high risk of losing money rapidly due to leverage. 68% of retail investor accounts lose money when trading CFDs with this provider. You should consider whether you understand how CFDs work and whether you can afford to take the high risk of losing your money.
Stratos Europe Ltd (tradu.com ):
CFDs are complex instruments and come with a high risk of losing money rapidly due to leverage. 70% of retail investor accounts lose money when trading CFDs with this provider. You should consider whether you understand how CFDs work and whether you can afford to take the high risk of losing your money.
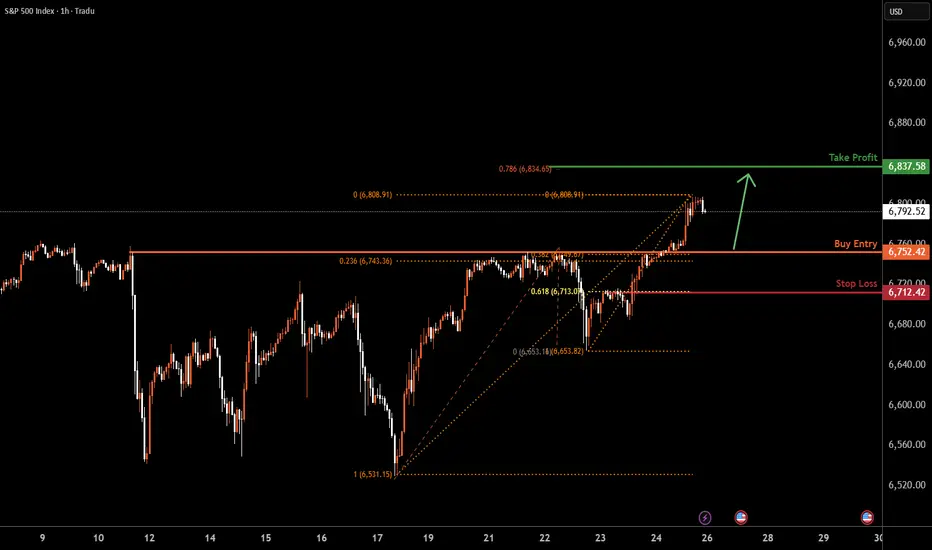
SPX500 | Price Falling Toward Key Pullback SupportS&P500 is falling towards the buy entry at 6,752.42, which is a pullback support that aligns with the 23.6% and the 38.2% Fibonacci retracement and could bounce from this level to the upside.
Stop loss is at 6,712.42, which is a pullback support that lines up with the 61.8% Fibonacci retracement.
Take profit is at 6,837.58, which aligns with the 78.6% Fibonacci projection.
Stratos Markets Limited (tradu.com ):
CFDs are complex instruments and come with a high risk of losing money rapidly due to leverage. 68% of retail investor accounts lose money when trading CFDs with this provider. You should consider whether you understand how CFDs work and whether you can afford to take the high risk of losing your money.
Stratos Europe Ltd (tradu.com ):
CFDs are complex instruments and come with a high risk of losing money rapidly due to leverage. 70% of retail investor accounts lose money when trading CFDs with this provider. You should consider whether you understand how CFDs work and whether you can afford to take the high risk of losing your money.
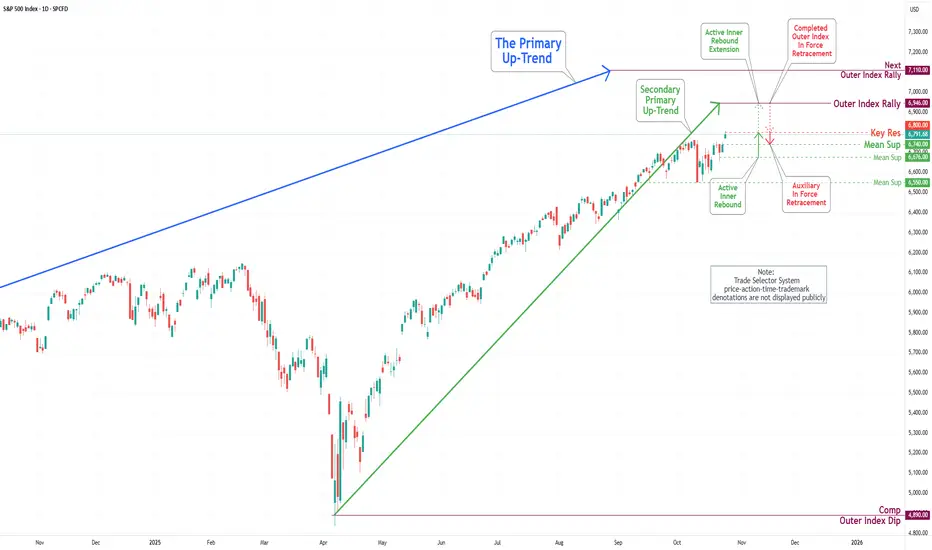
S&P 500 Daily Chart Analysis For Week of Oct 24, 2025Technical Analysis and Outlook:
The most recent trading session exhibited significant volatility in the S&P 500 Index, marked by pronounced price fluctuations between the Mean Resistance at 6671 and the Key Resistance at 6753. This range served as a crucial threshold for market participants, prompting a series of rapid buying and selling that influenced the index's overall wild movement. Ultimately, this price action culminated in a breakout above the completed Outer Index Rally at 6768.
At present, the index is situated at the newly established Key Resistance level of 6800, which lies just below the historical high of 6807. This positioning indicates the potential for further upward momentum, as the prevailing trend suggests a well-structured Active Inner Rebound extension toward the Next Outer Index Rally target of 7110.
Conversely, it is imperative to acknowledge the possibility of a sustained, steady-to-lower pullback from the Key Resistance level of 6800 to Mean Support 6740 for the Secondary Primary Up-Trend to continue on its path.
BUllish bounce off major support?DAX40 (DE40) has bounced off the pivot and could rise to the 1st resistance, which acts as a swing high resistance that aligns with the 100% Fibonacci projection.
Pivot: 24,093.96
1st Support: 23,765.54
1st Resistance: 24,675.83
Disclaimer:
The above opinions given constitute general market commentary, and do not constitute the opinion or advice of IC Markets or any form of personal or investment advice.
Any opinions, news, research, analyses, prices, other information, or links to third-party sites contained on this website are provided on an "as-is" basis, are intended only to be informative, is not an advice nor a recommendation, nor research, or a record of our trading prices, or an offer of, or solicitation for a transaction in any financial instrument and thus should not be treated as such. The information provided does not involve any specific investment objectives, financial situation and needs of any specific person who may receive it. Please be aware, that past performance is not a reliable indicator of future performance and/or results. Past Performance or Forward-looking scenarios based upon the reasonable beliefs of the third-party provider are not a guarantee of future performance. Actual results may differ materially from those anticipated in forward-looking or past performance statements. IC Markets makes no representation or warranty and assumes no liability as to the accuracy or completeness of the information provided, nor any loss arising from any investment based on a recommendation, forecast or any information supplied by any third-party.
