#INJ/USDT : Looking For Break of Structure | Bullish#INJ
The price is moving within a descending channel on the hourly timeframe. It has reached the upper boundary and is heading towards breaking it. A retest of this boundary is expected.
The Relative Strength Index (RSI) is showing an upward trend, as it has approached the upper boundary. A bearish reversal is expected.
There is a key support zone in green at 4.42. The price has bounced from this zone several times and is expected to bounce again.
A consolidation trend is observed above the 100-period moving average, which we are approaching. This trend supports a decline towards this level.
Entry Price: 4.56
Target 1: 4.68
Target 2: 4.80
Target 3: 4.97
Stop Loss: Above the green support zone.
Remember this simple thing: Money management.
For any questions, please leave a comment.
Thank you.
Inj

INJ looking for a CHOCH.. Watch list materialInjective remains in a broader downtrend after a prolonged selloff, but price is starting to stabilize near the lows. A clear CHoCH (change of character) has formed, signaling that downside momentum is slowing — though this alone does not confirm a trend reversal.
Price is holding a local support base, but continues to struggle to reclaim prior breakdown levels. Volume has cooled significantly, suggesting forced selling has largely passed and the market is now in a decision phase.
At this stage, this looks more like basing and repair than a confirmed reversal. A reclaim and hold above local range highs would be the next step toward bullish structure. Failure to hold current support would invalidate the CHoCH and keep downside risk in play.

#INJ/USDT : Looking For Break of Structure #INJ
The price is moving in a descending channel on the 1-hour timeframe. It has reached the upper limit and is heading towards breaking downwards, with a retest of the upper limit expected.
We have an upward trend on the RSI indicator, which has reached near the upper limit, and a downward reversal is expected.
There is a major resistance zone in green at 5.70. The price has bounced from this zone multiple times and is expected to bounce again.
We have a trend of consolidation above the 100-period moving average, as we are moving close to it, which supports a downward move towards touching it.
Entry price: 5.10
First target: 4.99
Second target: 4.93
Third target: 4.80
Stop loss: Above the resistance zone in green.
Don't forget a simple thing: money management.
For inquiries, please leave a comment.
Thank you.

Injective (INJ) – Spot Long Setup Amid Sector StrengthThere’s been a noticeable bounce across several gaming and Web3 tokens in the last 24 hours, and Injective (INJ) could be one of the next to follow. With broader sentiment improving and technicals stabilizing, we're watching INJ closely for a potential continuation higher in the short to medium term.
🔹 Entry Zone: $5.20–$5.45
🔹 Take Profit Targets: $7.00–$8.00 (TP1), $10.00–$12.00 (TP2)
🔹 Stop Loss: Just below $5.00
We’re currently accumulating INJ around the support range, aiming to ride a potential move higher over the coming weeks. The setup offers a clean structure with a defined invalidation and multiple reward zones, aligning well with recent sector momentum.
🔔 Always manage your risk appropriately.

INJ Breaking Out From Descending ChannelINJ has been trading inside a well-defined descending channel and is now reacting strongly from the lower boundary. Price swept the channel support near 4.18 and formed a bullish reaction from the 4.48–4.76 demand zone, aligning with the 0.618–0.786 retracement area.
The current move suggests a potential short-term trend shift. A sustained move above 5.23 would confirm strength, opening the path toward 6.18 as the first major resistance, followed by 8.99 if momentum expands. As long as price holds above the demand zone, bullish continuation remains valid.
A breakdown below 4.18 would invalidate this recovery and expose deeper downside toward 2.73.

TOP Altcoins for 2026 ~ ALTSHappy New Year 🥂
Here's a quick glance at my TOP 5 alts of choice for 2026, and why.
💭Injective (INJ)
Fast, interoperable DeFi infrastructure. Active development and a clear use-case in scaling decentralized trading.
💭Illuvium (ILV)
Prioritizes high-quality gameplay and steady development, backed by a solid revenue model.
💭Solana
ETH competitor, SOL is approaching some great buy zones that can have big bounces:
💭Origin Protocol (OGN)
Focuses on tokenized commerce and NFT marketplaces, making it easy for creators and brands to build decentralized storefronts.
💭Audius (AUDIO)
Decentralized music-streaming platform giving artists more control and growing consistently in real-world adoption.
Which alts are you watching for this year?

#INJ/USDT : Looking For Break of Structure | Bullish#INJ
The price is moving in a descending channel on the 1-hour timeframe. It has reached the lower boundary and is heading towards breaking above it, with a retest of the upper boundary expected.
We have a downtrend on the RSI indicator, which has reached near the lower boundary, and an upward rebound is expected.
There is a key support zone in green at 4.41. The price has bounced from this zone multiple times and is expected to bounce again.
We have a trend towards stability above the 100-period moving average, as we are moving close to it, which supports the upward movement.
Entry price: 4.46
First target: 4.51
Second target: 4.56
Third target: 4.63
Stop loss: Below the support zone in green.
Don't forget a simple thing: capital management.
For inquiries, please leave a comment.
Thank you.

INJ/USDT Weekly: Last Major Demand Before Macro Structure FailsINJ/USDT on the Weekly (1W) timeframe is still trading inside a large ascending channel (macro uptrend) that has been in place since 2021. However, price is currently undergoing a deep corrective phase after the previous peak and is approaching a very critical historical demand area.
Price is trading well below the channel midline, indicating medium-term bearish pressure, yet the overall macro structure remains valid as long as the lower channel boundary and the major demand zone hold.
---
Pattern Explanation
1. Ascending Channel (Macro Structure)
Upper boundary: major distribution and repeated rejections (previous ATH area).
Channel midline: equilibrium zone.
Lower boundary: long-term accumulation area.
Price is now moving toward the lower boundary, which historically acts as a strong bullish reaction zone.
2. Weekly Distribution → Breakdown
A clear distribution range formed near the top (around 40–50 USDT).
Breakdown from this range created lower highs and lower lows, signaling a medium-term bearish trend.
3. Major Demand Zone (Yellow Block 2.65 – 1.85)
This area represents the base before the previous major bullish impulse.
Confluence with:
Lower boundary of the ascending channel
Historical accumulation zone
Psychological low-price area
This zone acts as the last major support before the macro structure is invalidated.
---
Key Levels
Support
2.65 – 1.85 → Major Weekly Demand Zone (yellow block)
3.80 – 4.20 → Minor support (already broken)
Resistance
6.80 – 7.50 → Breakdown resistance
12.00 – 14.00 → Mid-channel resistance
20.00+ → Major distribution zone
---
Bullish Scenario
Price holds and reacts strongly within the 2.65 – 1.85 demand zone.
Appearance of:
Weekly rejection candles
Bullish engulfing or long lower wicks
Market structure shifts from lower low → higher low.
Bullish Targets
6.80 – 7.50
12.00 – 14.00
20.00+ (if price returns toward mid–upper channel)
Bullish Conclusion:
The 2.65 – 1.85 zone may act as a long-term accumulation area if buyers successfully defend the lower channel.
---
Bearish Scenario
A confirmed weekly close below 1.85.
Breakdown of the ascending channel lower boundary.
Macro structure shifts from uptrend to downtrend.
Bearish Implications
Potential extended capitulation phase
Price may enter:
A prolonged sideways range
Or search for a new demand zone below the current structure
Bearish Conclusion:
Losing the 1.85 level would signal macro structural failure, significantly increasing downside risk.
---
Conclusion
INJ/USDT is currently at a macro decision zone.
The 2.65 – 1.85 demand area is not just a regular support—it is the foundation of the long-term bullish structure.
Strong reaction = potential major reversal
Breakdown = macro trend shift
Waiting for weekly price action confirmation is strongly recommended.
---
#INJ #INJUSDT #CryptoAnalysis #WeeklyChart #AscendingChannel #DemandZone #SupportResistance #PriceAction #MarketStructure #AltcoinAnalysis

INJ | Testing Key Support | Oversold Swing SetupInjective (INJ) is currently holding a crucial support zone between $4.75 and $5.20 — a level that has previously acted as a strong base. On the higher time frames, the asset is deeply oversold, suggesting that a potential bounce or short-term reversal could be forming.
💡 Trade Idea (Swing Long):
Entry Zone: $4.75 – $5.20
Take Profit 1: $7.00 – $8.00
Take Profit 2: $10.00 – $12.00
Stop Loss: Just below $4.50

#INJ/USDT : Looking For Break of Structure | Bullish
#INJ
The price is moving in a descending channel on the 1-hour timeframe. It has reached the lower boundary and is heading towards breaking above it, with a retest of the upper boundary expected.
We have a downtrend on the RSI indicator, which has reached near the lower boundary, and an upward rebound is expected.
There is a key support zone in green at 4.70. The price has bounced from this zone multiple times and is expected to bounce again.
We have a trend towards stability above the 100-period moving average, as we are moving close to it, which supports the upward movement.
Entry price: 4.81
First target: 5.00
Second target: 5.23
Third target: 5.51
Don't forget a simple principle: money management.
Place your stop-loss below the support zone in green.
For any questions, please leave a comment.
Thank you.

#INJ/USDT spot plan#INJ
The price is moving in a descending channel on the 1-hour timeframe. It has reached the lower boundary and is heading towards breaking above it, with a retest of the upper boundary expected.
We have a downtrend on the RSI indicator, which has reached near the lower boundary, and an upward rebound is expected.
There is a key support zone in green at 5.46. The price has bounced from this zone multiple times and is expected to bounce again.
We have a trend towards consolidation above the 100-period moving average, as we are moving close to it, which supports the upward movement.
Entry price: 5.60
First target: 5.66
Second target: 5.76
Third target: 5.88
Don't forget a simple principle: money management.
Place your stop-loss below the green support zone.
For any questions, please leave a comment.
Thank you.

$INJ – Extremely Oversold at Key Support | Long Setup PotentialInjective CRYPTOCAP:INJ is trading at an extremely oversold level, sitting directly on major horizontal support that has historically triggered strong bullish reversals. The current zone could offer a high-risk, high-reward opportunity for a long spot position.
🟢 Trade Setup
Entry Zone: $5.50 – $6.00
Targets (TP):
• TP1: $7.00 – $8.00
• TP2: $10.25 – $12.00
• TP3: $14.00 – $16.00
Stop Loss: $5.00

NJ/USDT — Major Decision Zone: Massive Reversal or a Breakdown?INJ is currently at a critical moment within its broader market structure. The price has returned to the historical demand zone at 6.1–4.9, an area that previously triggered a large rally. The market’s reaction here will dictate whether INJ is preparing for a major bullish reversal, or entering a continuation of the bearish trend toward lower levels.
The current formation resembles a medium-term Falling Wedge, a pattern typically known for signaling a potential reversal if a breakout occurs. However, selling pressure still dominates, with a persistent sequence of lower highs kept in check by the descending upper trendline.
One of the most interesting elements on this chart is the long wick sweeping below support, indicating liquidity grabbing — many stop losses were triggered before the price was pulled back up. This is often an early sign that the market may be preparing to move in the opposite direction, but only if bullish confirmation follows.
Without a breakout, the structure remains firmly under bearish control.
In short:
➡️ INJ is standing at its biggest decision point for the coming weeks.
---
Bullish Scenario — “High-Potential Reversal from the Golden Zone”
Bullish Triggers
A strong bounce from 6.1–4.9 with a solid 4D bullish candle.
A clear breakout above the wedge’s upper trendline.
Increasing buy volume accompanying the breakout.
Bullish divergence appearing on momentum indicators (RSI/MACD).
Bullish Targets (Tiered & Based on the Chart)
1. 9.3 USDT → first resistance and early bullish validation.
2. 15 USDT → medium-term resistance to test trend strength.
3. 32 USDT → major target if a mid-term uptrend forms.
4. 51.5 USDT → long-term major supply for a super-bullish scenario.
Bullish Narrative
If INJ successfully breaks out of this wedge, the structure will strongly resemble a classic reversal pattern, often marking the beginning of a significant impulsive move.
---
Bearish Scenario — “Support Break Leads to Trend Continuation”
Bearish Triggers
A 4D candle closing below 4.9, breaking the demand zone.
No strong buying reaction on the retest of the broken support.
Increasing sell volume during the breakdown.
Bearish Targets (Tiered)
1. 3.0 USDT → psychological level & previous structural zone.
2. 1.12 USDT → extreme downside target if the long-term structure collapses.
Bearish Narrative
If the 6.1–4.9 zone fails to hold, the bearish momentum that has been building since early 2024 is likely to continue, and the wedge structure turns into a medium-term bearish channel.
---
Pattern Explanation
The chart currently forms a Falling Wedge (traditionally bullish).
But until a breakout occurs, the pattern remains controlled by sellers.
The 6.1–4.9 yellow zone acts as the key demand block — the buyers’ last major line of defense.
The long lower wick indicates a liquidity sweep, often preceding a trend shift.
The descending upper trendline has rejected every attempt at recovery since 2024 — a breakout here is the most crucial signal for a bullish move.
---
#INJ #Injective #INJUSDT #CryptoAnalysis #PriceAction #CryptoChart
#SupportAndResistance #FallingWedge #CryptoBreakout
#AltcoinAnalysis #TechnicalAnalysis #MarketStructure

INJECTIVE - INJ - 1D -1W TF STRONG SUPPORT ZONE — HIGHLY UNLIKELY TO DROP BELOW THIS LEVEL
The maximum and minimum key levels are highlighted in purple and blue, respectively.
If the current falling wedge / descending triangle formation plays out, the expected target area is the red zone and due to potential slippage price could "touch' purple zone as well.

INJ Bullish Swing Setup: Higher Low Formation at Key SupportInjective (INJ) has made a strong impulsive move up, showing significant bullish strength in recent sessions. Price is now pulling back and appears to be forming a higher low, a classic swing continuation pattern in trending markets. This correction offers a potential long opportunity for traders anticipating the next leg higher.
📍 Entry Zone: $6.50 – $7.00
🎯 Take Profits:
• TP1: $8.25 – $9.00
• TP2: $10.20 – $12.00
• TP3: $14.00 – $16.00
🛡️ Stop Loss: Just below $6.40
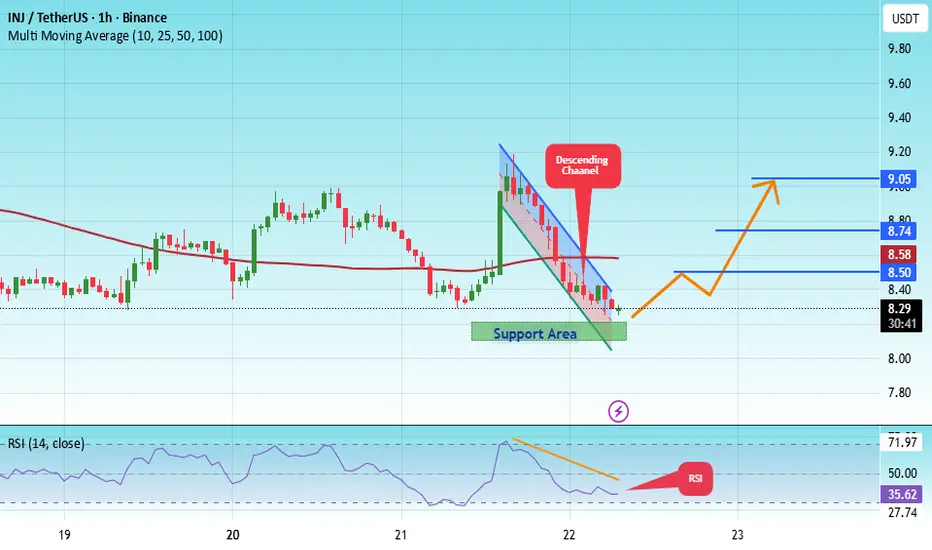
#INJ/USDT : Looking For Break of Structure | Bullish#INJ
The price is moving within a descending channel on the 1-hour frame, adhering well to it, and is heading for a strong breakout and retest.
We have a bearish trend on the RSI indicator that is about to be broken and retested, which supports the upward breakout.
There is a major support area in green at 8.15, representing a strong support point.
We are heading for consolidation above the 100 Moving Average.
Entry price: 8.30
First target: 8.50
Second target: 8.74
Third target: 9.05
Don't forget a simple matter: capital management.
When you reach the first target, save some money and then change your stop-loss order to an entry order.
For inquiries, please leave a comment.
Thank you.
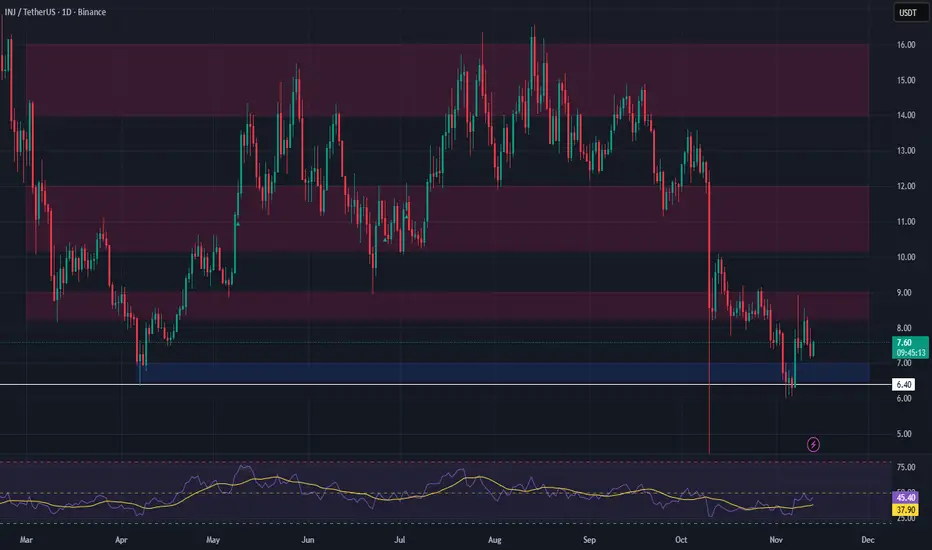
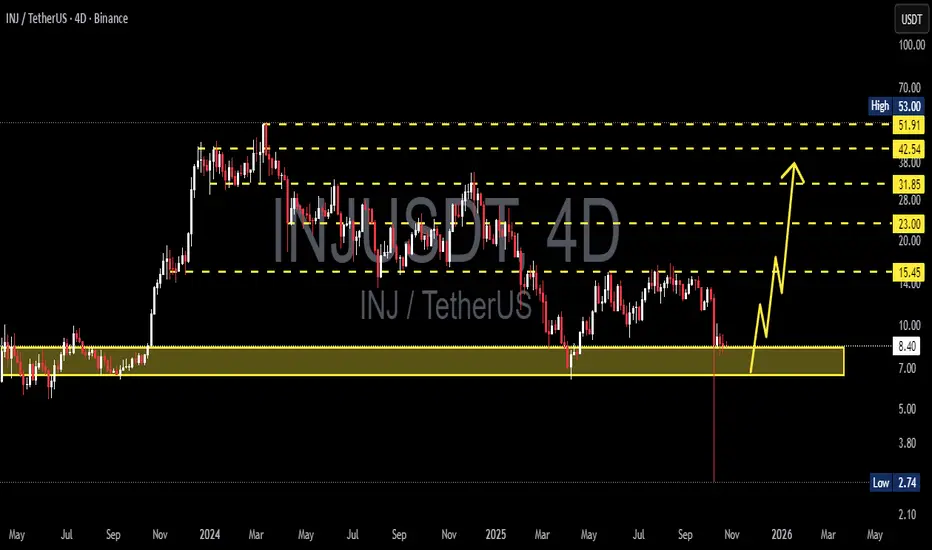
INJ/USDT — The Make-or-Break Zone: Will Injective Defend?INJ is standing at its most crucial turning point since 2023, once again testing the legendary support zone between $6.5–$8.3 — the same area that previously sparked one of its most explosive rallies all the way up to $53.
This yellow block on the chart isn’t just an ordinary support; it represents the last stronghold of the bulls — the place where the market once flipped from distribution to euphoria. Now, that fortress is being tested again under relentless bearish pressure since mid-2024.
---
📉 Technical Structure:
Primary Trend: Still in a medium-term downtrend (series of lower highs and lower lows).
Key Support Zone (Demand Area): $6.5 – $8.3
Major Resistances: $15.45 → $23.00 → $31.85 → $42.54 → $51.91
Historical Low: $2.74
A long downside wick observed earlier signals extreme liquidity events — likely the result of large-scale stop-hunting or a capitulation flush. Yet, the quick candle recovery indicates that buyers are still defending below this area.
---
📈 Bullish Scenario:
If price manages to hold above the yellow zone and prints a bullish engulfing candle on the 4D timeframe with rising volume, a strong rebound could emerge.
The first upside target would be $15.45, and if momentum builds alongside a forming higher-low structure, the market could extend toward the $23.00–$31.85 range to confirm a medium-term trend reversal.
A clean breakout and close above $23.00 would confirm a major trend reversal, potentially reopening the path to retest the higher supply zones between $42–$51.
---
📉 Bearish Scenario:
However, if INJ fails to hold above $6.5 and confirms a 4D candle close below the yellow support zone, the market could enter another distribution phase.
Downside targets would then be $3.80, followed by the historical low at $2.74, which may act as the final liquidity magnet.
A confirmed breakdown below this support would reinforce seller dominance and likely extend the ongoing downtrend into deeper price territory.
---
📊 Summary:
The yellow zone on this chart is INJ’s “make-or-break” fortress.
If it holds, the market could witness the beginning of a new accumulation phase before a potential breakout. But if this wall collapses, the chart could rewrite its story toward deeper single-digit levels.
Either way, this zone represents the highest confluence of risk and opportunity — the decisive battleground that will shape INJ’s next major trend.
---
🧭 Trading Notes:
Conservative traders: Wait for a confirmed 4D close above the yellow zone before entering long positions.
Aggressive traders: Consider scaling into positions within the zone with a stop loss below $6.5.
Short-sellers: Watch for rejections around $15.45 — a failed breakout there could offer swing short opportunities back toward the $8 region.
Risk management remains key — never let emotion override structure.
---
#INJ #Injective #INJUSDT #CryptoAnalysis #TechnicalAnalysis #PriceAction #SupportZone #SwingTrade #CryptoMarket #MarketStructure #TrendAnalysis #BullishVsBearish
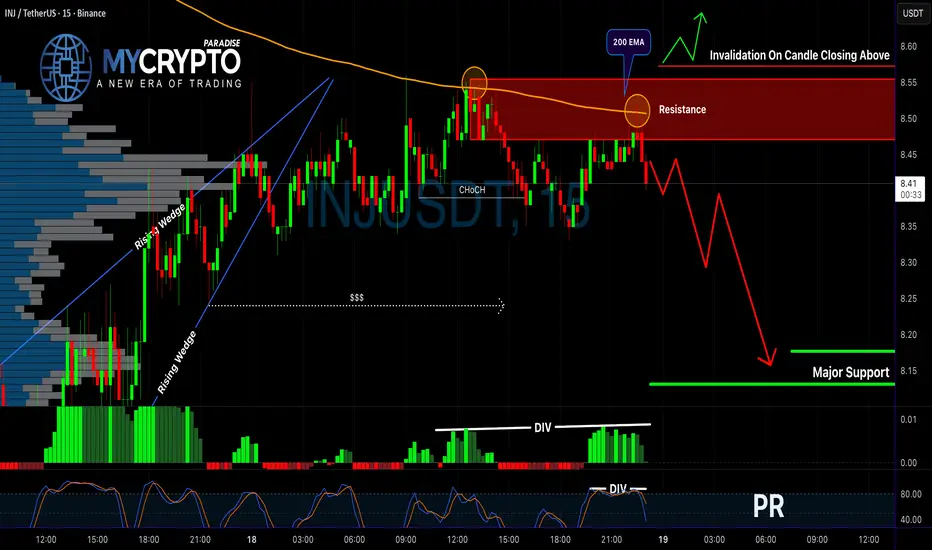
INJUSDT Just Flashed a Bearish Reversal SignalYello, Paradisers! Did you catch how INJUSDT reacted at the resistance zone? If not, you might be looking at the early signs of a deeper drop. Here's what you need to know before it's too late.
💎INJUSDT is currently flashing a clear bearish outlook as price reacts strongly from a major resistance zone. This area is further reinforced by the 200 EMA, adding technical confluence to the rejection. Most importantly, we've now seen a bearish CHoCH (Change of Character), which often marks a momentum shift from bullish to bearish. On top of that, both MACD and Stochastic RSI are showing bearish divergence—this alignment of multiple indicators significantly increases the probability of downside continuation.
💎Aggressive traders may look to enter short positions directly from current levels, aiming to capitalize on early momentum. However, for more conservative and risk-aware traders, a safer approach would be to wait for a minor pullback into the resistance area, followed by confirmation from bearish candlestick formations. This method not only improves the risk-to-reward ratio but also increases the overall probability of success by waiting for clearer market signals.
💎That said, we always account for invalidation. If the price manages to break and close decisively above the resistance zone, it would invalidate the current bearish structure. In such a scenario, standing aside and waiting for a new price structure to form would be the smarter move, rather than trying to force a trade against the new trend.
💎This is where patience and discipline truly set you apart from the herd. If you want to be consistently profitable, you must learn to wait for the highest probability opportunities—just like we do. Avoid rushing, and don’t let emotions lead your decisions.
🎖Strive for consistency, not quick profits. Treat the market as a professional business—not a gamble. That’s the only way to build long-term success in crypto. Be a PRO.
MyCryptoParadise
iFeel the success🌴
$INJ: time to refill our bags!CRYPTOCAP:INJ is now sitting in a strong demand zone — a level that has triggered massive pumps three times in the past.
There’s a major resistance line around $14 (yellow line) that CRYPTOCAP:INJ still needs to break through.
The RSI is low, the Stochastic RSI shows a bullish crossover at the bottom, and the Multi Time Frame MACD is turning bullish across all timeframes — it doesn’t get much lower than this.
Given these signals, the odds of a medium-term uptrend are very high. This could be a great opportunity to build a position for a multi-month rally.
Historically, CRYPTOCAP:INJ tends to make explosive moves followed by long consolidation periods.
If it breaks above $14, the next targets could be:
🎯 $16, $22, $27, and $32 — key resistance levels to watch.
Always keep an eye on macro and economic data, and DYOR before entering any trade.
#INJ #CryptoAnalysis #TradingSetup #Altcoins #Bullish #RSI #MACD #StochasticRSI #TechnicalAnalysis #DYOR #Breakout #CryptoMarkets

INJ Looks Bearish (8H)The INJ coin is under selling pressure, forming a bearish triangle that has recently completed. This triangle ended at the point where we placed the red arrow on the chart.
After the triangle, we expect at least three legs down to complete the minimum sub-waves of a bearish pattern.
Once Wave B is completed around this area (or slightly higher), the price may enter a bearish phase.
The target is the green line on the chart.
If a daily candle closes above the invalidation level, this analysis will be invalidated.
For risk management, please don't forget stop loss and capital management
Comment if you have any questions
Thank You

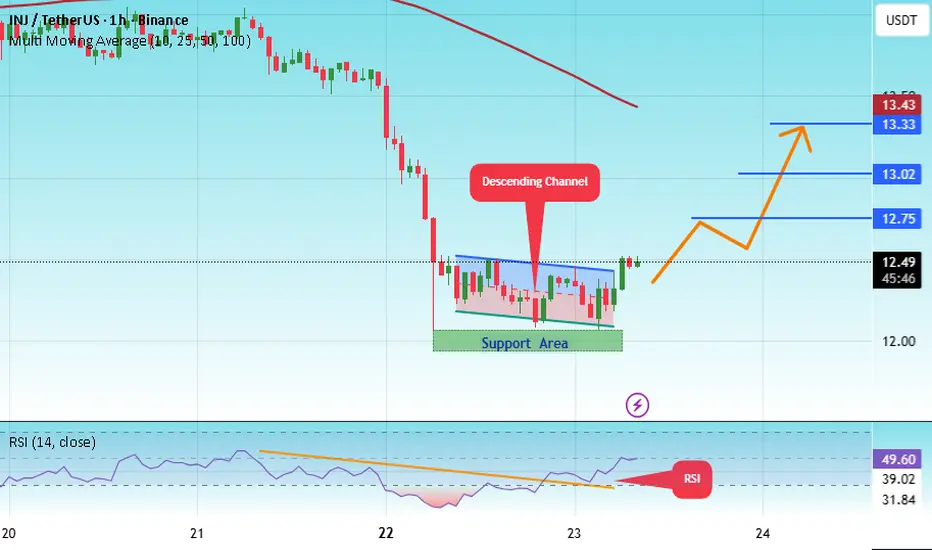
#INJ/USDT : Looking For Break of Structure | Bullish#INJ
The price is moving within a descending channel on the 1-hour frame, adhering well to it, and is heading for a strong breakout and retest.
We have a bearish trend on the RSI indicator that is about to be broken and retested, which supports the upward breakout.
There is a major support area in green at 12.00, representing a strong support point.
We are heading for consolidation above the 100 moving average.
Entry price: 12.47
First target: 12.75
Second target: 13.00
Third target: 13.33
Don't forget a simple matter: capital management.
When you reach the first target, save some money and then change your stop-loss order to an entry order.
For inquiries, please leave a comment.
Thank you.
#INJ/USDT : Looking For Break of Structure | Bullish#INJ
The price is moving within an ascending channel on the 1-hour frame, adhering well to it, and is on its way to break it strongly upwards and retest it.
We have support from the lower boundary of the ascending channel, at 13.00.
We have a downtrend on the RSI indicator that is about to break and retest, supporting the upside.
There is a major support area in green at 12.86, which represents a strong basis for the upside.
Don't forget a simple thing: ease and capital.
When you reach the first target, save some money and then change your stop-loss order to an entry order.
For inquiries, please leave a comment.
We have a trend to hold above the 100 Moving Average.
Entry price: 13.44
First target: 13.75
Second target: 14.27
Third target: 14.93
Don't forget a simple thing: ease and capital.
When you reach the first target, save some money and then change your stop-loss order to an entry order.
For inquiries, please leave a comment.
Thank you.

