#INJ/USDT : Looking For Break of Structure | Bullish#INJ
The price is moving within a descending channel on the hourly timeframe. It has reached the lower boundary and is heading towards a breakout, with a retest of the upper boundary expected.
The Relative Strength Index (RSI) is showing a downward trend, approaching the lower boundary, and an upward bounce is anticipated.
There is a key support zone in green at 2.90, and the price has bounced from this level several times. Another bounce is expected.
The indicator is showing a trend towards consolidation above the 100-period moving average, which we are approaching, supporting the upward move.
Entry Price: 3.09
First Target: 3.14
Second Target: 3.20
Third Target: 3.32
Stop Loss: Below the green support zone.
Remember this simple thing: Money management.
For any questions, please leave a comment.
Thank you.
INJBTC

INJ Price Action: Hidden Support Zone Revealed! (1D)On the INJ chart, we can clearly see a large long shadow (wick) that has been barely filled. These long shadows often act like price gaps on the chart, meaning the market tends to revisit them in the future to complete unfinished price action. This makes them very important zones for future reactions.
The price movement that filled this long shadow is highlighted with a purple ellipse on the chart. This process took more than 116 days, showing how significant and time-consuming this correction was. During this period, the market successfully hunted the liquidity at the bottom of this major long shadow, which often signals the completion of a deep accumulation or manipulation phase.
Now, if the price starts to pull back again, we expect strong support to form between the long shadow of the 12-hour candle and the larger long shadow area. This zone represents a high-probability demand area and is considered our main buying region.
This support range has strong technical importance and aligns with smart money concepts, liquidity sweeps, and unfinished price zones. If buyers defend this area, we can expect a continuation of the bullish trend.
It is important to take advantage of this opportunity in the right direction and follow proper risk management. Entering near strong support gives us a favorable risk-to-reward ratio and increases the probability of a successful trade.
The price targets and potential resistance levels are clearly marked on the chart, allowing traders to plan their entries, stop-loss levels, and take-profit zones in advance.
Always remember: patience, discipline, and confirmation are key to long-term success in trading.
If you would like us to analyze a coin or altcoin for you, first like this post, then comment the name of your altcoin below.

#INJ/USDT : Looking For Break of Structure | Bullish
#INJ
The price is moving within a descending channel on the hourly timeframe. It has reached the lower boundary and is heading towards a breakout, with a retest of the upper boundary expected.
The Relative Strength Index (RSI) is showing a downward trend, approaching the lower boundary, and an upward bounce is anticipated.
There is a key support zone in green at 3.52, and the price has bounced from this level several times. Another bounce is expected.
The indicator is showing a trend towards consolidation above the 100-period moving average, which we are approaching, supporting the upward move.
Entry Price: 3.61
First Target: 3.70
Second Target: 3.82
Third Target: 3.97
Stop Loss: Below the green support zone.
Remember this simple thing: Money management.
For any questions, please leave a comment.
Thank you.

#INJ/USDT : Looking For Break of Structure | Bullish#INJ
The price is moving within a descending channel on the hourly timeframe. It has reached the upper boundary and is heading towards breaking it. A retest of this boundary is expected.
The Relative Strength Index (RSI) is showing an upward trend, as it has approached the upper boundary. A bearish reversal is expected.
There is a key support zone in green at 4.42. The price has bounced from this zone several times and is expected to bounce again.
A consolidation trend is observed above the 100-period moving average, which we are approaching. This trend supports a decline towards this level.
Entry Price: 4.56
Target 1: 4.68
Target 2: 4.80
Target 3: 4.97
Stop Loss: Above the green support zone.
Remember this simple thing: Money management.
For any questions, please leave a comment.
Thank you.

#INJ/USDT : Looking For Break of Structure #INJ
The price is moving in a descending channel on the 1-hour timeframe. It has reached the upper limit and is heading towards breaking downwards, with a retest of the upper limit expected.
We have an upward trend on the RSI indicator, which has reached near the upper limit, and a downward reversal is expected.
There is a major resistance zone in green at 5.70. The price has bounced from this zone multiple times and is expected to bounce again.
We have a trend of consolidation above the 100-period moving average, as we are moving close to it, which supports a downward move towards touching it.
Entry price: 5.10
First target: 4.99
Second target: 4.93
Third target: 4.80
Stop loss: Above the resistance zone in green.
Don't forget a simple thing: money management.
For inquiries, please leave a comment.
Thank you.

#INJ/USDT : Looking For Break of Structure | Bullish#INJ
The price is moving in a descending channel on the 1-hour timeframe. It has reached the lower boundary and is heading towards breaking above it, with a retest of the upper boundary expected.
We have a downtrend on the RSI indicator, which has reached near the lower boundary, and an upward rebound is expected.
There is a key support zone in green at 4.41. The price has bounced from this zone multiple times and is expected to bounce again.
We have a trend towards stability above the 100-period moving average, as we are moving close to it, which supports the upward movement.
Entry price: 4.46
First target: 4.51
Second target: 4.56
Third target: 4.63
Stop loss: Below the support zone in green.
Don't forget a simple thing: capital management.
For inquiries, please leave a comment.
Thank you.

#INJ/USDT : Looking For Break of Structure | Bullish
#INJ
The price is moving in a descending channel on the 1-hour timeframe. It has reached the lower boundary and is heading towards breaking above it, with a retest of the upper boundary expected.
We have a downtrend on the RSI indicator, which has reached near the lower boundary, and an upward rebound is expected.
There is a key support zone in green at 4.70. The price has bounced from this zone multiple times and is expected to bounce again.
We have a trend towards stability above the 100-period moving average, as we are moving close to it, which supports the upward movement.
Entry price: 4.81
First target: 5.00
Second target: 5.23
Third target: 5.51
Don't forget a simple principle: money management.
Place your stop-loss below the support zone in green.
For any questions, please leave a comment.
Thank you.

#INJ/USDT spot plan#INJ
The price is moving in a descending channel on the 1-hour timeframe. It has reached the lower boundary and is heading towards breaking above it, with a retest of the upper boundary expected.
We have a downtrend on the RSI indicator, which has reached near the lower boundary, and an upward rebound is expected.
There is a key support zone in green at 5.46. The price has bounced from this zone multiple times and is expected to bounce again.
We have a trend towards consolidation above the 100-period moving average, as we are moving close to it, which supports the upward movement.
Entry price: 5.60
First target: 5.66
Second target: 5.76
Third target: 5.88
Don't forget a simple principle: money management.
Place your stop-loss below the green support zone.
For any questions, please leave a comment.
Thank you.

INJUSDT Forming Falling WedgeINJUSDT is forming a clear falling wedge pattern, a classic bullish reversal signal that often indicates an upcoming breakout in crypto trading pairs like this one. The price has been consolidating within a narrowing range after recent dips to the multi-year support zone around $6-$7, suggesting that selling pressure is weakening while buyers are beginning to regain control near key levels like $7.5-$9. With good volume confirming accumulation at these lower levels amid rising network transactions and developer activity, the setup hints at a potential bullish breakout soon, especially as Injective's DeFi innovations and cross-chain interoperability draw fresh momentum. The projected move could lead to an impressive gain of 90% to 100%+ once the price breaks above the wedge resistance, targeting zones up to $15-$16 and beyond in this altcoin price action.
This falling wedge pattern is typically seen at the end of downtrends or corrective phases, and it represents a potential shift in market sentiment from bearish to bullish for INJUSDT. Traders closely watching this crypto pair are noting the strengthening momentum as it nears a breakout zone around $9-$10, with technical indicators like RSI showing oversold bounces and fib retracement levels holding firm on the 4H and daily charts. The good trading volume adds confidence to this pattern, showing that market participants are positioning early in anticipation of a reversal, particularly with recent bounces from ascending supports and over 1.5 billion transactions signaling ecosystem growth.
Investors’ growing interest in INJUSDT reflects rising confidence in the project’s long-term fundamentals, including its layer-one blockchain for DeFi, prediction markets, and staking rewards, alongside current technical strength in this falling wedge setup. As of November 2025, trading activity spikes and institutional attention underscore real demand, making this a high-conviction opportunity for those hunting bullish reversal patterns in altcoins. If the breakout confirms with sustained volume, this could mark the start of a fresh bullish leg, with projections eyeing $14-$15 for substantial medium-term gains as buying momentum accelerates in the broader crypto recovery.
✅ Show your support by hitting the like button and ✅ Leaving a comment below! (What is You opinion about this Coin) Your feedback and engagement keep me inspired to share more insightful market analysis with you!

#INJ/USDT : Looking For Break of Structure | Bullish#INJ
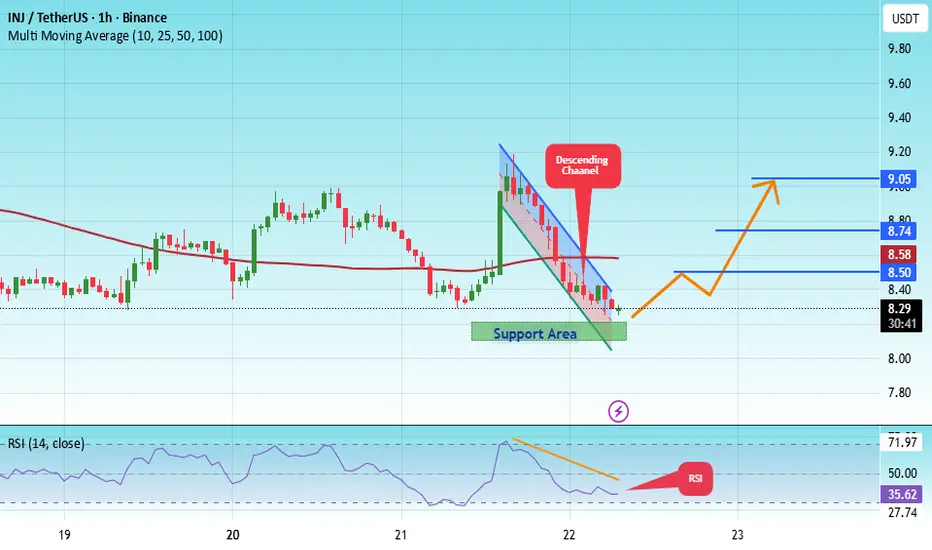
The price is moving within a descending channel on the 1-hour frame, adhering well to it, and is heading for a strong breakout and retest.
We have a bearish trend on the RSI indicator that is about to be broken and retested, which supports the upward breakout.
There is a major support area in green at 8.15, representing a strong support point.
We are heading for consolidation above the 100 Moving Average.
Entry price: 8.30
First target: 8.50
Second target: 8.74
Third target: 9.05
Don't forget a simple matter: capital management.
When you reach the first target, save some money and then change your stop-loss order to an entry order.
For inquiries, please leave a comment.
Thank you.
INJ Looks Bearish (8H)The INJ coin is under selling pressure, forming a bearish triangle that has recently completed. This triangle ended at the point where we placed the red arrow on the chart.
After the triangle, we expect at least three legs down to complete the minimum sub-waves of a bearish pattern.
Once Wave B is completed around this area (or slightly higher), the price may enter a bearish phase.
The target is the green line on the chart.
If a daily candle closes above the invalidation level, this analysis will be invalidated.
For risk management, please don't forget stop loss and capital management
Comment if you have any questions
Thank You

#INJ/USDT : Looking For Break of Structure | Bullish#INJ
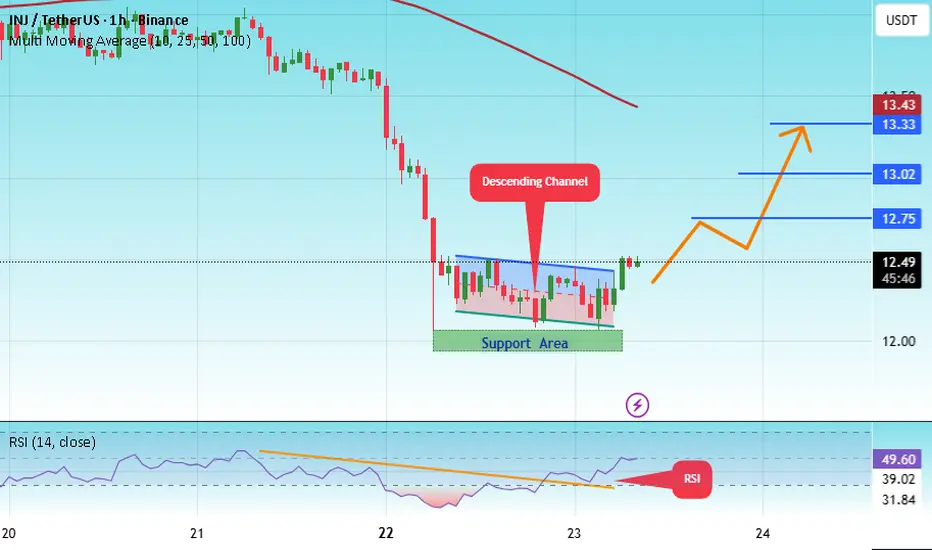
The price is moving within a descending channel on the 1-hour frame, adhering well to it, and is heading for a strong breakout and retest.
We have a bearish trend on the RSI indicator that is about to be broken and retested, which supports the upward breakout.
There is a major support area in green at 12.00, representing a strong support point.
We are heading for consolidation above the 100 moving average.
Entry price: 12.47
First target: 12.75
Second target: 13.00
Third target: 13.33
Don't forget a simple matter: capital management.
When you reach the first target, save some money and then change your stop-loss order to an entry order.
For inquiries, please leave a comment.
Thank you.
#INJ/USDT : Looking For Break of Structure | Bullish#INJ
The price is moving within an ascending channel on the 1-hour frame, adhering well to it, and is on its way to break it strongly upwards and retest it.
We have support from the lower boundary of the ascending channel, at 13.00.
We have a downtrend on the RSI indicator that is about to break and retest, supporting the upside.
There is a major support area in green at 12.86, which represents a strong basis for the upside.
Don't forget a simple thing: ease and capital.
When you reach the first target, save some money and then change your stop-loss order to an entry order.
For inquiries, please leave a comment.
We have a trend to hold above the 100 Moving Average.
Entry price: 13.44
First target: 13.75
Second target: 14.27
Third target: 14.93
Don't forget a simple thing: ease and capital.
When you reach the first target, save some money and then change your stop-loss order to an entry order.
For inquiries, please leave a comment.
Thank you.

INJ 4H Analysis - Key Triggers Ahead💀 Hey , how's it going ? Come over here — Satoshi got something for you !
⏰ We’re analyzing MKR on the 1-Day timeframe timeframe .
👀 4H timeframe on Injective (INJ) – After breaking its downtrend line, INJ moved toward the $13.41 resistance, broke through it successfully, and is now sitting just below the $14 resistance zone. A clean breakout and confirmation above $14 could open the way toward the next resistance at $16, which also acts as a strong trigger level.
⚙️ On the RSI, the key zones to watch are 50 and 70. If momentum pushes above these levels, INJ could start a new upward leg.
🕯 Green candles are showing increased size and volume. At $14, we’ve seen a cluster of sell orders triggered – profit-taking, shorts, and spot sells. Once this selling pressure is absorbed and order books clear out, INJ has a good chance to stabilize above $14, which is a very critical level to monitor.
💰 On the INJ/BTC 4H chart, the pair also broke its trendline and resistance, now waiting for confirmation above that level. Buying volume has been strong – whales are showing preference for INJ over BTC. RSI is currently around 72+, reflecting heavy trading activity and strong momentum.
📊 Looking at the Bitcoin dominance 4H chart, after losing its support at 58.36%, dominance is moving lower toward the next support at 57.81%.
🔔 In short: $14 is the key resistance for Injective. Wait for a confirmed breakout, stabilization above it, and ideally a pullback retest before entering with a reasonable risk-to-reward setup.
❤️ Disclaimer : This analysis is purely based on my personal opinion and I only trade if the stated triggers are activated .

#INJ/ (INJ): Looking For Break of Structure | Bullish#INJ
The price is moving within an ascending channel on the 1-hour frame, adhering well to it, and is on its way to break it strongly upwards and retest it.
We have support from the lower boundary of the ascending channel, at 13.00.
We have a downtrend on the RSI indicator that is about to break and retest, supporting the upside.
There is a major support area in green at 12.86, which represents a strong basis for the upside.
Don't forget a simple thing: ease and capital.
When you reach the first target, save some money and then change your stop-loss order to an entry order.
For inquiries, please leave a comment.
We have a trend to hold above the 100 Moving Average.
Entry price: 13.44
First target: 13.75
Second target: 14.27
Third target: 14.93
Don't forget a simple thing: ease and capital.
When you reach the first target, save some money and then change your stop-loss order to an entry order.
For inquiries, please leave a comment.
Thank you.

INJUSDT Descending Broadening WedgeINJUSDT is showing signs of a potential bullish breakout after rebounding from the lower boundary of a descending broadening wedge classic reversal pattern.
The price bounced from strong support around the $7.5–$9 zone, which aligns with historical buying interest. After bouncing from this key demand area, INJ has pushed higher and is now approaching a critical resistance level near $15.5. If the resistance breakout confirms, we can expect a bullish continuation towards the $25-$50. level
Cheers
Hexa

INJUSDT Forming Bullish PennantINJUSDT has recently emerged as one of the more promising crypto pairs to watch, attracting significant investor interest with strong trading volume. While no specific pattern is clearly defined on the chart right now, the market structure indicates that accumulation is happening at key support zones, hinting at a potential bullish breakout. Traders expecting an 80% to 90%+ gain see this as an opportunity to ride a strong upward trend as Injective Protocol continues to grow in the decentralized finance (DeFi) sector.
Injective Protocol (INJ) is well-known for its innovative approach to decentralized derivatives trading, offering a fully decentralized layer-2 exchange and robust DeFi ecosystem. As the crypto market shifts focus towards real utility projects, INJ stands out due to its unique value proposition and active developer community. This strong fundamental backing is one of the reasons investors are accumulating positions now before any major breakout happens.
Technically, INJUSDT is poised for a move once it clears resistance levels that have capped its price in recent months. Increasing volume suggests that traders are building positions in anticipation of a breakout, which could be fueled by positive news or broader crypto market momentum. Keep an eye on potential catalysts like protocol upgrades, partnerships, or DeFi adoption that could propel INJUSDT towards its projected gain.
✅ Show your support by hitting the like button and
✅ Leaving a comment below! (What is You opinion about this Coin)
Your feedback and engagement keep me inspired to share more insightful market analysis with you!

#INJ/USDT#INJ
The price is moving within a descending channel on the 1-hour frame and is expected to break and continue upward.
We have a trend to stabilize above the 100 moving average once again.
We have a downtrend on the RSI indicator that supports the upward move with a breakout.
We have a support area at the lower limit of the channel at 0.04263, acting as strong support from which the price can rebound.
Entry price: 10.70
First target: 11.11
Second target: 11.43
Third target: 11.86

#INJ/USDT#INJ
The price is moving within a descending channel on the 1-hour frame, adhering well to it, and is heading for a strong breakout and retest.
We are seeing a bounce from the lower boundary of the descending channel, which is support at 14.36.
We have a downtrend on the RSI indicator that is about to be broken and retested, supporting the upward trend.
We are looking for stability above the 100 Moving Average.
Entry price: 14.87
First target: 15.12
Second target: 15.57
Third target: 16.07

INJUSDT - Monthly chart telling everything!A nice bounce occurred as soon as it touched the legendary support — the primary trendline and the grey zone.
Just look at the price behavior every time it approaches this rectangle.
You'll notice that, based on the Elliott Wave Impulse, Wave 4 has likely completed, and we’re now entering the final impulsive leg — "Wave 5"
$100 is a very modest target in the long term.
Best regards Ceciliones 🎯

#INJ/USDT#INJ
The price is moving within a descending channel on the 1-hour frame, adhering well to it, and is heading for a strong breakout and retest.
We are seeing a rebound from the lower boundary of the descending channel, which is support at 9.54.
We have a downtrend on the RSI indicator that is about to be broken and retested, supporting the upward trend.
We are looking for stability above the 100 moving average.
Entry price: 10.00
First target: 10.32
Second target: 10.64
Third target: 11.00

#INJ/USDT#INJ
The price is moving within a descending channel on the 1-hour frame, adhering well to it, and is heading for a strong breakout and retest.
We are experiencing a rebound from the lower boundary of the descending channel, which is support at 7.50.
We are experiencing a downtrend on the RSI indicator that is about to break and retest, supporting the upward trend.
We are looking for stability above the 100 Moving Average.
Entry price: 7.71
First target: 7.92
Second target: 8.42
Third target: 8.90

#INJ/USDT#INJ
The price is moving within a descending channel on the 1-hour frame, adhering well to it, and is heading for a strong breakout and retest.
We are seeing a bounce from the lower boundary of the descending channel, which is support at 8.25.
We have a downtrend on the RSI indicator that is about to be broken and retested, which supports the upward trend.
We are looking for stability above the 100 Moving Average.
Entry price: 8.58
First target: 8.80
Second target: 9.03
Third target: 9.31
