#INJ/USDT : Looking For Break of Structure #INJ
The price is moving in a descending channel on the 1-hour timeframe. It has reached the upper limit and is heading towards breaking downwards, with a retest of the upper limit expected.
We have an upward trend on the RSI indicator, which has reached near the upper limit, and a downward reversal is expected.
There is a major resistance zone in green at 5.70. The price has bounced from this zone multiple times and is expected to bounce again.
We have a trend of consolidation above the 100-period moving average, as we are moving close to it, which supports a downward move towards touching it.
Entry price: 5.10
First target: 4.99
Second target: 4.93
Third target: 4.80
Stop loss: Above the resistance zone in green.
Don't forget a simple thing: money management.
For inquiries, please leave a comment.
Thank you.
INJUSD

#INJ/USDT : Looking For Break of Structure | Bullish#INJ
The price is moving in a descending channel on the 1-hour timeframe. It has reached the lower boundary and is heading towards breaking above it, with a retest of the upper boundary expected.
We have a downtrend on the RSI indicator, which has reached near the lower boundary, and an upward rebound is expected.
There is a key support zone in green at 4.41. The price has bounced from this zone multiple times and is expected to bounce again.
We have a trend towards stability above the 100-period moving average, as we are moving close to it, which supports the upward movement.
Entry price: 4.46
First target: 4.51
Second target: 4.56
Third target: 4.63
Stop loss: Below the support zone in green.
Don't forget a simple thing: capital management.
For inquiries, please leave a comment.
Thank you.

INJ/USDT Weekly: Last Major Demand Before Macro Structure FailsINJ/USDT on the Weekly (1W) timeframe is still trading inside a large ascending channel (macro uptrend) that has been in place since 2021. However, price is currently undergoing a deep corrective phase after the previous peak and is approaching a very critical historical demand area.
Price is trading well below the channel midline, indicating medium-term bearish pressure, yet the overall macro structure remains valid as long as the lower channel boundary and the major demand zone hold.
---
Pattern Explanation
1. Ascending Channel (Macro Structure)
Upper boundary: major distribution and repeated rejections (previous ATH area).
Channel midline: equilibrium zone.
Lower boundary: long-term accumulation area.
Price is now moving toward the lower boundary, which historically acts as a strong bullish reaction zone.
2. Weekly Distribution → Breakdown
A clear distribution range formed near the top (around 40–50 USDT).
Breakdown from this range created lower highs and lower lows, signaling a medium-term bearish trend.
3. Major Demand Zone (Yellow Block 2.65 – 1.85)
This area represents the base before the previous major bullish impulse.
Confluence with:
Lower boundary of the ascending channel
Historical accumulation zone
Psychological low-price area
This zone acts as the last major support before the macro structure is invalidated.
---
Key Levels
Support
2.65 – 1.85 → Major Weekly Demand Zone (yellow block)
3.80 – 4.20 → Minor support (already broken)
Resistance
6.80 – 7.50 → Breakdown resistance
12.00 – 14.00 → Mid-channel resistance
20.00+ → Major distribution zone
---
Bullish Scenario
Price holds and reacts strongly within the 2.65 – 1.85 demand zone.
Appearance of:
Weekly rejection candles
Bullish engulfing or long lower wicks
Market structure shifts from lower low → higher low.
Bullish Targets
6.80 – 7.50
12.00 – 14.00
20.00+ (if price returns toward mid–upper channel)
Bullish Conclusion:
The 2.65 – 1.85 zone may act as a long-term accumulation area if buyers successfully defend the lower channel.
---
Bearish Scenario
A confirmed weekly close below 1.85.
Breakdown of the ascending channel lower boundary.
Macro structure shifts from uptrend to downtrend.
Bearish Implications
Potential extended capitulation phase
Price may enter:
A prolonged sideways range
Or search for a new demand zone below the current structure
Bearish Conclusion:
Losing the 1.85 level would signal macro structural failure, significantly increasing downside risk.
---
Conclusion
INJ/USDT is currently at a macro decision zone.
The 2.65 – 1.85 demand area is not just a regular support—it is the foundation of the long-term bullish structure.
Strong reaction = potential major reversal
Breakdown = macro trend shift
Waiting for weekly price action confirmation is strongly recommended.
---
#INJ #INJUSDT #CryptoAnalysis #WeeklyChart #AscendingChannel #DemandZone #SupportResistance #PriceAction #MarketStructure #AltcoinAnalysis

#INJ/USDT : Looking For Break of Structure | Bullish
#INJ
The price is moving in a descending channel on the 1-hour timeframe. It has reached the lower boundary and is heading towards breaking above it, with a retest of the upper boundary expected.
We have a downtrend on the RSI indicator, which has reached near the lower boundary, and an upward rebound is expected.
There is a key support zone in green at 4.70. The price has bounced from this zone multiple times and is expected to bounce again.
We have a trend towards stability above the 100-period moving average, as we are moving close to it, which supports the upward movement.
Entry price: 4.81
First target: 5.00
Second target: 5.23
Third target: 5.51
Don't forget a simple principle: money management.
Place your stop-loss below the support zone in green.
For any questions, please leave a comment.
Thank you.

#INJ/USDT spot plan#INJ
The price is moving in a descending channel on the 1-hour timeframe. It has reached the lower boundary and is heading towards breaking above it, with a retest of the upper boundary expected.
We have a downtrend on the RSI indicator, which has reached near the lower boundary, and an upward rebound is expected.
There is a key support zone in green at 5.46. The price has bounced from this zone multiple times and is expected to bounce again.
We have a trend towards consolidation above the 100-period moving average, as we are moving close to it, which supports the upward movement.
Entry price: 5.60
First target: 5.66
Second target: 5.76
Third target: 5.88
Don't forget a simple principle: money management.
Place your stop-loss below the green support zone.
For any questions, please leave a comment.
Thank you.

NJ/USDT — Major Decision Zone: Massive Reversal or a Breakdown?INJ is currently at a critical moment within its broader market structure. The price has returned to the historical demand zone at 6.1–4.9, an area that previously triggered a large rally. The market’s reaction here will dictate whether INJ is preparing for a major bullish reversal, or entering a continuation of the bearish trend toward lower levels.
The current formation resembles a medium-term Falling Wedge, a pattern typically known for signaling a potential reversal if a breakout occurs. However, selling pressure still dominates, with a persistent sequence of lower highs kept in check by the descending upper trendline.
One of the most interesting elements on this chart is the long wick sweeping below support, indicating liquidity grabbing — many stop losses were triggered before the price was pulled back up. This is often an early sign that the market may be preparing to move in the opposite direction, but only if bullish confirmation follows.
Without a breakout, the structure remains firmly under bearish control.
In short:
➡️ INJ is standing at its biggest decision point for the coming weeks.
---
Bullish Scenario — “High-Potential Reversal from the Golden Zone”
Bullish Triggers
A strong bounce from 6.1–4.9 with a solid 4D bullish candle.
A clear breakout above the wedge’s upper trendline.
Increasing buy volume accompanying the breakout.
Bullish divergence appearing on momentum indicators (RSI/MACD).
Bullish Targets (Tiered & Based on the Chart)
1. 9.3 USDT → first resistance and early bullish validation.
2. 15 USDT → medium-term resistance to test trend strength.
3. 32 USDT → major target if a mid-term uptrend forms.
4. 51.5 USDT → long-term major supply for a super-bullish scenario.
Bullish Narrative
If INJ successfully breaks out of this wedge, the structure will strongly resemble a classic reversal pattern, often marking the beginning of a significant impulsive move.
---
Bearish Scenario — “Support Break Leads to Trend Continuation”
Bearish Triggers
A 4D candle closing below 4.9, breaking the demand zone.
No strong buying reaction on the retest of the broken support.
Increasing sell volume during the breakdown.
Bearish Targets (Tiered)
1. 3.0 USDT → psychological level & previous structural zone.
2. 1.12 USDT → extreme downside target if the long-term structure collapses.
Bearish Narrative
If the 6.1–4.9 zone fails to hold, the bearish momentum that has been building since early 2024 is likely to continue, and the wedge structure turns into a medium-term bearish channel.
---
Pattern Explanation
The chart currently forms a Falling Wedge (traditionally bullish).
But until a breakout occurs, the pattern remains controlled by sellers.
The 6.1–4.9 yellow zone acts as the key demand block — the buyers’ last major line of defense.
The long lower wick indicates a liquidity sweep, often preceding a trend shift.
The descending upper trendline has rejected every attempt at recovery since 2024 — a breakout here is the most crucial signal for a bullish move.
---
#INJ #Injective #INJUSDT #CryptoAnalysis #PriceAction #CryptoChart
#SupportAndResistance #FallingWedge #CryptoBreakout
#AltcoinAnalysis #TechnicalAnalysis #MarketStructure

INJECTIVE - INJ - 1D -1W TF STRONG SUPPORT ZONE — HIGHLY UNLIKELY TO DROP BELOW THIS LEVEL
The maximum and minimum key levels are highlighted in purple and blue, respectively.
If the current falling wedge / descending triangle formation plays out, the expected target area is the red zone and due to potential slippage price could "touch' purple zone as well.

#INJ/USDT : Looking For Break of Structure | Bullish#INJ
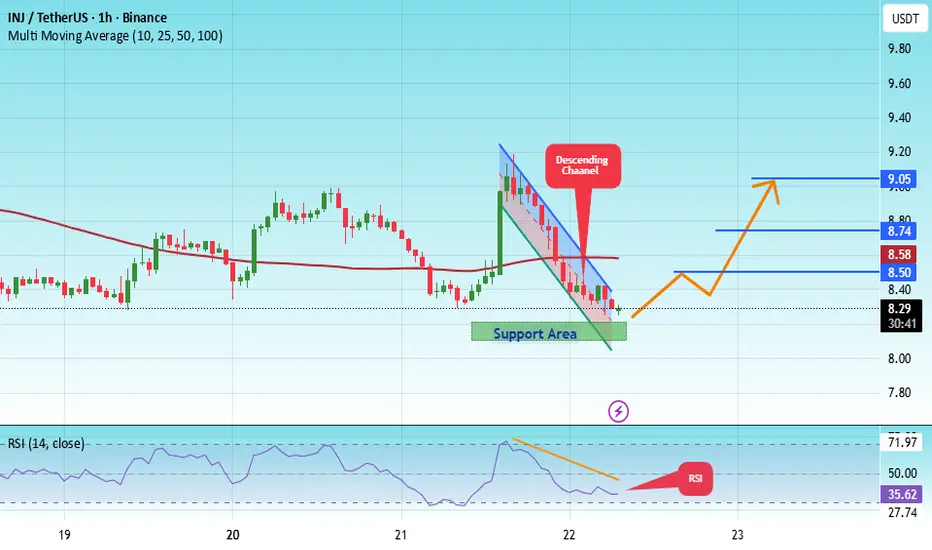
The price is moving within a descending channel on the 1-hour frame, adhering well to it, and is heading for a strong breakout and retest.
We have a bearish trend on the RSI indicator that is about to be broken and retested, which supports the upward breakout.
There is a major support area in green at 8.15, representing a strong support point.
We are heading for consolidation above the 100 Moving Average.
Entry price: 8.30
First target: 8.50
Second target: 8.74
Third target: 9.05
Don't forget a simple matter: capital management.
When you reach the first target, save some money and then change your stop-loss order to an entry order.
For inquiries, please leave a comment.
Thank you.
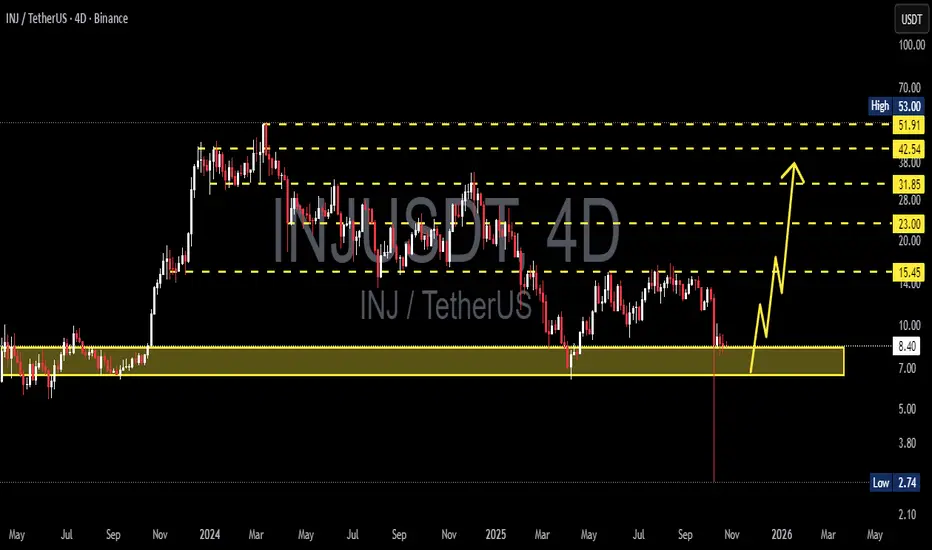
INJ/USDT — The Make-or-Break Zone: Will Injective Defend?INJ is standing at its most crucial turning point since 2023, once again testing the legendary support zone between $6.5–$8.3 — the same area that previously sparked one of its most explosive rallies all the way up to $53.
This yellow block on the chart isn’t just an ordinary support; it represents the last stronghold of the bulls — the place where the market once flipped from distribution to euphoria. Now, that fortress is being tested again under relentless bearish pressure since mid-2024.
---
📉 Technical Structure:
Primary Trend: Still in a medium-term downtrend (series of lower highs and lower lows).
Key Support Zone (Demand Area): $6.5 – $8.3
Major Resistances: $15.45 → $23.00 → $31.85 → $42.54 → $51.91
Historical Low: $2.74
A long downside wick observed earlier signals extreme liquidity events — likely the result of large-scale stop-hunting or a capitulation flush. Yet, the quick candle recovery indicates that buyers are still defending below this area.
---
📈 Bullish Scenario:
If price manages to hold above the yellow zone and prints a bullish engulfing candle on the 4D timeframe with rising volume, a strong rebound could emerge.
The first upside target would be $15.45, and if momentum builds alongside a forming higher-low structure, the market could extend toward the $23.00–$31.85 range to confirm a medium-term trend reversal.
A clean breakout and close above $23.00 would confirm a major trend reversal, potentially reopening the path to retest the higher supply zones between $42–$51.
---
📉 Bearish Scenario:
However, if INJ fails to hold above $6.5 and confirms a 4D candle close below the yellow support zone, the market could enter another distribution phase.
Downside targets would then be $3.80, followed by the historical low at $2.74, which may act as the final liquidity magnet.
A confirmed breakdown below this support would reinforce seller dominance and likely extend the ongoing downtrend into deeper price territory.
---
📊 Summary:
The yellow zone on this chart is INJ’s “make-or-break” fortress.
If it holds, the market could witness the beginning of a new accumulation phase before a potential breakout. But if this wall collapses, the chart could rewrite its story toward deeper single-digit levels.
Either way, this zone represents the highest confluence of risk and opportunity — the decisive battleground that will shape INJ’s next major trend.
---
🧭 Trading Notes:
Conservative traders: Wait for a confirmed 4D close above the yellow zone before entering long positions.
Aggressive traders: Consider scaling into positions within the zone with a stop loss below $6.5.
Short-sellers: Watch for rejections around $15.45 — a failed breakout there could offer swing short opportunities back toward the $8 region.
Risk management remains key — never let emotion override structure.
---
#INJ #Injective #INJUSDT #CryptoAnalysis #TechnicalAnalysis #PriceAction #SupportZone #SwingTrade #CryptoMarket #MarketStructure #TrendAnalysis #BullishVsBearish
$INJ: time to refill our bags!CRYPTOCAP:INJ is now sitting in a strong demand zone — a level that has triggered massive pumps three times in the past.
There’s a major resistance line around $14 (yellow line) that CRYPTOCAP:INJ still needs to break through.
The RSI is low, the Stochastic RSI shows a bullish crossover at the bottom, and the Multi Time Frame MACD is turning bullish across all timeframes — it doesn’t get much lower than this.
Given these signals, the odds of a medium-term uptrend are very high. This could be a great opportunity to build a position for a multi-month rally.
Historically, CRYPTOCAP:INJ tends to make explosive moves followed by long consolidation periods.
If it breaks above $14, the next targets could be:
🎯 $16, $22, $27, and $32 — key resistance levels to watch.
Always keep an eye on macro and economic data, and DYOR before entering any trade.
#INJ #CryptoAnalysis #TradingSetup #Altcoins #Bullish #RSI #MACD #StochasticRSI #TechnicalAnalysis #DYOR #Breakout #CryptoMarkets

INJ Looks Bearish (8H)The INJ coin is under selling pressure, forming a bearish triangle that has recently completed. This triangle ended at the point where we placed the red arrow on the chart.
After the triangle, we expect at least three legs down to complete the minimum sub-waves of a bearish pattern.
Once Wave B is completed around this area (or slightly higher), the price may enter a bearish phase.
The target is the green line on the chart.
If a daily candle closes above the invalidation level, this analysis will be invalidated.
For risk management, please don't forget stop loss and capital management
Comment if you have any questions
Thank You

#INJ/USDT : Looking For Break of Structure | Bullish#INJ
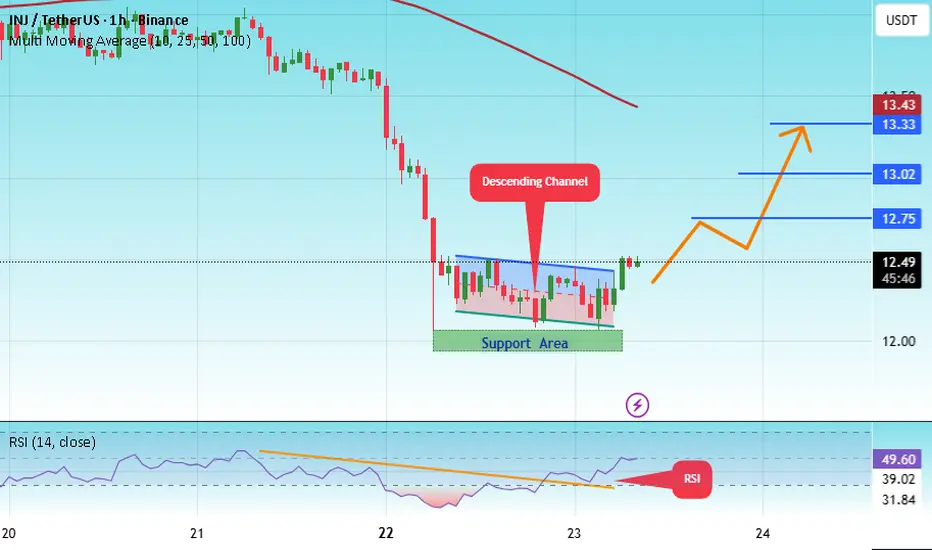
The price is moving within a descending channel on the 1-hour frame, adhering well to it, and is heading for a strong breakout and retest.
We have a bearish trend on the RSI indicator that is about to be broken and retested, which supports the upward breakout.
There is a major support area in green at 12.00, representing a strong support point.
We are heading for consolidation above the 100 moving average.
Entry price: 12.47
First target: 12.75
Second target: 13.00
Third target: 13.33
Don't forget a simple matter: capital management.
When you reach the first target, save some money and then change your stop-loss order to an entry order.
For inquiries, please leave a comment.
Thank you.
$INJ \ Injective Similar to the previous channel structure, will initiate a potential structural breakout parabolic run toward the upper band of the second descending channel.

#INJ/USDT : Looking For Break of Structure | Bullish#INJ
The price is moving within an ascending channel on the 1-hour frame, adhering well to it, and is on its way to break it strongly upwards and retest it.
We have support from the lower boundary of the ascending channel, at 13.00.
We have a downtrend on the RSI indicator that is about to break and retest, supporting the upside.
There is a major support area in green at 12.86, which represents a strong basis for the upside.
Don't forget a simple thing: ease and capital.
When you reach the first target, save some money and then change your stop-loss order to an entry order.
For inquiries, please leave a comment.
We have a trend to hold above the 100 Moving Average.
Entry price: 13.44
First target: 13.75
Second target: 14.27
Third target: 14.93
Don't forget a simple thing: ease and capital.
When you reach the first target, save some money and then change your stop-loss order to an entry order.
For inquiries, please leave a comment.
Thank you.

INJUSD Rising Wedge going for a new High.Injective (INJUSD) has been trading within a Rising Wedge pattern since the March 02 High. Right now it broke above its 1D MA50 (blue trend-line) again, following a September 01 Higher Low on the pattern's bottom.
This is technically the start of its new Bullish Leg and given the fact that both previous two peaked on their 1.136 Fibonacci extensions, we set now a medium-term Target of 17.150.
-------------------------------------------------------------------------------
** Please LIKE 👍, FOLLOW ✅, SHARE 🙌 and COMMENT ✍ if you enjoy this idea! Also share your ideas and charts in the comments section below! This is best way to keep it relevant, support us, keep the content here free and allow the idea to reach as many people as possible. **
-------------------------------------------------------------------------------
💸💸💸💸💸💸
👇 👇 👇 👇 👇 👇

$INJ: presenting an opportunity to accumulate at a discount.After forming a triple top, CRYPTOCAP:INJ is now developing an “M” pattern.
This formation is generally bearish, suggesting that price may retrace into the green buy zone. Since this is unfolding on the daily timeframe, it could take several weeks before we see a potential bottom. Patience is key—the lower it goes, the better the entry.
Once the “M” formation completes, the next major step will be breaking above the yellow descending resistance line. A successful breakout there could open the way for clear skies and a full recovery toward (and above) the $16 level.
📉 A strong entry point would be when the RSI dips into oversold territory within the green zone.
⚠️ Always DYOR (Do Your Own Research).

INJ 4H Analysis - Key Triggers Ahead💀 Hey , how's it going ? Come over here — Satoshi got something for you !
⏰ We’re analyzing MKR on the 1-Day timeframe timeframe .
👀 4H timeframe on Injective (INJ) – After breaking its downtrend line, INJ moved toward the $13.41 resistance, broke through it successfully, and is now sitting just below the $14 resistance zone. A clean breakout and confirmation above $14 could open the way toward the next resistance at $16, which also acts as a strong trigger level.
⚙️ On the RSI, the key zones to watch are 50 and 70. If momentum pushes above these levels, INJ could start a new upward leg.
🕯 Green candles are showing increased size and volume. At $14, we’ve seen a cluster of sell orders triggered – profit-taking, shorts, and spot sells. Once this selling pressure is absorbed and order books clear out, INJ has a good chance to stabilize above $14, which is a very critical level to monitor.
💰 On the INJ/BTC 4H chart, the pair also broke its trendline and resistance, now waiting for confirmation above that level. Buying volume has been strong – whales are showing preference for INJ over BTC. RSI is currently around 72+, reflecting heavy trading activity and strong momentum.
📊 Looking at the Bitcoin dominance 4H chart, after losing its support at 58.36%, dominance is moving lower toward the next support at 57.81%.
🔔 In short: $14 is the key resistance for Injective. Wait for a confirmed breakout, stabilization above it, and ideally a pullback retest before entering with a reasonable risk-to-reward setup.
❤️ Disclaimer : This analysis is purely based on my personal opinion and I only trade if the stated triggers are activated .

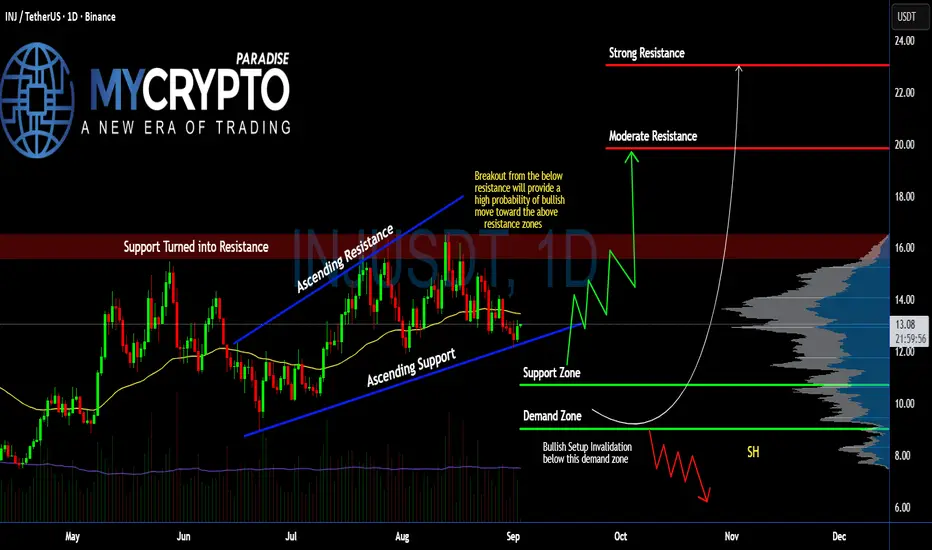
Is #INJ Ready for a Pullback or Bears will Drag it Down? Yello, Paradisers! Is #Injective gearing up for a major breakout, or is this the final shakeout before the next big trap? Let’s uncover what’s unfolding on #INJUSDT:
💎After forming a well-defined ascending channel, #INJ has been closely respecting both the ascending resistance and ascending support levels since early July. Currently, price is hovering just above the ascending trendline support, suggesting that buyers are still holding the line around the $12.80–$13 area.
💎We’re watching two major zones here: Support Zone around $10.72 and Demand Zone between $9.05–$10.72. As long as #INJ stays above this demand zone, the bullish case remains intact. A bounce from here could trigger a retest of the previous support-turned-resistance around $15.80–$16, which is now acting as a supply block.
💎If price manages to reclaim that zone with volume confirmation, we could see a move toward moderate resistance at $19.84. Beyond that, the next high-probability target stands at $23.03, which aligns with the strong resistance level marked on the volume profile. This would be a critical psychological zone for profit-taking and could trigger increased volatility.
💎However, if bulls lose the battle and #INJUSD closes below $9.05, the entire bullish structure will be invalidated. This would likely lead to a drop back toward the $7–$8 range, especially with weak volume participation. That’s where late longs might get completely wiped out, so risk management becomes key in this zone.
Stay patient, Paradisers. Let the breakout confirm, and only then do we strike with conviction.
MyCryptoParadise
iFeel the success🌴
#INJ/ (INJ): Looking For Break of Structure | Bullish#INJ
The price is moving within an ascending channel on the 1-hour frame, adhering well to it, and is on its way to break it strongly upwards and retest it.
We have support from the lower boundary of the ascending channel, at 13.00.
We have a downtrend on the RSI indicator that is about to break and retest, supporting the upside.
There is a major support area in green at 12.86, which represents a strong basis for the upside.
Don't forget a simple thing: ease and capital.
When you reach the first target, save some money and then change your stop-loss order to an entry order.
For inquiries, please leave a comment.
We have a trend to hold above the 100 Moving Average.
Entry price: 13.44
First target: 13.75
Second target: 14.27
Third target: 14.93
Don't forget a simple thing: ease and capital.
When you reach the first target, save some money and then change your stop-loss order to an entry order.
For inquiries, please leave a comment.
Thank you.

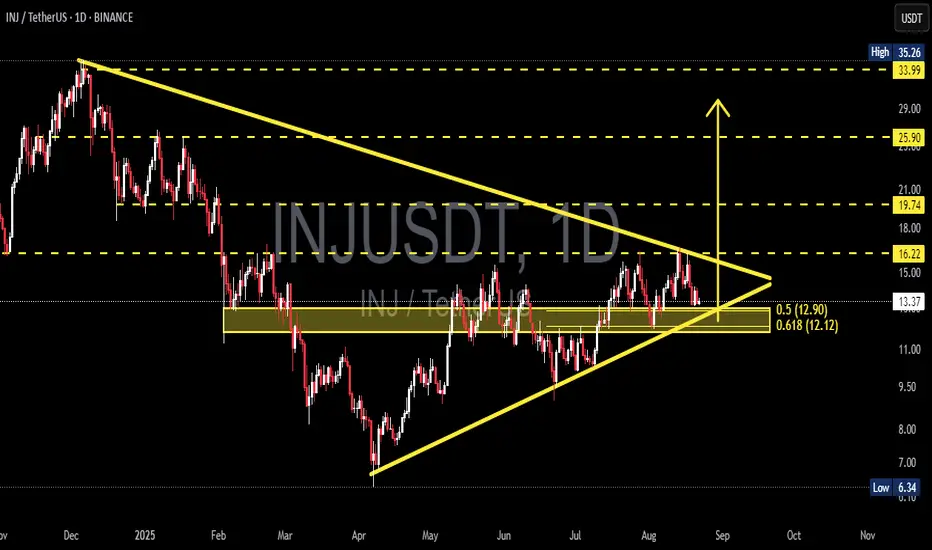
INJ/USDT – Symmetrical Triangle Approaching Major Breakout?Full Analysis:
INJ/USDT is currently consolidating within a daily symmetrical triangle pattern, where lower highs (seller pressure) meet higher lows (buyer defense). This pattern usually signals a phase of compression before a strong directional breakout, typically occurring as price approaches the apex of the triangle.
Right now, price sits around 13.35, testing a critical demand zone that overlaps with the 0.5–0.618 Fibonacci retracement (12.90–12.12). This makes the zone a make-or-break area: holding above could fuel a bullish breakout, while a breakdown would likely trigger further bearish momentum.
---
🔼 Bullish Scenario
Trigger: A daily close above the triangle’s upper trendline (~15.0), followed by a confirmed breakout above 16.22.
Additional Confirmation: Increasing volume during breakout.
Upside Targets:
🎯 T1: 16.22 → confirmation of breakout.
🎯 T2: 19.74 (key historical resistance).
🎯 T3: 25.90 (next major resistance).
🎯 T4: 33.99–35.26 (previous high & ultimate bullish objective).
Invalidation: Failure to hold above 16.22 after breakout and a return back inside the triangle.
---
🔽 Bearish Scenario
Trigger: A daily close below the ascending trendline and the 12.90–12.12 demand zone.
Additional Confirmation: Strong selling volume and clear rejection candles below the zone.
Downside Targets:
⚠️ T1: 9.50 (psychological support & measured move projection).
⚠️ T2: 6.34 (major historical low).
Invalidation: Quick recovery and reclaim above 12.9–13.5.
---
📐 Pattern & Technical Logic
Symmetrical Triangle → Neutral structure, representing market indecision before a strong move.
Measured Move Projection → Height of the triangle (~3–4 points) projected from the breakout point → aligns with ~19.7 to the upside or ~9.5 to the downside.
Golden Fibonacci Zone (0.5–0.618 / 12.90–12.12) → Often acts as the last stronghold for buyers in a mid-term structure.
---
📝 Key Insight
If INJ manages to break and sustain above 16.22 with strong volume, it could trigger a major bullish continuation toward higher targets.
Conversely, a decisive breakdown below 12.12 would confirm bearish momentum, opening the door for a deeper retracement toward 9.50 and 6.34.
With volatility squeezing near the apex, a large directional move is very likely in the coming weeks.
---
🎯 Conclusion
INJ is approaching a critical decision point:
Above 16.22 = bullish breakout with significant upside potential.
Below 12.12 = bearish breakdown with deeper correction ahead.
Traders should wait for a confirmed daily breakout before committing to a direction. Whichever side wins, the risk/reward opportunity is substantial.
#INJ #INJUSDT #CryptoAnalysis #SymmetricalTriangle #ChartPattern #PriceAction #Breakout #SupportResistance #Fibonacci #Altcoins #CryptoTrading
Long-Term Spot Technical Analysis of INJ CoinWhen evaluating INJ coin for long-term spot investments, it is evident that the price continues its downward movement after being rejected from the daily resistance level at $16.33. If INJ fails to receive a strong buying reaction from the $13.16 support in the coming days, the downtrend is likely to persist.
Our preferred long-term spot entry zone lies between the $11.86 – $11.26 support range. If INJ retraces to the blue support zone marked on the chart, we intend to accumulate with a long-term target of $23.
As long as INJ continues to close daily candles above the $10 level, we will maintain our long-term spot positions. Should the price rebound from the $11.86 – $11.26 zone, our initial upside target will be $16.33.
Not Financial Advice (NFA).

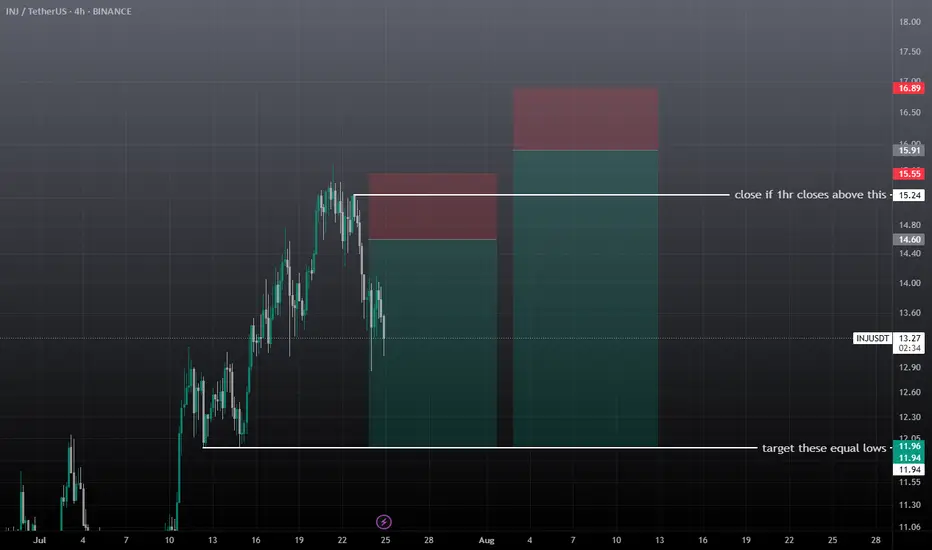
inj swing short setupWait for the entry, don't take it at current market price, entry can take time. There are two short setups forming on injusdt, after achieving the first entry if 1hr closes above the mentioned zone then close trade before sl, and then take the 2nd short setup, if tp achieves first then don't take the trade wait for the new setup.
INJUSDT Descending Broadening WedgeINJUSDT is showing signs of a potential bullish breakout after rebounding from the lower boundary of a descending broadening wedge classic reversal pattern.
The price bounced from strong support around the $7.5–$9 zone, which aligns with historical buying interest. After bouncing from this key demand area, INJ has pushed higher and is now approaching a critical resistance level near $15.5. If the resistance breakout confirms, we can expect a bullish continuation towards the $25-$50. level
Cheers
Hexa
