INJ/USDT Weekly: Last Major Demand Before Macro Structure FailsINJ/USDT on the Weekly (1W) timeframe is still trading inside a large ascending channel (macro uptrend) that has been in place since 2021. However, price is currently undergoing a deep corrective phase after the previous peak and is approaching a very critical historical demand area.
Price is trading well below the channel midline, indicating medium-term bearish pressure, yet the overall macro structure remains valid as long as the lower channel boundary and the major demand zone hold.
---
Pattern Explanation
1. Ascending Channel (Macro Structure)
Upper boundary: major distribution and repeated rejections (previous ATH area).
Channel midline: equilibrium zone.
Lower boundary: long-term accumulation area.
Price is now moving toward the lower boundary, which historically acts as a strong bullish reaction zone.
2. Weekly Distribution → Breakdown
A clear distribution range formed near the top (around 40–50 USDT).
Breakdown from this range created lower highs and lower lows, signaling a medium-term bearish trend.
3. Major Demand Zone (Yellow Block 2.65 – 1.85)
This area represents the base before the previous major bullish impulse.
Confluence with:
Lower boundary of the ascending channel
Historical accumulation zone
Psychological low-price area
This zone acts as the last major support before the macro structure is invalidated.
---
Key Levels
Support
2.65 – 1.85 → Major Weekly Demand Zone (yellow block)
3.80 – 4.20 → Minor support (already broken)
Resistance
6.80 – 7.50 → Breakdown resistance
12.00 – 14.00 → Mid-channel resistance
20.00+ → Major distribution zone
---
Bullish Scenario
Price holds and reacts strongly within the 2.65 – 1.85 demand zone.
Appearance of:
Weekly rejection candles
Bullish engulfing or long lower wicks
Market structure shifts from lower low → higher low.
Bullish Targets
6.80 – 7.50
12.00 – 14.00
20.00+ (if price returns toward mid–upper channel)
Bullish Conclusion:
The 2.65 – 1.85 zone may act as a long-term accumulation area if buyers successfully defend the lower channel.
---
Bearish Scenario
A confirmed weekly close below 1.85.
Breakdown of the ascending channel lower boundary.
Macro structure shifts from uptrend to downtrend.
Bearish Implications
Potential extended capitulation phase
Price may enter:
A prolonged sideways range
Or search for a new demand zone below the current structure
Bearish Conclusion:
Losing the 1.85 level would signal macro structural failure, significantly increasing downside risk.
---
Conclusion
INJ/USDT is currently at a macro decision zone.
The 2.65 – 1.85 demand area is not just a regular support—it is the foundation of the long-term bullish structure.
Strong reaction = potential major reversal
Breakdown = macro trend shift
Waiting for weekly price action confirmation is strongly recommended.
---
#INJ #INJUSDT #CryptoAnalysis #WeeklyChart #AscendingChannel #DemandZone #SupportResistance #PriceAction #MarketStructure #AltcoinAnalysis
Injusdtanalysis

NJ/USDT — Major Decision Zone: Massive Reversal or a Breakdown?INJ is currently at a critical moment within its broader market structure. The price has returned to the historical demand zone at 6.1–4.9, an area that previously triggered a large rally. The market’s reaction here will dictate whether INJ is preparing for a major bullish reversal, or entering a continuation of the bearish trend toward lower levels.
The current formation resembles a medium-term Falling Wedge, a pattern typically known for signaling a potential reversal if a breakout occurs. However, selling pressure still dominates, with a persistent sequence of lower highs kept in check by the descending upper trendline.
One of the most interesting elements on this chart is the long wick sweeping below support, indicating liquidity grabbing — many stop losses were triggered before the price was pulled back up. This is often an early sign that the market may be preparing to move in the opposite direction, but only if bullish confirmation follows.
Without a breakout, the structure remains firmly under bearish control.
In short:
➡️ INJ is standing at its biggest decision point for the coming weeks.
---
Bullish Scenario — “High-Potential Reversal from the Golden Zone”
Bullish Triggers
A strong bounce from 6.1–4.9 with a solid 4D bullish candle.
A clear breakout above the wedge’s upper trendline.
Increasing buy volume accompanying the breakout.
Bullish divergence appearing on momentum indicators (RSI/MACD).
Bullish Targets (Tiered & Based on the Chart)
1. 9.3 USDT → first resistance and early bullish validation.
2. 15 USDT → medium-term resistance to test trend strength.
3. 32 USDT → major target if a mid-term uptrend forms.
4. 51.5 USDT → long-term major supply for a super-bullish scenario.
Bullish Narrative
If INJ successfully breaks out of this wedge, the structure will strongly resemble a classic reversal pattern, often marking the beginning of a significant impulsive move.
---
Bearish Scenario — “Support Break Leads to Trend Continuation”
Bearish Triggers
A 4D candle closing below 4.9, breaking the demand zone.
No strong buying reaction on the retest of the broken support.
Increasing sell volume during the breakdown.
Bearish Targets (Tiered)
1. 3.0 USDT → psychological level & previous structural zone.
2. 1.12 USDT → extreme downside target if the long-term structure collapses.
Bearish Narrative
If the 6.1–4.9 zone fails to hold, the bearish momentum that has been building since early 2024 is likely to continue, and the wedge structure turns into a medium-term bearish channel.
---
Pattern Explanation
The chart currently forms a Falling Wedge (traditionally bullish).
But until a breakout occurs, the pattern remains controlled by sellers.
The 6.1–4.9 yellow zone acts as the key demand block — the buyers’ last major line of defense.
The long lower wick indicates a liquidity sweep, often preceding a trend shift.
The descending upper trendline has rejected every attempt at recovery since 2024 — a breakout here is the most crucial signal for a bullish move.
---
#INJ #Injective #INJUSDT #CryptoAnalysis #PriceAction #CryptoChart
#SupportAndResistance #FallingWedge #CryptoBreakout
#AltcoinAnalysis #TechnicalAnalysis #MarketStructure

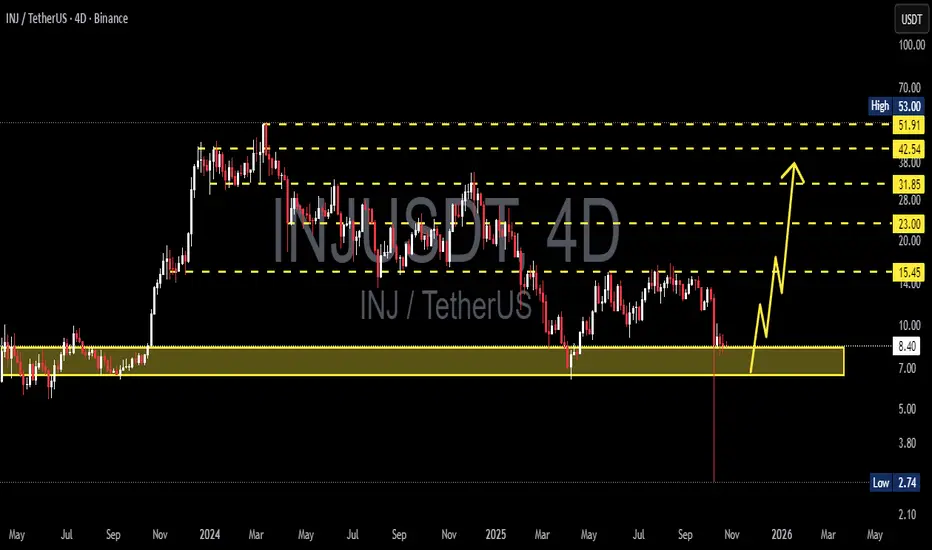
INJ/USDT — The Make-or-Break Zone: Will Injective Defend?INJ is standing at its most crucial turning point since 2023, once again testing the legendary support zone between $6.5–$8.3 — the same area that previously sparked one of its most explosive rallies all the way up to $53.
This yellow block on the chart isn’t just an ordinary support; it represents the last stronghold of the bulls — the place where the market once flipped from distribution to euphoria. Now, that fortress is being tested again under relentless bearish pressure since mid-2024.
---
📉 Technical Structure:
Primary Trend: Still in a medium-term downtrend (series of lower highs and lower lows).
Key Support Zone (Demand Area): $6.5 – $8.3
Major Resistances: $15.45 → $23.00 → $31.85 → $42.54 → $51.91
Historical Low: $2.74
A long downside wick observed earlier signals extreme liquidity events — likely the result of large-scale stop-hunting or a capitulation flush. Yet, the quick candle recovery indicates that buyers are still defending below this area.
---
📈 Bullish Scenario:
If price manages to hold above the yellow zone and prints a bullish engulfing candle on the 4D timeframe with rising volume, a strong rebound could emerge.
The first upside target would be $15.45, and if momentum builds alongside a forming higher-low structure, the market could extend toward the $23.00–$31.85 range to confirm a medium-term trend reversal.
A clean breakout and close above $23.00 would confirm a major trend reversal, potentially reopening the path to retest the higher supply zones between $42–$51.
---
📉 Bearish Scenario:
However, if INJ fails to hold above $6.5 and confirms a 4D candle close below the yellow support zone, the market could enter another distribution phase.
Downside targets would then be $3.80, followed by the historical low at $2.74, which may act as the final liquidity magnet.
A confirmed breakdown below this support would reinforce seller dominance and likely extend the ongoing downtrend into deeper price territory.
---
📊 Summary:
The yellow zone on this chart is INJ’s “make-or-break” fortress.
If it holds, the market could witness the beginning of a new accumulation phase before a potential breakout. But if this wall collapses, the chart could rewrite its story toward deeper single-digit levels.
Either way, this zone represents the highest confluence of risk and opportunity — the decisive battleground that will shape INJ’s next major trend.
---
🧭 Trading Notes:
Conservative traders: Wait for a confirmed 4D close above the yellow zone before entering long positions.
Aggressive traders: Consider scaling into positions within the zone with a stop loss below $6.5.
Short-sellers: Watch for rejections around $15.45 — a failed breakout there could offer swing short opportunities back toward the $8 region.
Risk management remains key — never let emotion override structure.
---
#INJ #Injective #INJUSDT #CryptoAnalysis #TechnicalAnalysis #PriceAction #SupportZone #SwingTrade #CryptoMarket #MarketStructure #TrendAnalysis #BullishVsBearish
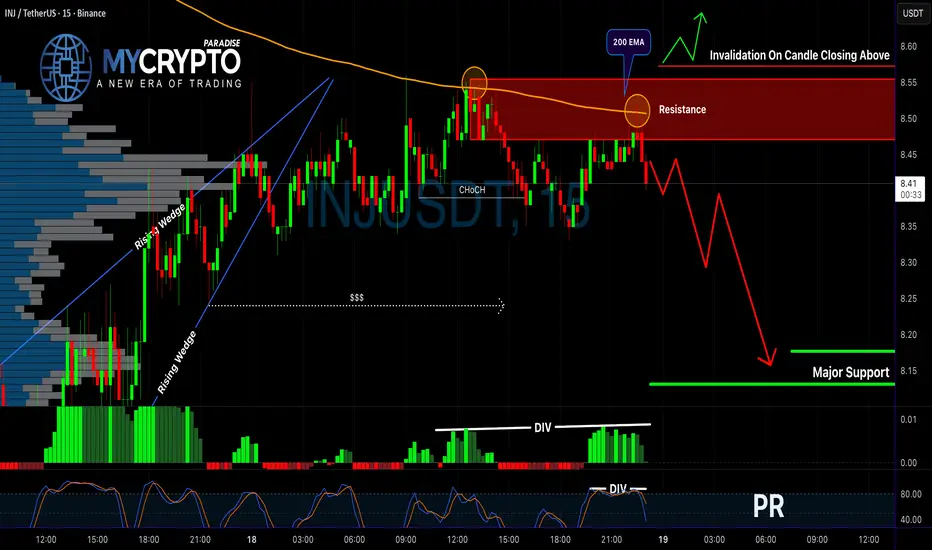
INJUSDT Just Flashed a Bearish Reversal SignalYello, Paradisers! Did you catch how INJUSDT reacted at the resistance zone? If not, you might be looking at the early signs of a deeper drop. Here's what you need to know before it's too late.
💎INJUSDT is currently flashing a clear bearish outlook as price reacts strongly from a major resistance zone. This area is further reinforced by the 200 EMA, adding technical confluence to the rejection. Most importantly, we've now seen a bearish CHoCH (Change of Character), which often marks a momentum shift from bullish to bearish. On top of that, both MACD and Stochastic RSI are showing bearish divergence—this alignment of multiple indicators significantly increases the probability of downside continuation.
💎Aggressive traders may look to enter short positions directly from current levels, aiming to capitalize on early momentum. However, for more conservative and risk-aware traders, a safer approach would be to wait for a minor pullback into the resistance area, followed by confirmation from bearish candlestick formations. This method not only improves the risk-to-reward ratio but also increases the overall probability of success by waiting for clearer market signals.
💎That said, we always account for invalidation. If the price manages to break and close decisively above the resistance zone, it would invalidate the current bearish structure. In such a scenario, standing aside and waiting for a new price structure to form would be the smarter move, rather than trying to force a trade against the new trend.
💎This is where patience and discipline truly set you apart from the herd. If you want to be consistently profitable, you must learn to wait for the highest probability opportunities—just like we do. Avoid rushing, and don’t let emotions lead your decisions.
🎖Strive for consistency, not quick profits. Treat the market as a professional business—not a gamble. That’s the only way to build long-term success in crypto. Be a PRO.
MyCryptoParadise
iFeel the success🌴
INJ/USDT – Symmetrical Triangle Approaching Major Breakout?Full Analysis:
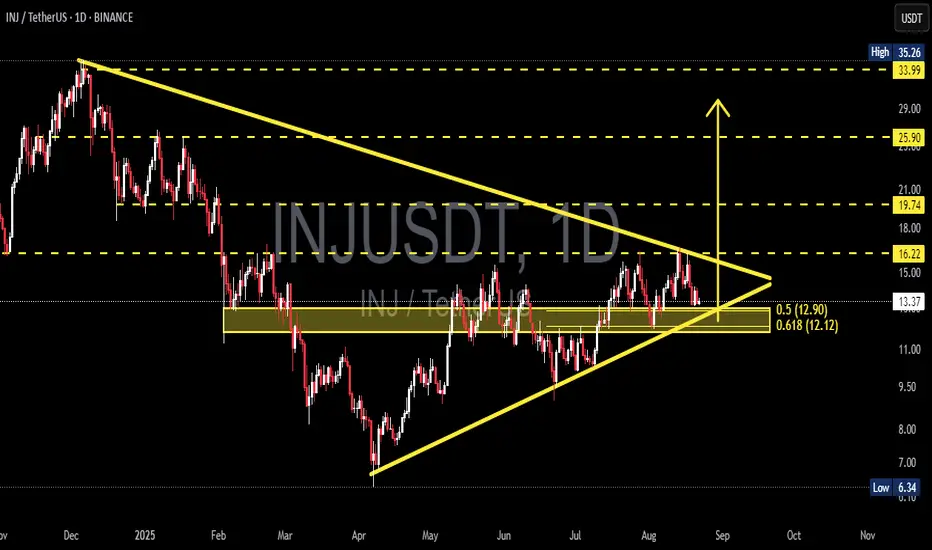
INJ/USDT is currently consolidating within a daily symmetrical triangle pattern, where lower highs (seller pressure) meet higher lows (buyer defense). This pattern usually signals a phase of compression before a strong directional breakout, typically occurring as price approaches the apex of the triangle.
Right now, price sits around 13.35, testing a critical demand zone that overlaps with the 0.5–0.618 Fibonacci retracement (12.90–12.12). This makes the zone a make-or-break area: holding above could fuel a bullish breakout, while a breakdown would likely trigger further bearish momentum.
---
🔼 Bullish Scenario
Trigger: A daily close above the triangle’s upper trendline (~15.0), followed by a confirmed breakout above 16.22.
Additional Confirmation: Increasing volume during breakout.
Upside Targets:
🎯 T1: 16.22 → confirmation of breakout.
🎯 T2: 19.74 (key historical resistance).
🎯 T3: 25.90 (next major resistance).
🎯 T4: 33.99–35.26 (previous high & ultimate bullish objective).
Invalidation: Failure to hold above 16.22 after breakout and a return back inside the triangle.
---
🔽 Bearish Scenario
Trigger: A daily close below the ascending trendline and the 12.90–12.12 demand zone.
Additional Confirmation: Strong selling volume and clear rejection candles below the zone.
Downside Targets:
⚠️ T1: 9.50 (psychological support & measured move projection).
⚠️ T2: 6.34 (major historical low).
Invalidation: Quick recovery and reclaim above 12.9–13.5.
---
📐 Pattern & Technical Logic
Symmetrical Triangle → Neutral structure, representing market indecision before a strong move.
Measured Move Projection → Height of the triangle (~3–4 points) projected from the breakout point → aligns with ~19.7 to the upside or ~9.5 to the downside.
Golden Fibonacci Zone (0.5–0.618 / 12.90–12.12) → Often acts as the last stronghold for buyers in a mid-term structure.
---
📝 Key Insight
If INJ manages to break and sustain above 16.22 with strong volume, it could trigger a major bullish continuation toward higher targets.
Conversely, a decisive breakdown below 12.12 would confirm bearish momentum, opening the door for a deeper retracement toward 9.50 and 6.34.
With volatility squeezing near the apex, a large directional move is very likely in the coming weeks.
---
🎯 Conclusion
INJ is approaching a critical decision point:
Above 16.22 = bullish breakout with significant upside potential.
Below 12.12 = bearish breakdown with deeper correction ahead.
Traders should wait for a confirmed daily breakout before committing to a direction. Whichever side wins, the risk/reward opportunity is substantial.
#INJ #INJUSDT #CryptoAnalysis #SymmetricalTriangle #ChartPattern #PriceAction #Breakout #SupportResistance #Fibonacci #Altcoins #CryptoTrading
INJ/USDT Setup Live | Bullish Plan to Hit Target @ 16.100🚀 INJECTIVE BREAKOUT RAID: Thief Layers the Grid for the Next Crypto Heist 💣🧠
💼 Asset: INJ/USDT — Injective vs Tether
🧭 Plan: Bullish Grid Strategy
🎯 Target: 16.100
🛑 Stop Loss: 12.500
🔫 Entry: Any Price — We Layer Like Pros
🦹♂️ Yo Market Robbers, Snipers & Grid Lords! 🦹♀️
Injective's about to pay big bags, and the Thief is already inside the system. 🔓
This ain’t no simple play — this is layered entry warfare, the grid strategy special. We ain’t chasing price, we’re setting traps, limit by limit, like silent assassins. 🧊🎯
📊 ENTRY STRATEGY
Thief sets layered limit orders like landmines:
💥 Entry: Any level — let the price come to YOU.
🧱 Grid-style entries with sniper precision. Patience is power.
🛑 STOP LOSS SETUP
Below enemy lines —
🔻 Hard SL @ 12.500 to avoid detection.
🎭 Disappear if the zone gets compromised.
🎯 TARGET ZONE
High-value vault spotted @ 16.100
Get in, loot, and vanish like a shadow in the blockchain. ⛓️💸
📈 WHY THIS RAID WORKS
Market favoring bulls — trend riding 🔥
Liquidity gaps above = potential explosion 💣
Sentiment flipping bullish — Thief smells blood 💉
Layering lets you enter without alerting the guards 🚨
🧠 Thief Wisdom
Don’t chase pumps. Let the market fill your bags passively.
Stay emotionless. Stay planned. Stay funded. 💼📈
💖 Boost the Thief Crew
If this mission blueprint matches your grind, smash the ❤️ Boost, drop a comment, and let’s rob the market together — one clean heist at a time. 🧤🕵️
More plays loading soon. Until then…
Rob Smart. Rob Quiet. Rob Rich. 💰🐱👤

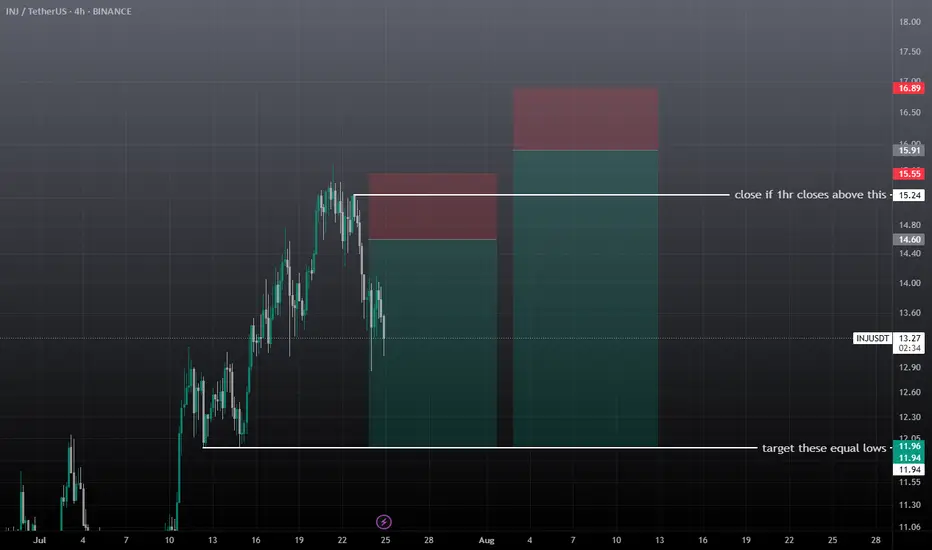
inj swing short setupWait for the entry, don't take it at current market price, entry can take time. There are two short setups forming on injusdt, after achieving the first entry if 1hr closes above the mentioned zone then close trade before sl, and then take the 2nd short setup, if tp achieves first then don't take the trade wait for the new setup.
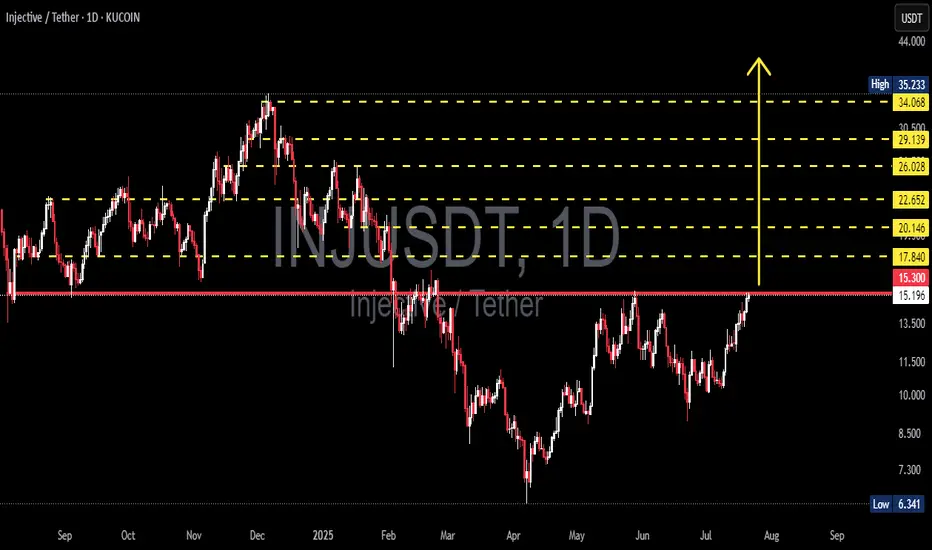
INJ/USDT at a Crucial Breakout Zone: Will the Path to $35 Unfold🧠 Full Technical Analysis (Daily Timeframe - KuCoin):
INJ/USDT (Injective Protocol) is currently at a critical decision point, testing a major resistance zone that has held strong since early 2025. After months of consolidation and a consistent structure of higher lows since May 2025, bullish pressure is now building momentum.
📊 Chart Pattern: Ascending Triangle Breakout in Progress
The price structure reveals a classic Ascending Triangle formation:
🔼 Rising support (higher lows) → signals accumulation.
⛔ Flat resistance at $15.30–$15.50 → key supply zone repeatedly tested.
This is a bullish continuation pattern, often leading to explosive upside once broken.
If the breakout is confirmed, INJ could rally through several historical resistance levels with strong potential for upside momentum.
📍 Key Resistance & Target Levels (Potential Take Profits):
Once price breaks above the key resistance, watch the following upside targets:
Level Significance
$17.84 Initial breakout confirmation level
$20.14 Psychological resistance & volume cluster
$22.65 Previous consolidation zone
$26.02 Intermediate high structure
$29.13 Strong resistance & prior distribution zone
$34.06 Final hurdle before reclaiming highs
$35.23 🔥 Major breakout target
🟢 Bullish Scenario:
✅ Daily close above $15.50 with strong volume = confirmed breakout.
🚀 Sequential target levels activated: $17.84 → $22.65 → $29.13 → $34.06.
💥 Potential for FOMO rally beyond $20, triggering long-term bullish trend.
🔴 Bearish Scenario (Rejection Case):
❌ Failure to break $15.30 leads to rejection.
⚠️ Downside targets: $13.20 → $12.00 → $10.60.
❌ Drop below $10.00 invalidates higher low structure and may trigger bearish reversal.
🧨 A sharp rejection may form a potential Double Top pattern, leading to downside pressure.
📈 Trading Strategy Recommendations:
🎯 Conservative Entry: Wait for breakout + retest confirmation at $15.50.
⚡ Aggressive Entry: Buy the breakout with tight stop-loss below $14.80.
📌 Consider laddered take-profits at each resistance level.
🔒 Use risk management — false breakouts are common in this zone.
---
🔍 Summary: Breakout Imminent or Final Rejection?
INJ is on the verge of a high-impact move. A confirmed breakout would likely trigger a trend reversal to the upside, while a failure could lead to another leg down. The next few candles will decide the medium-term direction. Traders should stay sharp, and act with a plan — this could be the start of something big.
⚠️ Always Trade with Discipline and Risk Management!
#INJUSDT #InjectiveProtocol #CryptoBreakout #AltcoinSetup #TechnicalAnalysis#BullishCrypto #PriceAction #CryptoSignals #BreakoutTrade #CryptoStrategy
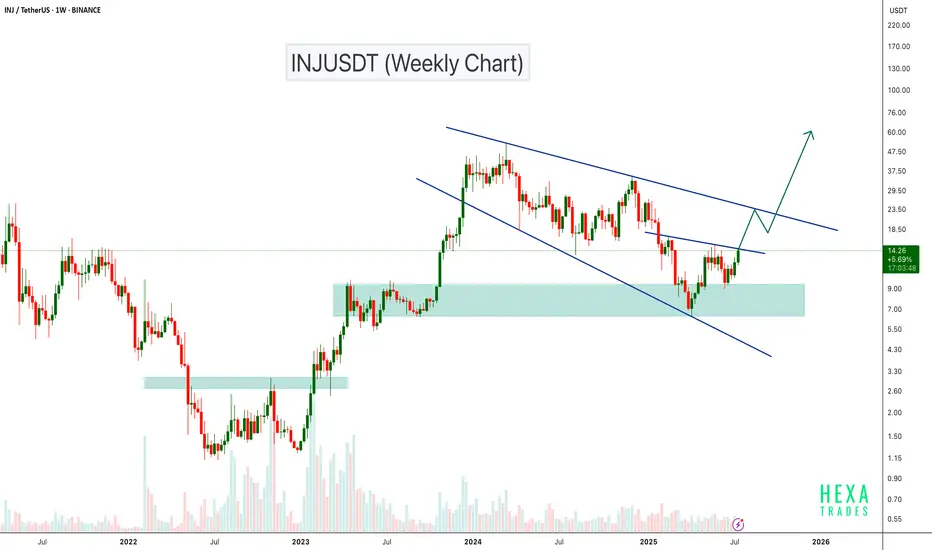
INJUSDT Approaching Key Wedge Resistance – Breakout Ahead?INJ is currently trading inside a broadening wedge pattern on the weekly timeframe. The price recently bounced strongly from the major demand zone around $8–$9, which has acted as a reliable support level in the past.
Now, INJ is approaching the upper resistance trendline of the broadening wedge. A confirmed breakout above this level could lead to a strong bullish move, potentially targeting the $50 level.
Cheers
Hexa
CRYPTOCAP:INJ BINANCE:INJUSDT
INJ/USDT Weekly Outlook – Holding the Golden Zone!
📊 Complete Technical Analysis:
INJ/USDT is currently sitting at a critical weekly demand zone between $7.50 – $9.00, an area that has consistently triggered strong bullish reversals since mid-2022. This yellow zone represents a historical accumulation range, where buyers have stepped in aggressively during past dips.
The structure is forming a potential Double Bottom or even a base accumulation pattern, which often precedes explosive upward movements.
🟢 Bullish Scenario (Optimistic Outlook):
If price continues to hold above this key support, a bullish reversal is highly probable.
🔼 Upside Targets:
1. First Target: $12.97 – initial resistance level
2. Mid Target: $16.12 – previously a strong distribution zone
3. Major Target: $32.75 to $43.09 – major resistance from the last peak phase
💡 Bullish Confirmation:
Weekly candle closes above $12.97 with volume
Bullish price action near the support zone
Formation of higher lows on the weekly chart
Once price breaks above $16.12, INJ could accelerate toward the $30–$40 range.
🔴 Bearish Scenario (Caution Required):
However, if price breaks down below the $9.00 support zone with strong volume and a full-bodied weekly candle close, downside risk increases.
🔽 Bearish Targets:
$7.50 – psychological support
$5.00 – deeper support zone
$1.12 – extreme scenario (previous macro bottom)
⚠️ Bearish Signs:
Strong rejection at $12.97
Weekly close below the yellow demand zone with significant sell volume
📉 Market Psychology & Pattern Insight:
The market is in a highly emotional phase, but accumulation signs are visible.
Retail traders may panic near $9.00, but smart money often buys quietly in these zones.
This is a "patience zone" — where big moves are quietly prepared before launching.
📎 Conclusion:
> INJ is currently testing a powerful historical support zone. A breakout above $12.97 could trigger a multi-leg rally toward $30–$43. However, a breakdown below $9.00 would invalidate the bullish setup and call for caution.
#INJUSDT #CryptoAnalysis #AltcoinBreakout #TechnicalAnalysis
#SupportAndResistance #BullishSetup #BearishScenario #DoubleBottom
#PriceAction #CryptoTrading

inj swing trade setupInj has broken downside, expecting more downfall before any leg up, wait for the entries to be filled, these are swing trades based on 1 day TF, so here wick doesn't matter wait for the closing, you can hold them without SL if entry achieved, take 1st entry on mentioned points 2nd entry below SL, and then wait for the closing, IF any entry achieved and candle closed above the short then wait for the pullback and close on entry points if long entry achieved then hold the trade 2nd entry take from previous wick low and wait for the tp this leg down will be the final shakeout before any major move. That's why giving you some short entries. BTC will take a final leg down sooner or later, then Boom your alt season starts.

INJ at Key Compression Zone – Breakout Loading?Hello Traders,
CRYPTOCAP:INJ is currently trading between two key zones — a strong upper resistance and a solid lower support.
The price is getting squeezed between a descending resistance line and a rising support trendline, creating a high-confluence area.
So far, bulls are holding the support well. If price breaks above the upper zone, it could trigger a strong move upward.
However, if the support fails, a deeper correction may follow.
🔍 Watch closely — a breakout is brewing, and volatility is on the horizon.
DYOR, NFA

INJ/USD Bullish Heist: Crack the Vault & Grab the Loot!Ultimate INJ/USD Heist Plan: Snag Profits with the Thief Trading Strategy! 🚀💰
🌍 Greetings, Wealth Raiders! Ciao, Hello, Bonjour, Hola! 🌟
Fellow profit hunters, get ready to crack the INJ/USD "Injective vs U.S Dollar" Forex vault with our slick Thief Trading Strategy! 🤑💸 This plan blends razor-sharp technicals and fundamentals to loot the market. Follow the chart’s long-entry blueprint to strike at high-risk zones like the Yellow Moving Average Zone. It’s a wild ride—overbought conditions, consolidation, and potential trend reversals mean bears are lurking! 🐻 Stay sharp, grab your profits, and treat yourself—you’ve earned it! 🎉💪.
📈 Entry: Storm the Vault!
"The heist is on! Wait for the breakout (14.700) then make your move - Bullish profits await!"
The market’s ripe for a bullish grab! 💥 Place buy limit orders within the most recent 15 or 30-minute swing low/high levels. Set alerts on your chart to stay locked in. 🔔
🛑 Stop Loss: Guard Your Loot!
Set your Thief SL at the nearest swing low or candle wick. on the 8H timeframe for day/swing trades. Adjust based on your risk tolerance, lot size, and number of orders. Safety first! 🔒
🎯 Targets: Claim Your Prize!
🏴☠️ Short-Term Target: 15.700
👀 Scalpers, Listen Up!
Stick to long-side scalps. Got deep pockets? Jump in now! Otherwise, join swing traders for the heist. Use trailing stop-loss to lock in gains and protect your stash. 💰
🐂 Why INJ/USD is Hot!
The "Injective vs U.S Dollar" bullish surge is fueled by key fundamentals. Dive into Macro, COT Reports, On Chain Analysis, Sentiment outlook, Intermarket trends, and future targets via the linkss below for the full scoop. 👉🔗. Stay informed to stay ahead! 📰
⚠️ Trading Alert: News & Position Management
News releases can shake the market like a heist gone wrong! 🗞️ To protect your profits:
🚫 Avoid new trades during news events.
🛡️ Use trailing stops to secure running positions.
💥 Boost the Heist!
Hit the Boost Button to supercharge our Thief Trading Strategy! 💪 Every click strengthens our crew, making it easier to swipe profits daily. Join the squad, trade smart, and let’s make money rain! 🌧️💵

INJUSDT 1D AnalysisINJ ~ 1D Analysis
#INJ Buy after successfully penetrating this resistant line with a short -term target of at least 10%+.

#INJUSDT is setting up for a breakout Long BYBIT:INJUSDT.P from $10,346
🛡 Stop loss $10,182
1h Timeframe
⚡ Plan:
➡️ Waiting for consolidation near resistance and increased buying activity before the breakout.
➡️ Expecting an impulsive upward move as buy orders accumulate.
🎯 TP Targets:
💎 TP 1: $10,550
💎 TP 2: $10,730
💎 TP 3: $10,849
🚀 BYBIT:INJUSDT.P is setting up for a breakout—preparing for an upward move!

INJ/USD "Injective Protocol vs Dollar" Crypto Market Heist Plan🌟Hi! Hola! Ola! Bonjour! Hallo! Marhaba!🌟
Dear Money Makers & Thieves, 🤑 💰🐱👤🐱🏍
Based on 🔥Thief Trading style technical and fundamental analysis🔥, here is our master plan to heist the INJ/USD "Injective Protocol vs U.S Dollar" Crypto market. Please adhere to the strategy I've outlined in the chart, which emphasizes long entry. Our aim is the high-risk Red Zone. Risky level, overbought market, consolidation, trend reversal, trap at the level where traders and bearish robbers are stronger. 🏆💸Book Profits wealthy and safe trade.💪🏆🎉
Entry 📈 : "The vault is wide open! Swipe the Bullish loot at any price - the heist is on!
however I advise to Place Buy stop orders above the Moving average (or) Place buy limit orders within a 15 or 30 minute timeframe most recent or swing, low or high level.
Stop Loss 🛑:
Thief SL placed at the recent / swing low level Using the 4H timeframe (13.000) swing trade basis.
SL is based on your risk of the trade, lot size and how many multiple orders you have to take.
Target 🎯:
Primary Target - 20.500 (or) Escape Before the Target
Secondary Target - 25.000 (or) Escape Before the Target
🧲Scalpers, take note 👀 : only scalp on the Long side. If you have a lot of money, you can go straight away; if not, you can join swing traders and carry out the robbery plan. Use trailing SL to safeguard your money 💰.
📰🗞️Fundamental, Macro, COT, Sentimental Outlook:
INJ/USD "Injective Protocol vs Dollar" Crypto Market is currently experiencing a bullish trend,., driven by several key factors.
🟣Fundamental Analysis
1. Project Overview: Injective is a blockchain built for finance, offering high transaction throughput, interoperability, and financial primitives.
2. Tokenomics: INJ is the native asset, used for transaction fees, staking, and governance.
3. Development Activity: Injective has a strong development team, with frequent updates and improvements.
🔴Macro Economics
1. Inflation: Global inflation trends may impact investor sentiment and cryptocurrency prices.
2. Interest Rates: Changes in interest rates can influence cryptocurrency prices, as investors may seek alternative investments.
3. Global Economic Trends: Economic uncertainty and market volatility can drive investors towards cryptocurrencies like INJ.
🟤On-Chain Analysis
1. Network Congestion: INJ's network congestion is relatively low, indicating a healthy network.
2. Transaction Volume: The transaction volume on the INJ network is stable, showing consistent activity.
🔵Market Sentimental Analysis
1. Investor Sentiment: Currently leaning towards a bullish outlook, driven by increasing adoption and positive market trends.
2. Market Positioning: Investors are optimistic about INJ's potential, with some expecting a breakout above $18.
3. Next Trend Move: Potential for an upward movement, with some analysts expecting a retest of the $18 zone before the next leg up.
🟢Positioning
1. Long Positions: 58.2%
2. Short Positions: 41.8%
🟠Overall Summary Outlook
Considering the current price of 16.500, INJ/USD is expected to maintain its upward momentum, driven by increasing adoption and positive market trends. However, investors should be cautious of potential price volatility and market fluctuations.
⚠️Trading Alert : News Releases and Position Management 📰 🗞️ 🚫🚏
As a reminder, news releases can have a significant impact on market prices and volatility. To minimize potential losses and protect your running positions,
we recommend the following:
Avoid taking new trades during news releases
Use trailing stop-loss orders to protect your running positions and lock in profits
💖Supporting our robbery plan will enable us to effortlessly make and steal money 💰💵 Tell your friends, Colleagues and family to follow, like, and share. Boost the strength of our robbery team. Every day in this market make money with ease by using the Thief Trading Style.🏆💪🤝❤️🎉🚀
I'll see you soon with another heist plan, so stay tuned 🤑🐱👤🤗🤩

INJUSDT 1WINJ ~ 1W Analysis
#INJ Test this support, buy gradually from here with a short -term target of at least 20%+.

INJUSDT 1WINJ ~ 1W Analysis
#INJ Form a bullish flag pattern. Buy gradually from here with a minimum target of 20%+.

INJUSDT 1WINJ ~ 1W Analysis
#INJ In this time frame 1W the main support that previously held the price, Buy from here if you still have a Conviction on this coin with a minimum target of 20%+

INJUSDT | Next Move? Are You Ready?Injective (INJ) has been showing tremendous potential due to its innovative blockchain features and increasing adoption within the crypto space. The current market conditions and technical analysis suggest that the blue boxes on the chart represent optimal zones for spot buying.
Why INJ/USDT Has Huge Potential
Fundamental Strength: Injective offers unique decentralized finance (DeFi) capabilities, including cross-chain functionality, high-speed transactions, and low fees. These features position it as a leading blockchain solution for DeFi projects.
Adoption and Ecosystem Growth: The Injective ecosystem is rapidly expanding with new projects, partnerships, and integrations, driving demand for INJ tokens.
Positive Market Sentiment: With growing interest in DeFi and blockchain scalability, INJ is attracting attention as a high-potential asset.
Technical Setup: The blue boxes on the chart highlight demand zones, where the price historically shows strong support. These zones likely represent areas of buyer accumulation, making them ideal for spot entry.
Why the Blue Boxes are Key Levels
Demand Zones: These areas reflect points of interest where institutional or large buyers may step in. Buying at these levels increases the likelihood of capturing a significant upward move.
Risk-Reward Ratio: Entering near the blue boxes minimizes downside risk while offering a higher potential for profit as the price bounces back.
Confirmation: Previous interactions at these levels have led to strong reversals, adding confidence to the accumulation strategy.
Strategy for Spot Buying
Set Buy Orders: Place spot buy orders within the blue boxes to accumulate INJ at optimal prices.
Monitor Closely: Watch for confirmations like bullish candlestick patterns or increased volume near these zones.
Hold for Long-Term Growth: INJ's potential lies in its fundamentals and ecosystem expansion, making it a strong candidate for long-term investment.
I keep my charts clean and simple because I believe clarity leads to better decisions. Trading doesn’t have to be overly complicated, and I enjoy sharing setups that have worked well for me.
My approach is built on years of experience and a solid track record. I don’t claim to know it all, but I’m confident in my ability to spot high-probability setups. It’s all about learning and growing together as traders, and I’m here to share what I see.
The markets can confirm what the charts whisper if we’re paying attention. I hope these levels help you as much as they’ve helped me in the past. Let’s see how this plays out!
🐶 DOGEUSDT.P: Next Move
🎨 RENDERUSDT.P: Opportunity of the Month
💎 ETHUSDT.P: Where to Retrace
🟢 BNBUSDT.P: Potential Surge
📊 BTC Dominance: Reaction Zone
🌊 WAVESUSDT.P: Demand Zone Potential
🟣 UNIUSDT.P: Long-Term Trade
🔵 XRPUSDT.P: Entry Zones
🔗 LINKUSDT.P: Follow The River
📈 BTCUSDT.P: Two Key Demand Zones
🟩 POLUSDT: Bullish Momentum

INJ Breakout given forming a W in weeklyCRYPTOCAP:INJ Send it here 🚀🚀
Good looking chart. Real move comes after 33.2
Target expected to be 41.5/52
#INJUSDT #INJ #BTC #ETH #Crypto

INJUSDT Targets $100!INJUSDT Technical analysis update
INJUSDT has broken the resistance zone on the daily chart, accompanied by a rise in volume near the resistance over the past few days. The price is trading above the 100 and 200 EMAs on the daily chart, signaling a potential bullish move in the coming days. The price could reach $100 in the next few months.

$INJUSDT Analysis: Bullish Momentum Post-Election result!!BINANCE:INJUSDT has shown a strong bullish momentum after breaking out from a key trendline and undergoing a healthy correction to major support levels. Yesterday's sharp upward move, accompanied by significant volume, came in the wake of positive election results, fueling optimism in the market. With this newfound strength, we are anticipating that INJUSDT could soon challenge and potentially break its All-Time High (ATH).
As always, trade cautiously and use a small portion of your capital to manage risk effectively. The trend is favorable, but risk management is key.
Trade Safe, Stay Smart!
BINANCE:INJUSDT Currently trading at $20.8
Buy level: Above $20
Stop loss: Below $16
TP1: $23
TP2: $28
TP3: $33
TP4: $53
Max Leverage 3x
Follow Our Tradingview Account for More Technical Analysis Updates, | Like, Share and Comment Your thoughts
