ROOT pretends to stay quiet, but the chart exposes its ambitionsROOT continues to develop a stable accumulation base inside a broadening channel while holding above the key demand zone near 80.65. This area aligns with the 0.786 Fibonacci retracement and the weekly ma100 which strengthens the support. Buyers remain active and the structure continues to signal accumulation.
The primary scenario suggests upward movement from the current price with the first target at 134.60 once the local consolidation is reclaimed. The next target sits at 181.50. The extended target remains at 241.53 where the upper channel boundary and volume projections converge.
Fundamentally ROOT maintains strong momentum. Revenue for the last twelve months reached 420 million dollars. Premium growth remains double digit versus the prior year. Loss ratios continue to improve. Customer retention is rising, and the cash position remains solid with more than 500 million dollars on hand. As of December 10th 2025 the company holds a market capitalization of roughly 2.1 billion dollars which leaves meaningful room for revaluation as margins improve.
As long as the price holds above 80.65 the bullish scenario remains active. Losing this zone will open deeper correction potential, yet the current buyer reaction and volume structure support continuation of the upward phase.
ROOT acts humble but the chart makes it clear. Its ambitions reach far beyond current levels.
Insurance

SBI Life Insurance: Breaking 420-Day Consolidation BUY Setup 🛡️
Entry: ₹1,936-1,945 (Current Level)
Target 1: ₹1,984-1,990
Target 2: ₹2,019-2,030
Target 3: ₹2,056-2,075 (Extended)
Stop Loss: ₹1,910
Technical Rationale:
MAJOR BREAKOUT after 420 days of consolidation (highlighted in cyan)
Breaking above long-term resistance at 1,930 level with strong momentum
Weekly chart showing powerful +5.27% surge
Volume buildup visible (highlighted) - institutional accumulation
Price breaking above descending trendline from 2024 highs
Trading above both EMAs indicating strong bullish trend
Rounding bottom formation on weekly - classic bullish reversal
High volume (5.03M) confirming breakout authenticity
RSI trending upward with room for further upside
Insurance sector showing relative strength
Clear support base at 1,876-1,910 zone
Risk-Reward: Excellent 1:4+ ratio
Pattern: Multi-month base breakout + Rounding bottom - extremely reliable bullish setup on weekly timeframe
Strategy: Positional/long-term - Book 25% at T1 (1,990), 25% at T2 (2,025), trail remaining 50% with SL at 1,950 after T1 achieved
Key Levels:
Breakout Zone: 1,930-1,945 (critical resistance broken)
Strong Resistance: 1,984, 2,019, 2,056
Major Support: 1,910, 1,876
Major Catalyst:
420-day consolidation breakout = huge pent-up energy
Volume accumulation phase complete
Financial sector strength
Disclaimer: For educational purposes only. Not SEBI registered. 420-day base breakout is significant - these typically lead to sustained moves. Weekly chart for medium to long-term position. Manage risk appropriately and conduct thorough research before investing.

Accumulating Insurance ETF, wonder if bottom for $UNH.With wobbly markets, Insurance ETF have shown strength. In a monthly macd view, it's supported above the zero.
Positionally, bulls have been exhausted, not perfect momentum MAs, people lacking positions is the driving FOMO force.
NYSE:UNH

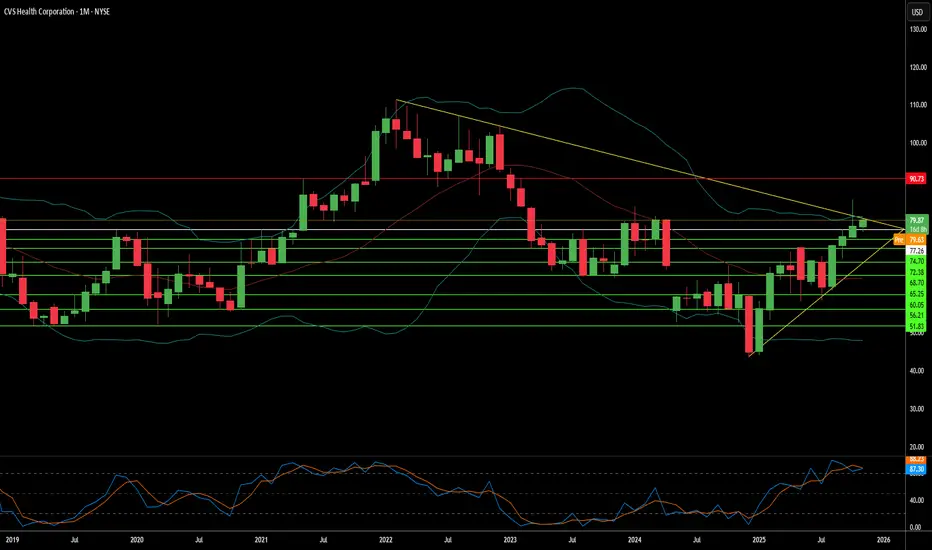
Can Integration Save CVS or Sink It?CVS Health confronts a dangerous convergence of risks that threatens its vertically integrated business model. The company's Pharmacy Benefit Manager (PBM) subsidiary, Caremark, faces intensifying regulatory scrutiny as lawmakers target the opaque rebate structures and spread pricing mechanisms that underpin PBM profitability. Simultaneously, the explosive growth of high-cost GLP-1 weight-loss drugs has created unprecedented formulary pressure. CVS's decision to exclude Eli Lilly's Zepbound in favor of Novo Nordisk's Wegovy, based purely on price, backfired spectacularly. Lilly publicly pulled its employees from CVS's PBM plan and shifted to competitor Rightway Healthcare, signaling deep market skepticism about CVS's ability to balance cost control with clinical outcomes. This defection validates concerns that major employers are increasingly willing to abandon the "Big Three" PBMs for transparent alternatives.
The company's acquisition strategy has proven economically disastrous, with CVS recording a staggering $5.7 billion goodwill impairment charge on Oak Street Health in Q3 2025, effectively admitting the primary care assets were dramatically overvalued. This massive write-down undermines the core thesis that vertical integration of insurance (Aetna), PBM (Caremark), and care delivery creates synergistic value. Meanwhile, operational margins erode from multiple directions: $833 million in litigation charges from past business practices, declining generic dispensing rates as expensive branded GLP-1 drugs displace generics, and the structural reality that robust patent protection on GLP-1 drugs extending into the 2040s eliminates the PBM's traditional leverage of threatening generic competition.
CVS faces additional systemic vulnerabilities across geopolitical, technological, and scientific domains. The company's reliance on Active Pharmaceutical Ingredients sourced from China and India exposes it to supply chain disruptions, tariffs, and mandatory but expensive domestic manufacturing mandates. Its vast integrated infrastructure creates an attractive single point of failure for cyberattacks, heightened by the $20 billion technology investment to further interconnect all segments. Most critically, pharmaceutical manufacturers hold unprecedented leverage due to the extended patent exclusivity of breakthrough GLP-1 therapies, with no meaningful generic relief for 15-20 years, forcing CVS into a perpetual choice between excluding superior drugs and losing clients, or accepting coverage that severely erodes margins.
Until CVS demonstrates sustainable PBM client retention among major employers, successful integration of its healthcare delivery assets without further impairments, and a viable strategy to navigate the regulatory assault on traditional PBM economics, the investment profile remains fundamentally challenged. The Lilly defection represents more than a single client loss; it exposes structural fragility in a business model increasingly misaligned with market demands for transparency, clinical appropriateness, and technological innovation.
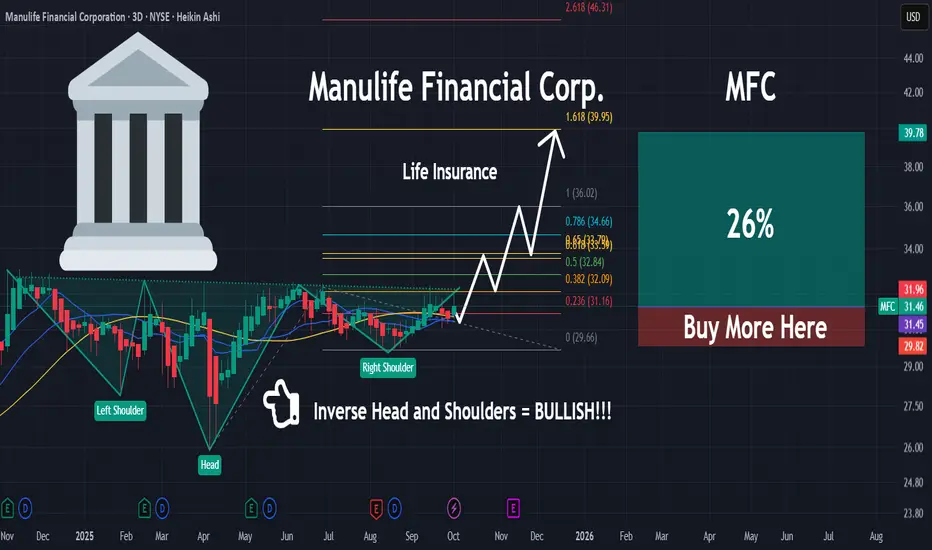
MFC | Something is Brewing | LONGManulife Financial Corp. engages in the provision of financial services and insurance for individuals, groups, and businesses. It operates through the following segments: Asia, Canada, U.S., Global Wealth and Asset Management (WAM), and Corporate and Other. The Asia segment offers insurance products and insurance-based wealth accumulation products. The Canada segment includes insurance products, insurance-based wealth accumulation products, and banking services. The U.S. segment consists of life insurance products and insurance-based wealth accumulation products and has an in-force long-term care insurance business and an in-force annuity business. The Global WAM segment delivers investment solutions to retail, retirement, and institutional clients. The Corporate and Other segment refers to investment performance on assets backing capital, costs incurred by the corporate office related to shareholder activities, property and casualty reinsurance business, and run-off reinsurance operation including variable annuities and accident and health. The company was founded in 1887 and is headquartered in Toronto, Canada.
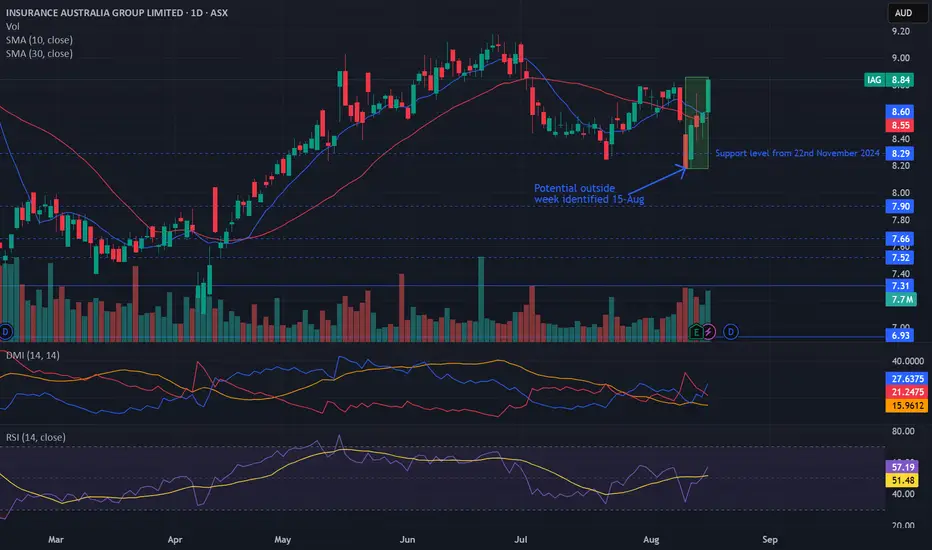
Potential outside week and bullish potential for IAGEntry conditions:
(i) higher share price for ASX:IAG above the level of the potential outside week noted on 15th August (i.e.: above the level of $8.86).
Stop loss for the trade would be:
(i) below the low of the outside week on 11th August (i.e.: below $8.18), should the trade activate.
MET | Life Insurance Industry Will Rise | LONGMetLife, Inc. engages in providing insurance and financial services to individual and institutional customers. It operates through the following segments: Group Benefits, Retirement and Income Solutions (RIS), Asia, MetLife Holdings, and Corporate and Other. The Group Benefits segment offers group life insurance products with renewable term policies. The RIS segment contains short and long-duration products, including capital market products, pension risk transfers, structured settlements, and other benefit funding products. The Asia segment focuses on Japan only and offers traditional life insurance, and accident and health products. The MetLife Holdings segment includes traditional and universal life products. The Corporate and Other segment refers to surplus investment portfolios used to fund capital and liquidity needs. The company was founded on March 24, 1868 and is headquartered in New York, NY.

Humana | HUM | Long at $220.00Humana NYSE:HUM took a nosedive to "crash" levels (based on my selected simple moving averages (SMA)) this morning after a lower-performance rating for a widely used Medicare insurance plan is expected to hurt enrollments for 2025 (and will potentially hit the health insurer's revenue and bonus payments in 2026). However, I view this massive drop as an opportunity for an initial long entry for a great value stock. The company is strong, highly rated among patients, and solid fundamentals despite the anticipated earnings drop. From a technical analysis perspective, it touched my "crash" SMA, but may dip further after a dead cat bounce to the $190s in the coming days or weeks. But, predicting true bottom is a fool's game, so at $220.00, NYSE:HUM is in a personal buy zone for an initial long entry.
Target #1 = $250.00
Target #2 = $275.00
Target #3 = $314.00
Target #4 = $340.00

F&G Annuities & Life Inc — Insider Activity ReportSergio Richi Premium ✅
NYSE:FG — F&G Annuities & Life Inc (NASDAQ:FG) Insider Activity Report | Financial | Insurance-Life |USA | NASDAQ | September 04, 2025.
Price (Sept 4, 2025) : $34.99
Insider Activity
CEO Chris Blunt just bought 7,000 shares at $34.02 on Sept 2. That pushes his 2025 insider buys to $2.5M+. No insider sales on record. When the CEO keeps writing checks into weakness, that’s conviction you don’t ignore.
(SEC Form 4)
www.sec.gov
1. Company Overview
FG is a life insurance and annuities player, majority-owned by Fidelity National Financial. Core business: retirement security through annuities, life insurance, and pension risk transfers. Rising rates have juiced demand for fixed-index annuities. Q2 revenue: $1.35B (+12.6% YoY), with sales momentum accelerating.
Dividend just bumped to $0.22/share (2.5% yield).
2. The Setup
• Stock is down ~15% YTD but holding a strong base near $34 support.
• Heavy institutional ownership (95.71%) and recent inflows from funds like BlackRock, DFA, and Millennium.
• Catalysts ahead: Q3 earnings in November, sector tailwinds from higher-for-longer rates, and annuity demand from aging demographics.
Charts:
• (1D)
Insider Trades:
FG seasonality:
FG Hedge Fund Flows:
FG Ownership:
3. The Trade:
Entry : $34–35
🎯 Take Profit 1: $40.85 (+16.75%)
🎯 Take Profit 2: $43.70 (+24.89%)
My View
The CEO is doubling down, institutions are scaling in, and fundamentals are firm. Risk/reward skews bullish — I see a 16–25% move higher as the base case, with upside surprise if annuity sales keep beating.

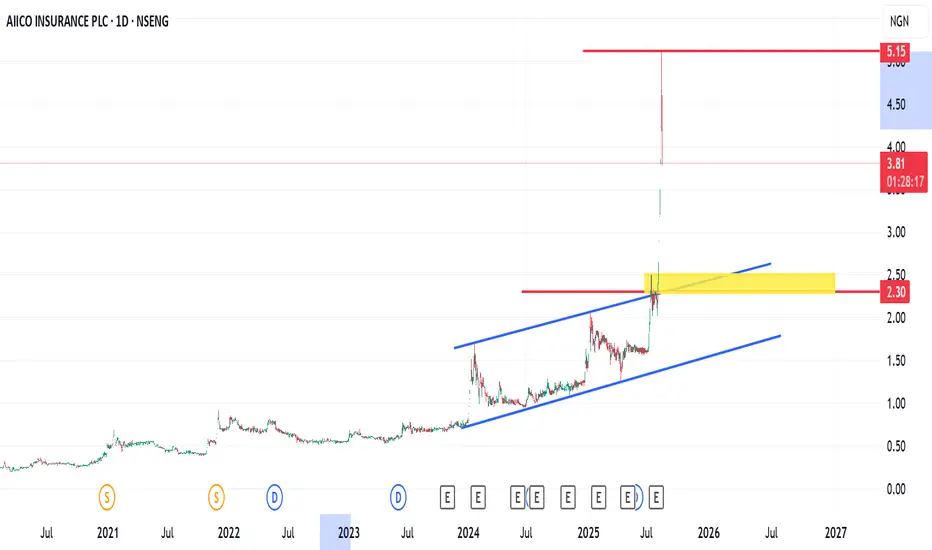
AIICO, this is the pullback I have been waiting forThe strong breakout rewarded investors with over 120% ROI from the 4th of August 2025 before this massive -26% pullback
While I am bullish on the Nigerian insurance sector because of the new insurance reform, I am patiently waiting for some of this stock to retrace for my entry for a ride into 2026
I would love to start buying AIICO from N5 to N2.3 using the Dollar Cost Averaging (DCA) strategy
The yellow zone is my entry zone
I would love to hear from you.
Please like, comment, follow me and share
SelectQuote | SLQT | Long at $2.18SelectQuote NYSE:SLQT is currently resting within my historical simple moving average zone. This often signals consolidation and a future move (in this case, let's hope up). Looking at the company's financials, NYSE:SLQT is currently profitable. For Q3 2025 (ended March 31, 2025), the company reported a net income of $26.0 million, up from $8.6 million in Q3 2024. This follows a strong Q2 2025 with a net income of $53.2 million. While like most companies there are likely headwinds in 2025 (earnings are projected at a loss of -$0.20 per share due to seasonal fluctuations and investments in 2025 (e.g., new Kansas facility)), profitability is likely to stabilize in 2026, with EPS forecasts of $0.05, supported by improved Medicare reimbursement rates and operational efficiencies. Ongoing Department of Justice allegations could pose risks... but SelectQuote’s recent $350M investment and cost management suggest profitability may continue if legal issues are resolved favorably.
Thus, at $2.18, NYSE:SLQT is in a personal buy zone. There is a potential for the price to dip to the bottom of the historical simple moving average channel (near $1.25) in the near-term, but time will tell.
Targets:
$2.64
$4.24

eHealth | EHTH | Long at $4.22eHealth NASDAQ:EHTH , the largest online private health insurance marketplace, may be undervalued. The book value is listed around $19 a share and it has a debt-to-equity of 0.07x (healthy), a quick ratio of 2.5 (strong liquidity, can cover liabilities), growing revenue since 2021 (over $500M in 2024), and insiders have recently bought shares/awarded options. However, profitability is still a concern, but the company is expected to be profitable by 2026. With the US's aging population and the need for affordable healthcare coverage, eHealth *may* standout as a major insurance marketplace... but time will tell.
From a technical analysis perspective, the stock price is near the bottom of its historical simple moving average. I do not doubt, however, that the stock may slip to cover the small price gap between $3.09 and $3.23 (which will be another entry point if fundamentals do not change). This stock may trade sideways for some time. But it has a 27M float and as we saw in 2014 and 2020, it can REALLY get going if buyers see the opportunity...
Thus, at $4.22, NASDAQ:EHTH is in a personal buy zone with more opportunity potentially near $3 in the future.
Targets:
$6.00 (+42.2%)
$8.00 (+89.6%)

Follow Up To Lemonade VideoHi, all. Just posting the chart idea outside of my video as well. This way you can press that "play" button and track how my trade idea is doing in real time. I've always really liked this feature.
If you want more of the thesis behind why I like NYSE:LMND , please feel free to scroll through the video that I just recorded.
Here's to further strong price action!
Reagen

Lemonade, Inc. Showing Momentum - Lets Make Lemonade!Hey, everyone. Wanted to get a video out since it has been awhile. Sorry about the rustling in the audio - bear with me as it is not a theme throughout.
I am pretty excited about the momentum that NYSE:LMND is showing. I've been in it with a position for a little bit lately, and was fortunate to catch the previous pump with profit, but I think the momentum has a strong chance to continue here.
I pretty much cover all my thoughts behind the idea in the video, so feel free to scroll through it at your own rate. I will post it as a chart idea as well so that you can hit the play button and track how the idea is actively performing.
Hope you all were able to whether the tariff tantrum and hoping the market can maintain its current positioning, or, better yet, show continued strength.
Enjoy,
Reagen

Bearish potential detected for AIAEntry conditions:
(i) lower share price for ASX:AIA along with swing of DMI indicator towards bearishness and RSI downwards, and
(ii) close below the 200 day moving average, and
(iii) observing market reaction around the share price of $7.08 (open of 8th April).
Stop loss for the trade would be:
(i) above the high of the recent swing high once the trade is activated (currently $7.41 from the high of 8th May).

Gulf Insurance Group - Tadawul (Weekly Timeframe):Trade Idea: Demand Zone Reversal Play
Market Structure: Price has broken the ascending trendline and entered a bearish order block (marked in red). A short-term bearish move is expected.
Expected Move: Price may drop toward the Demand Zone (21.70–23.28) before a potential bullish reversal.
Key Levels:
📉 Support (Demand Zone): 21.70–23.28
📈 Potential Upside Target: 27.00 (first target), continuation possible if momentum builds
Narrative:
After the breakdown from the Order Block and trendline, price is likely to test the strong demand zone.
If the price respects the demand zone, a bullish reversal is anticipated, with the first target around 27.00.
This setup can offer a great buying opportunity with a favorable risk-reward ratio.
💡 Trade Plan Summary:
Wait for bullish price action (confirmation candle) near demand zone
Enter Buy near 23.00–22.00
Target: 27.00+
Stop Loss: Below 21.50 (below demand zone invalidation)

NN GROUP ($NN) Q4—INSURANCE CASH SHINES IN EUROPENN GROUP ( EURONEXT:NN ) Q4—INSURANCE CASH SHINES IN EUROPE
(1/9)
Good evening, TradingView! NN Group ( EURONEXT:NN ) is humming—H2 revenue hit $ 7.94B, topping estimates 📈🔥. Q4 earnings and a cash boost spark buzz—let’s unpack this Dutch dynamo! 🚀
(2/9) – REVENUE RUSH
• H2 Haul: $ 7.94B—beats $ 7.41B est. 💥
• Full ‘24: $ 12.36B—up 12% from $ 11.03B 📊
• OCG: $ 1.9B—hits ‘25 goal early
EURONEXT:NN ’s cash flow’s sizzling—steady wins!
(3/9) – BIG MOVES
• Buyback: $ 300M—shares get a lift 🌍
• Dividend: $ 3.44—up 8%, juicy payout 🚗
• Deals: $ 360M settled—risks trimmed 🌟
EURONEXT:NN ’s flexing—insurance muscle shines!
(4/9) – SECTOR SNAP
• P/E: ~10—below 11.9x avg 📈
• P/B: 0.57—vs. sector’s 1.04—cheap?
• Edge: 12% growth tops peers 🌍
EURONEXT:NN ’s a bargain—or just quiet strength?
(5/9) – RISKS ON DECK
• EPS Miss: $ 2.21 vs. $ 3.60—hiccup ⚠️
• Rates: Volatility stings returns 🏛️
• Climate: Claims could climb—yikes 📉
Solid run—can it dodge the bumps?
(6/9) – SWOT: STRENGTHS
• Cash: $ 1.9B OCG—rock solid 🌟
• Payouts: 8% divvy, $ 300M buyback 🔍
• Europe: 20% new biz—growth zip 🚦
EURONEXT:NN ’s a steady beast—built tough!
(7/9) – SWOT: WEAKNESSES & OPPORTUNITIES
• Weaknesses: EPS slip, Dutch lean 💸
• Opportunities: Eastern Europe perks 🌍
Can EURONEXT:NN zap past the risks?
(8/9) – EURONEXT:NN ’s Q4 cash surge—what’s your vibe?
1️⃣ Bullish—Value shines bright.
2️⃣ Neutral—Solid, risks hover.
3️⃣ Bearish—Misses stall it out.
Vote below! 🗳️👇
(9/9) – FINAL TAKEAWAY
EURONEXT:NN ’s $ 7.94B H2 and $ 1.9B OCG spark zing—insurance hums 🌍. Low P/E, but EPS wobbles—gem or pause?

BERKSHIRE HATHAWAY ($BRK.A) Q4—INSURANCE & CASH SHINEBERKSHIRE HATHAWAY ( NYSE:BRK.A ) Q4—INSURANCE & CASH SHINE
(1/9)
Good afternoon, TradingView! Berkshire Hathaway ( NYSE:BRK.A ) is humming—Q4 operating earnings soared 71% to $ 14.5B 📈🔥. Insurance and a record cash pile spark buzz—let’s unpack this titan! 🚀
(2/9) – EARNINGS SURGE
• Q4 Ops: $ 14.5B—up from $ 8.5B last year 💥
• Full ‘24: Insurance jumps 51%—key driver 📊
• Net: $ 19.7B Q4—profit stays juicy
NYSE:BRK.A ’s flexing—steady as she goes!
(3/9) – BIG MOVES
• Cash Hoard: $ 334B—up from $ 270B mid-year 🌍
• No Buybacks: Q4 skips—$ 7B spent earlier 🚗
• Apple Trim: Half sold off—cash king 🌟
Buffett’s stacking bucks—ready for action!
(4/9) – SECTOR SNAP
• Market Cap: ~$ 1.075T—top tier 📈
• P/B: 1.55—vs. JPM’s 1.9, Allstate’s 1.3
• Outrun: 25.5% ‘24 vs. S&P’s 25% 🌍
NYSE:BRK.A ’s a beast—value or peak?
(5/9) – RISKS IN SIGHT
• Stocks: Apple, Chevron swings—volatility nips ⚠️
• Succession: Buffett’s exit looms—jitters? 🏛️
• Economy: Rail, retail soften if cash tightens 📉
Solid, but not ironclad—watch out!
(6/9) – SWOT: STRENGTHS
• Diverse: Insurance leads—51% growth 🌟
• Cash: $ 334B—ultimate cushion 🔍
• Track: 19.8% CAGR—beats S&P’s 10.2% 🚦
NYSE:BRK.A ’s a fortress—built tough!
(7/9) – SWOT: WEAKNESSES & OPPORTUNITIES
• Weaknesses: Insurance lean, cash sits 💸
• Opportunities: Deals, yields lift—$ 14.5B zing 🌍
Can NYSE:BRK.A zap the next big win?
(8/9) – NYSE:BRK.A ’s Q4 surge—what’s your vibe?
1️⃣ Bullish—Cash rules, value shines.
2️⃣ Neutral—Solid, risks balance.
3️⃣ Bearish—Growth stalls, succession bites.
Vote below! 🗳️👇
(9/9) – FINAL TAKEAWAY
NYSE:BRK.A ’s $ 14.5B Q4 and $ 334B cash spark zing—insurance flexes 🌍. Premium P/B, but steady wins—champ or chill?

TASI - 8240 : CHUBB ARABIA COOPERATIVE INSURANCE CO - 2 DEC 2024Bullish Bias for TASI - 8240 : CHUBB ARABIA COOPERATIVE INSURANCE CO on 2 DEC 2024.
Buy at 48.4 with Stop Loss at 46.
TP-1 = 50.2, TP-2 = 52.0

Santam triangle broken above - Looks good to R406.22Symmetrical Triangle has formed on Santam and it looks like the uptrend wants to continue.
We have a strong high Probability Trade lineup with the Price>20 and 200MA'
First target at R406.22

Sanlam broken above W Formation and new target setW Formation formed on Sanlam and the price has broken above the neckline.
Nature: High Probability
Price>20 and 200MA
Downtrend broken which tells us the bulls are in charge (action line)
Target R97.11

HDFCLIFE: Interesting Price Action!The chart is self-explanatory as always :)
If you'd like to request an analysis, simply send us 100 coins as a token, and we'll be happy to post one for you.
⚠️Disclaimer: We are not registered advisors. The views expressed here are merely personal opinions. Irrespective of the language used, Nothing mentioned here should be considered as advice or recommendation. Please consult with your financial advisors before making any investment decisions. Like everybody else, we too can be wrong at times ✌🏻

Old Mutual trading styles for buys - Target R13.70There are many different ways to trade Old Mutual looking at this chart.
1. Reversal trader
They will wait for the support to establish as it's done at R10.00 and then will buy and hold until it reaches the top of the range.
2. Breakout trader
WIll wait for the price to go up and complete the W Formation where it will breakout and trade up to R13.70
3. High probability trader
This one will have to wait the longest for the price to not only close above the W Formation but also close above the Downtrend and the 20MA and 200MA.
Either way, Old Mutual does look bullish as things stand.
Enjoy!
