Review and plan for 3rd December 2025 Nifty future and banknifty future analysis and intraday plan.
yesbank.
This video is for information/education purpose only. you are 100% responsible for any actions you take by reading/viewing this post.
please consult your financial advisor before taking any action.
----Vinaykumar hiremath, CMT
Intraday

What do you think about gold’s movement today?Hello traders!
What do you think about gold’s movement today?
Market Context
This morning, the Fed Chair delivered a speech without mentioning any economic updates. Despite that, gold still showed a corrective move, indicating that the SELL side remains dominant at the moment.
Main Strategy for Today
Prefer SELL setups
Stop selling only if price breaks above 4,246 — a key level defended by sellers.
Consider SELL entries at the previous high 4,265.
Additional SELL reaction zone to watch: 4,227 – 4,225.
BUY on deeper pullbacks
Ideal BUY zone: 4,194 – 4,190
closer BUY zone: 4,209 – 4,206
→ Only BUY if strong support reactions or reversal patterns appear.
Risk Management
Stop Loss (SL): 100 pips
Take Profit (TP): 100 pips
→ Maintain consistent risk throughout the session.
Do you think gold will continue to face bearish pressure and break lower,
or will it bounce from these deeper support zones and regain momentum?

XAUUSD - Intraday trade set up - 02-12-2025Intraday trade set-up, it can be a good intraday trade, but make sure you follow your risk management.

a Risky QuickScalp on #EURUSD📌 Market Insight: {#EURUSD }
⚠️ Risk Assessment: {High}
🚀 Approach:
Not a Quality setup and market seems need time be sorted out .
We can have it as a Quickscalp by a nice valid momentum Structure .
#Ash_TheTrader #Forex #GBPJPY #MarketAnalysis #TradingSetup #RiskManagement #GOLD #Scalper #NQ #EURUSD

Review and plan for 1st December 2025 Nifty future and banknifty future analysis and intraday plan.
Stock analysis- KAYNES
This video is for information/education purpose only. you are 100% responsible for any actions you take by reading/viewing this post.
please consult your financial advisor before taking any action.
----Vinaykumar hiremath, CMT

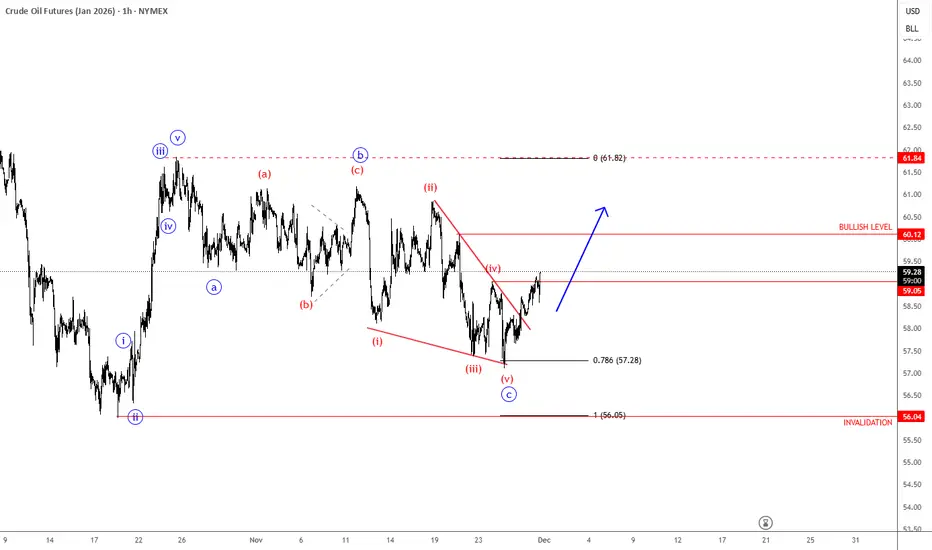
Crude Oil Has Finally Finished An Intraday Corrective SetbackCrude oil made a very strong rebound back in mid-October with an impulsive move of more than 11%, while the current retracement from 62 is very slow, which still suggests a counter-trend movement despite the weakness now retesting the 78.6% support levels. We can still see three waves down, and ideally subwave c is coming into a potential support zone, so a rebound can still happen while the market trades above 55.96 invalidation.
Looks like Crude oil is finally on the way back to October highs, as we see a sharp and impulsive rebound from the 78,6% Fibonacci retracement after a completed wedge pattern. So be aware of more intraday gians, especially if breaks back above 60 level, just watch out for pullbacks.
GOLD broke out of the H4 trendline — real breakout or trap? Hello Traders! 👋
Gold has broken out of the H4 descending trendline, boosted by geopolitical tension and a weaker USD.
But the real question is: Is this a true breakout or just FOMO before a drop?
Here are the key zones I’ll be watching today:
BUY Zones (SL 10 – TP 10)
• 4165 – 4155
• 4170 – 4175
• 4140 – 4145
• 411x
• 4099
SELL Reaction Zones (SL 10 – TP 10)
• 4200 – 4203
• 4212 – 4215
• 4230
• 4245 – 4247
👉 If price breaks below 4133, the trendline fails → potential sell-continuation setup.
📌 Bias: BUY is the main play — SELL only for short reaction scalps.
💬 What do YOU think — real breakout or classic bull trap? Drop your thoughts below!
❤️ Let’s discuss & grow together!

TRADING PLAN XAUUSD 22/11/251. Main Market Context for Today
Jobless claims came in better than expected → USD strengthens, but gold did not drop — it continued to move sideways → the market is in accumulation and waiting for a breakout.
Today’s priority strategy is range trading:
Lower range: 4130–4135
Upper range: 4170–4175
Once price breaks clearly out of either range → switch to trend-following (pursuit) trading.
2. Range-Trading Plan (Primary Strategy for Today)
(A) Buy at the Lower Range – 413X Zone
Buy area: 4130–4135
SL: 100 pips
TP: 100 pips
Reason: This is the main demand zone and aligns with the ascending trendline shown on your chart.
➡️ Strategy:
Wait for price to “sweep” the lows → show confirmation → then take a quick BUY trade.
(B) Sell at the Upper Range – 417X Zone
Sell area: 4170–4175
Reason: Strong supply zone with repeated reactions.
➡️ Strategy:
Wait for a rejection candle (pin bar / bearish engulfing) → then SELL.
3. Current Reaction Zone – 414X
This is the zone price is currently testing.
Do not enter immediately; just observe:
If price bounces strongly from 414X → target is to retest 417X
If 414X breaks → price will likely retest 413X → better BUY entries there.
4. Deeper BUY Zones (If Price Breaks Downward)
Here are the levels you mentioned, organized clearly:
BUY Zone
4110–4108
4102–4100
4096–4094
→ These are deeper liquidity zones below the main range, activated only if gold breaks below 413X.
5. SELL Zones if Price Breaks Upward (Above 417X)
SELL Zone
4202–4200
4192-4195
4183–4180
→ These are upper supply retest zones, activated only after price breaks above 417X.
6. Main Scenarios for Today
Scenario 1 – Expected Sideway (Highest Probability)
Price moves within 413X – 417X, bouncing between the range limits.
→ Trade the range (scalp/intraday).
Scenario 2 – Break Below Range
If 4130 breaks → price will head to 4110 → 4100 → 4094
→ BUY at deeper zones.
Scenario 3 – Break Above Range
If 4175 breaks → price will aim for 4183 → 4194 → 4200–4202
→ SELL at higher zones.
✅ One-Line Trading Summary
Trade primarily within the 413X–417X range (buy low – sell high). If the range breaks, switch to trend-following using the deeper BUY zones or higher SELL zones provided above.

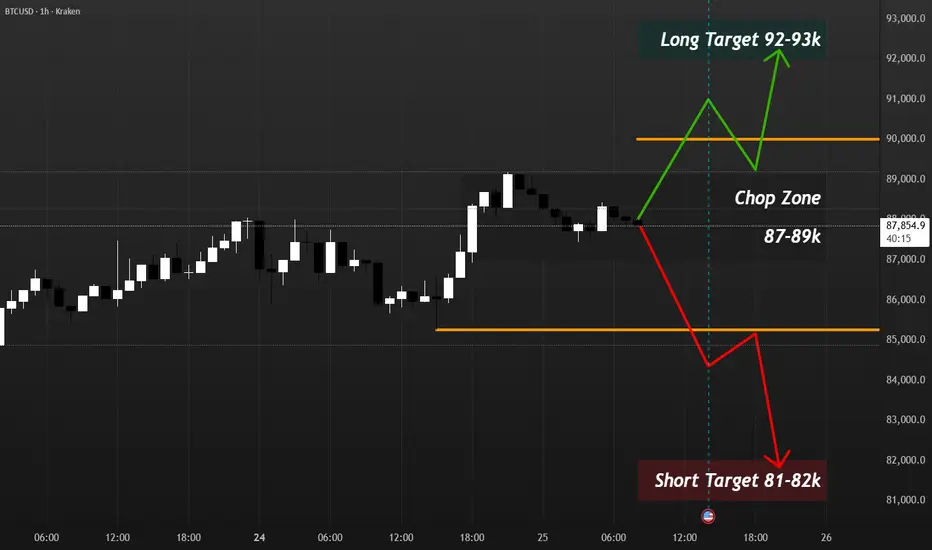
FED days are for levels, not direction.FED days are for levels, not direction. Above 90k I respect the squeeze; below 85.3k I respect the breakdown. Map, not signal.
KRAKEN:BTCUSD BTC is chopping around 88k just under a 1h channel top into FED today/tomorrow. ETF flows look soft and options positioning still leans defensive.
I’m not opening new trades into the announcement. Anything stuck between 87–89k post-FED is a no-trade chop zone for me.
Post-FED: if BTC holds above 90k I’ll only look for pullback longs with 92–93k as context; if it loses 85.3k and can’t reclaim, I’ll lean into shorts toward 82–81k. Map, not signal.
HOW FAR WILL GOLD RISE?1. MARKET CONTEXT
Yesterday, during the Asian and European sessions, gold prices mainly moved sideways – accumulating within a narrow range.
In the U.S. session, gold prices broke strongly through the 413X region and formed:
Inverse Head and Shoulders pattern (iH&S)
The upward structure returns → buyers dominate
This indicates that the upward momentum has returned, and the market leans towards continuing to rise if it does not break the important support area.
Fundamental factors supporting buyers
The market is expecting the Fed to cut interest rates in December.
Tonight there is PPI news — an important indicator directly affecting inflation expectations and Fed expectations.
→ This could be a catalyst for strong volatility in the U.S. session.
2. MAIN TRADING DIRECTION FOR THE DAY
➡️ Prioritize BUY (look to buy) according to the main trend.
➡️ SELL is only reactive – for retracement, not the main trend.
3. POTENTIAL BUY ZONES
Beautiful support areas to look for buying opportunities today:
📍 BUY zone 1 – Nearest
413X (early day resistance and yesterday's breakout area)
→ Beautiful entry area for scalping or buy follow trend.
📍 BUY zone 2
4100 – 4103
→ Psychological support & structural confluence area.
📍 BUY zone 3
4088 – 4090
📍 BUY zone 4
4060 – 4065
→ Strong support area, look to catch the bottom in case of deep price correction.
4. REACTIVE SELL ZONES (ONLY SELL FOR RETRACEMENT)
Only sell when price hits the area — clear rejection signals appear:
📍 SELL zone 1 (nearest)
4180 – 4186
📍 SELL zone 2
4190 – 4195
📍 SELL zone 3
4202 – 4205
Safe SELL conditions:
Only sell counter-trend, prioritize scalping.
If these areas are strongly broken + H1/H4 candle closes, consider buyers winning, then do not sell anymore.
5. CAPITAL MANAGEMENT – RISK MANAGEMENT
SL = 10 points
TP = 10 points
RR ratio = 1:1.2
Do not hold positions through PPI news if not really sure about the pattern.
6. NOTES ON METHOD
Buy orders will dominate the day.
Sell only when there is a strong reaction at resistance.
Scalping: open orders on smaller timeframes (M1–M5–M15) to optimize Entry.
Always wait for price action confirmation (pinbar, engulfing, retest…) before entering orders.
7. SUMMARY
Today's tendency is mainly BUY, based on:
The return of the upward trend
Inverse Head and Shoulders pattern
Expectations of a dovish Fed
PPI news triggering volatility
Wishing everyone an effective trading day — total victory! 🔥💹

Does gold need more news to determine the main trend?Over the weekend, gold continued to move in an accumulation pattern – sideways, without forming a strong trend. It is expected that today the price will still fluctuate within the range of 4030 – 4109 (may deviate by 1–2 points). Therefore, the best strategy is to watch and trade within the range.
🔻 PRIORITY SELL ZONE
Watch for short sells when the price hits the following resistance areas:
4148-4150
4130-4133
4100-4103
4109-4112
4067 – 4065 (nearest area)
→ SL: 10 points | TP: 10 points
🔺 PRIORITY BUY ZONE
Watch for short buys at strong support areas:
4040 – 4042
4025 – 4020
3965 – 3960
→ SL: 10 points | TP: 10 points
📌 Important Note
Today, prioritize trading within the Sideway range, as the price may continue to accumulate.
When the market breaks 4030 or 4109 with a strong candle, consider chasing buys or sells in the breakout direction.
Within the range, the most effective strategy remains short reversal scalping according to the zone.

S&P 500 E-mini Futures: Short Target Achieved, Long Setup 21.Nov
S&P 500 E-mini Futures: Short Target Achieved, Long Setup in Play
Today’s session on the S&P 500 E-mini Futures (ES) presented a textbook example of how patience and planning pay off in intraday trading. Let’s break down the trade idea, execution, and the next steps.
Market Context
Instrument: S&P 500 E-mini Futures (ESZ2025)
Current Price: 6,547.25 (-0.16%)
Timeframe: 15-minute chart
Session Behavior: After an initial push higher, the market showed signs of exhaustion near the previous high, creating an opportunity for a short scalp before considering a long re-entry.
Trade Recap: Short Position
Earlier today, a short position was initiated near the supply zone (highlighted in red on the chart) around 6,594.50, targeting a retracement toward the mid-range.
Entry: Around 6,594.50
Target: 6,532.25 (achieved successfully)
Reasoning: Price rejected the upper liquidity zone, forming lower highs and signaling a short-term bearish move. Volume spikes confirmed selling pressure.
This short trade hit its target cleanly, validating the setup and risk management.
Current Setup: Long Bias
With the short target achieved, the focus now shifts to a long re-entry. Here’s why:
Demand Zone: Price reacted strongly near 6,532.25, sweeping liquidity and bouncing back.
Volume Profile: Notice the spike in buying volume at the lows, suggesting accumulation.
Structure: The market is forming a higher low on the 15-minute chart, indicating potential bullish continuation.
Long Plan
Entry Zone: Between 6,532.25 and 6,528.25 (green zone)
Stop Loss: Below 6,523.25 (to protect against deeper liquidity sweep)
Target: Sweep of the day’s high near 6,604.75 or equal highs at 6,594.50 for partials.
Key Observations
Liquidity Sweep: The wick below 6,532.25 suggests stop hunts before reversal.
Risk-to-Reward: Favorable setup with tight stop and clear upside targets.
Market Sentiment: Despite intraday volatility, the broader trend remains bullish, supporting the long bias.
Conclusion
The short scalp was a success, and now the market offers a compelling long opportunity. Traders should monitor price action closely around the demand zone and manage risk diligently. If the bullish momentum holds, a sweep of the day’s high is likely.
✅ Pro Tip: Always wait for confirmation before entering a reversal trade. Volume and price structure are your best friends in identifying genuine shifts in momentum.
Do your own analysis before taking any decisions these are only my way of looking at the market today and valid for today only

Wait…are we bullish?Hello traders! Here’s a technical chart breakdown for AUD/USD based on current structure, trend, momentum, and supportive macro data. (Note: this is analysis, not a guarantee. Always manage risk.)
⸻
Market Overview
Going into the weekly close, AUD/USD created a new November low on Thursday, but price recovered strongly and closed near Friday’s highs — a sign of bullish intention.
If this momentum continues, we’re looking at:
• Intraday potential: ~40 pips
• Swing potential: ~100 pips, if price breaks out of the current downward channel
Our first target aligns with previous support from earlier this month, while the secondary swing target sits at a key higher-timeframe resistance level that price may revisit.
⸻
📌 Trade Idea (Long AUD/USD)
• Entry: 0.64450
• Target 1: 0.64850 (+40 pips)
• Target 2: 0.65250 (+80 pips)
• Stop Loss: 0.64050 (–40 pips)
Risk-to-Reward
• To T1: 1:1
• To T2: 1:2.5
⸻
📈 Technical Breakdown
Structure
There is a large expanding wedge forming (not shown on the chart), which can act as a bullish continuation pattern if price breaks to the upside. This would support a larger measured move.
Momentum
• RSI: Currently recovering from oversold conditions, supporting bullish continuation.
• On the daily timeframe, RSI has been trending higher without reaching overbought zones — leaving room for further upside.
Invalidation
• A break below 0.64050 (our stop loss area) would invalidate the bullish structure and indicate a bearish shift.
⸻
📰 Fundamental Support: Australia Labor Market
Australia’s latest labour data came in stronger than expected, adding confidence to the bullish bias:
• Employment increased by +42,000 (doubled expectations)
• Full-time jobs rose
• Unemployment rate fell by 0.2%
Stronger labour numbers reduce the odds of near-term RBA rate cuts and support AUD strength.
⸻
📅 What’s Next?
We’ll be monitoring price action next week for additional confirmations and potential long setups. A breakout above the channel + sustained bullish momentum would increase the likelihood of reaching T1 and T2.

Gold Buyers Regaining Control - Market Poised for UpsideHello Followers, I am going to share you my opinion on gold next move..
Gold continues to show strong bullish structure after holding above the key support zone between 4030 – 4050. This demand area has repeatedly attracted buyers, confirming it as a reliable base for the next upward leg. As long as price remains above this zone, the market bias stays firmly bullish.
A breakout above 4100 activates a high-probability buy setup, signaling renewed momentum from institutional buyers. If price sustains above the entry level, Gold can extend toward the first major resistance around 4170, where buyers may take partial profits. The broader market environment also supports bullish strength, with safe-haven demand increasing and overall market sentiment favoring upside movements. Volatility may rise, but the trend structure remains intact as long as the price does not break below the 4000 stop loss level, which marks the deeper structural support.
KEYPOINTS:
Entry-level 4086
Target level 4170
Support area 4030/4050
Stop loss level 4000

Bearish Reversal Expected from Key Resistance ZoneHello Followers, I am going to share you my opinion on gold next move..
Currently gold is running at 4035.. Price has approached a strong Resistance Area, where previous candles have repeatedly failed to break higher. The current market structure shows exhaustion near this resistance zone, indicating a potential reversal. Once price reacts from the resistance, we expect it to form a lower high and continue dropping toward the marked Target Area around the 3940. This creates a high-probability sell setup... If gold do not respect the resistance and break it then we have a Stoploss point there..
KEYPOINTS:
Entry-level 3935
Target Area 3940
Resistance area 4050/4065
Stop Loss Point 4090

WILL GOLD CONTINUE TO DROP?1. Market Context Yesterday, gold was almost in accumulation throughout the Asian–European session and only broke out strongly in the latter half of the US session.
After breaking out of the accumulation zone, the price dropped sharply to around 4006 – a key level – and rebounded strongly from there.
However, statements from FED members remain hawkish, affirming the stance of keeping interest rates high for longer and not considering rate cuts.
This creates
- Downward pressure on gold
- Capital flow leaning towards USD
------>>Market sentiment favors SELL on price recovery
➡️ Conclusion: Today, the main scenario remains SELL in line with the trend, BUY is only a secondary strategy & short scalp when reaching strong support.
🎯2. Today's Trading Scenario
(SL: 10 points TP 10 points. RR ratio:1-2/1:3/1:5)
🔻 Main SELL (priority)
SELL Zone:
4050 – 4055
4075 – 4080
4105 – 4110
🟦 Secondary BUY
BUY Zone:
3996 – 3994
3965 – 3960
3935 – 3930
3895 – 3890

XAU/USD TRADING PLAN 11/17/20251️⃣ CONTEXT
Last Friday saw a drop of ~200 points → confirming strong selling pressure.
Today, there are no major news releases, potential movement:
Wide sideways 4030–4120
Sell bias (prioritize selling at high zones)
The major trend remains in a downward channel, with rebounds mainly for unloading.
2️⃣ GENERAL RULES
SL: 10 points for all trades
TP: 10 points for all trades
3️⃣ MAIN SELL ZONES
4120–4125
4146–4148
4160–4165
4182–4185
4210–4215 (strongest resistance of the day)
4️⃣ BUY ZONES (FOR REBOUND)
4056–4050
4033–4030
3996–3994
3966
3888
5️⃣ SUMMARY
Bias: Sideways → prioritize Sell.
Sell at resistance zones, Buy at strong support zones.
SL/TP adjusted according to RR ratio 1:1, 1:2
Pay attention to appropriate volume

XAUUSD H1 – Watching 4178 & 4158 for the next impulsive reversalAfter reacting cleanly from the 4232–4236 Supply OB, Gold confirmed a shift in intent with a sharp CHoCH → BMS sequence, showing that buyers were trapped in premium and Smart Money has rotated the market back toward discount zones.
The current structure suggests that price is seeking mitigation + liquidity below before any meaningful continuation.
Two key Buy Zones stand out on the chart:
💎 Key Technical Zones
OB BUY ZONE 4178–4174 (SL 4170)
→ First discount reaction zone and potential intraday long setup if M5 CHoCH confirms.
OB BUY ZONE 4158–4154 (SL 4148)
→ Deeper mitigation area aligned with the previous displacement leg and liquidity resting below.
OB SELL ZONE 4232–4236 (SL 4242)
→ Proven supply zone where yesterday’s reversal began.
As long as price holds above the new Lower Low (4156), the broader structure remains corrective rather than bearish — setting the stage for a possible continuation toward 4205 → 4230 after liquidity is collected.
🪶 Execution View
I’m waiting for price to dip into one of the Buy Zones, sweep liquidity, and show confirmation before looking for longs.
Chasing price in premium offers no edge — value lies in patience and reaction. 🌙
💭 Karina’s Note
Smart Money always rotates price from premium to discount before continuing.
Read the intent, not the impulse. 💛
This is my personal view based on SMC principles – not financial advice.
✨ Like & Follow for daily Plan updates ✨

Will gold continue to rise? XAUUSD forecast 10/14/251. Fundamental Analysis
Yesterday, gold dropped ~100 points from 4248 → 4145 due to information that after the US Government reopens, some important economic data (CPI, employment) might not be released on schedule.
This has lowered the expectation of a December rate cut to <50%, causing a technical adjustment.
➡ The major trend is still upward – today prioritize BUY.
Key level: 4208–4213
Above 421x: end of adjustment → prioritize BUY.
Below 421x: price may retest a lower BUY zone.
2. BUY zones (priority) – SL 10 points, TP 10–20 points (RR 1:1 → 1:2)
zone 1 : 4140–4143
Zone 2: 4134–4130
zone 3: 4120–4112
3. SELL reaction zones – SL 10 points, TP 10 points (RR 1:1)
zone 1: 4245–4248
zone 2: 4280–4285
zone 3: 4300–4305
4. Notes
Today is Friday → trade safely, quick TP.
Do not chase orders, only enter when price hits the zone.

Review and plan for 14th November 2025 Nifty future and banknifty future analysis and intraday plan.
Quarterly results- analysed.
This video is for information/education purpose only. you are 100% responsible for any actions you take by reading/viewing this post.
please consult your financial advisor before taking any action.
----Vinaykumar hiremath, CMT

BTCUSDT.P - November 13, 2025BTCUSDT.P has formed a consolidation base above $101,600, indicating accumulation and potential for further upside toward the $103,685 partial profit zone and the $105,297 profit level.
A decisive close above $103,700 would confirm bullish momentum continuation, while failure to hold above $100,700 could expose the pair to renewed selling pressure toward $99,200.
Risk Assessment: Moderate — The price structure suggests potential bullish recovery from oversold levels, but the setup remains vulnerable to downside continuation if support near $100,700–$100,000 fails to hold. Traders should consider moving stops to breakeven once the $103,685 level is reached to manage risk effectively.

XAU/USD OUTLOOK – TODAY 11/13/25The U.S. House has approved the reopening of the government, now awaiting President Trump's signature. This means U.S. economic data will gradually be released again, promising a week of strong and unpredictable volatility.
Technically, gold maintains an upward trend after breaking the H4 sideways boundary, but signs of overbought conditions and H4 peak divergence are emerging.
In smaller frames (M30 – H1), light divergence is also starting to appear, so BUY positions need to select favorable zones and avoid FOMO. SELL should only be short reactive trades.
🎯 Daily Scenario
Morning
Expect sideways movement ~30 points within the 4180 – 4212 range
You can WATCH FOR TRADING WITHIN THIS RANGE
if the price breaks through 4212, consider waiting for a retest back to 4205 to buy up.
Afternoon
Wait for gold to adjust to reasonable BUY zones:
4160 – 4162
4152 – 4148
4123 – 4120
If there is a strong adjustment:
Beautiful BUY at 4070 – 4040 (deep support zone).
🎯 Target increase:
4280 – 4285
4300 – 4305
🎯 Reactive SELL:
4255, 428X, 430X
(SL 10 – TP 10)
⚠️ Important Note
The overall trend remains uptrend, but attention is needed:
H4 shows signs of overbought + peak divergence.
M30 – H1 shows light divergence, indicating the market may have a short adjustment before continuing to rise.
BUY should only be entered at beautiful support zones, if you see a bad candle → close short and exit quickly.
SELL is only reactive at strong resistance zones, do not hold long.

XAUUSD H1 – Liquidity Sweep & Smart Reentry ZoneAfter a strong impulsive rally, gold reached the premium zone (1.5–1.618 extension) and created a set of Equal Highs (BSL) — a clear liquidity pool above 4148.
I’m anticipating a short-term retracement before continuation, as smart money often rebalances after grabbing liquidity.
🔹 Technical Breakdown (SMC Flow)
Sell Zone (Supply / OB): 4224 – 4228 (SL 4235)
→ Price reached the extreme of a premium H1 OB, aligning with FIB 1.5–1.618.
→ This area remains a valid sell-to-buy reaction zone if M15 shows a CHoCH.
Buy Zone (Demand / OB): 4086 – 4082 (SL 4070)
→ Confluence with 0.5–0.618 retracement and previous structure base.
→ Expecting sell-side liquidity sweep into this zone before a bullish continuation.
Target Zone: 4158 – 4160
→ The next Buy-Side Liquidity (BSL) resting above Equal Highs.
→ Ideal take-profit area for intraday longs from discount levels.
📈 My View
The bias remains bullish on H1, as long as 4070 holds.
I’ll patiently wait for a liquidity sweep into BUY zone followed by a clear M15 CHoCH confirmation — that’s where I’ll look for entries toward 4158–4160.
💭 Note from Karina
This structure perfectly reflects how liquidity drives movement — not emotion, not indicators.
Patience and precision are the true edge of a trader.
This is my personal view based on SMC principles – not financial advice.
Like & Follow for daily London session updates 💛
