XAUUSD Intraday Plan | Key Levels UpdatedI’ve updated our technical levels. Gold rallied strongly, reaching 4888, before a minor pullback into the 4847 support.
If the 4883 level continues to hold as resistance, we may see a much-needed pullback into lower levels. That said, the broader structure remains very bullish, so a deep retracement is not expected. Instead, pullbacks are likely to be shallow, with quick dips potentially followed by continuation higher.
📌Key levels to watch:
Resistance:
4883
4928
4970
5000
Support:
4847
4808
4764
4722
4685
👉 Let key levels guide your decisions — wait for confirmation and manage risk accordingly.
🔎Fundamental focus:
WEF Day 2 is in focus today, with Trump scheduled to speak. Headlines from the event may drive high volatility.
Intradaylevels

XAUUSD Intraday Plan | Technical Levels to WatchGold failed to break above the MA50 on Friday, which was followed by a move lower to test the MA200, where buyers stepped in and triggered a bounce.
Price is now trading just below the 4600 resistance. To see another push higher, gold needs to reclaim 4600 and the MA50, which would open the door for a move toward the 4637 resistance. A clean break above 4637 would expose higher levels.
Failure to reclaim 4600 would likely lead to a deeper pullback into the first reaction zone. If selling pressure builds further, watch the lower support levels for potential bullish reactions.
📌Key levels to watch:
Resistance:
4600
4637
4664
4690
4722
Support:
4564
4537
4497
4455
4419
👉Let key levels guide your decisions — wait for confirmation and manage risk accordingly.
🔍 Fundamental Focus
Trade tensions remain elevated after the US applied tariffs linked to the Greenland dispute, set to take effect from February 1st, prompting a strong response from the EU and raising broader trade risk.
As these announcements were made while markets were closed, today’s open may see increased volatility and potential gaps, especially in gold as a safe-haven asset.

XAUUSD Intraday Plan | Key Levels Near ATHAnother day, another ATH for gold. Price is currently trading near the 4630 resistance, attempting another push higher. A confirmed break above this level would open the door toward the 4664 as the next upside target.
If price fails to reclaim this area, a healthy pullback may follow into the first support zone, where the MA50 may provide dynamic support. Should selling pressure build further, a deeper retracement could bring price into the lower support zones, where buyers are likely to step back in.
📌Key levels to watch:
Resistance:
4630
4664
4690
Support:
4585
4537
4492
4469
👉Let key levels guide your decisions — wait for confirmation and manage risk accordingly.
🔎Fundamental focus:
Markets are focused on US inflation and consumption data today, with Core PPI, PPI, and Retail Sales in the spotlight. These releases will provide insight into inflation pressures and consumer strength, which can influence USD sentiment and drive volatility in gold.

XAUUSD Intraday Plan | Recovery Attempt | 4404 in FocusGold played out as per yesterday’s analysis. The first reaction zone failed to hold, triggering a quick sell-off into lower liquidity. Price found support at the HTF support zone and is attempting a recovery, currently trading around 4368.
If buyers can maintain pressure from here, the next key test is 4404 resistance. A confirmed break and hold above 4404 would shift intraday bias back to the upside and open the door for a move into the upper levels.
If momentum slows or buyers struggle to follow through, watch 4347 as the immediate support. A clean break below 4347 would likely invite another attempt into the HTF support zone—and if that base fails, the risk increases for a deeper sell-off.
📌Key levels to watch:
Resistance:
4404
4433
4467
Support:
4347
4317
4281
🔎Fundamental Focus:
Markets are watching the FOMC Meeting Minutes later today, year-end holiday liquidity remains thin, increasing the risk of sharp but unsustained moves.

XAUUSD Intraday Plan | New Highs but Momentum SlowsGold printed a fresh high during the Asian session, tapping into 4524 resistance, before sharply retracing. Price is now trading around 4489, sitting just below the 4493 resistance while still holding above the MA50.
If gold can reclaim and hold above 4493, we could see another attempt back toward 4524. If sellers continue to step in, a deeper pullback toward the MA50 and lower support levels becomes likely — and if the MA50 gives way, the drop could extend further.
Note: With an early close today and markets closed tomorrow for Christmas, thinner liquidity could lead to exaggerated moves and wider spreads, so manage risk accordingly.
📌Key levels to watch:
Resistance:
4493
4524
Support:
4460
4422

XAUUSD Intraday Plan | Bulls Need 4334Gold played out in line with the analysis. The reaction zone held as support, and the confirmed break above 4301 delivered the move into 4334 as expected.
Price is now trading around 4325, with 4334 acting as the immediate resistance. A confirmed break and hold above 4334 would keep momentum alive and open the path toward 4362, with 4395 as the next upside extension if buyers stay in control.
If price fails to clear 4334 again, expect another rotation lower — in that case, focus shifts back to the lower levels for the reaction.
📌Key levels to watch:
Resistance:
4334
4362
4395
Support:
4301
4270
4237
4185

XAUUSD Intraday Plan | Can Bulls Sustain the Move?Friday we saw gold sharply retrace after tagging the 4352 area. Price is now attempting to push higher again, currently trading around 4344 and holding just above the 4334 level.
A sustained break above 4334 would keep bullish momentum intact and open the path toward 4362, with further upside into 4395 if momentum holds.
On the downside, if 4334 gives way, the First Reaction Zone becomes the first area to watch for a bounce. If selling pressure extends and 4270 fails, then focus shifts to the Support Zone as the next potential area where buyers could step back in.
📌Key levels to watch:
Resistance:
4362
4395
Support:
4334
4301
4270
4237
4185
🔎Fundamental focus:
This week is packed with high-impact U.S. data, including Retail Sales, PMI readings, CPI, and key labour market updates. Expect increased volatility and sharp intraday swings as markets reassess inflation and rate expectations. Risk management is key, especially around data releases.

XAUUSD Intraday Plan | Powell Spike Fades, 4219 Back in FocusWe saw a solid push into the 4,251 resistance yesterday following Powell’s speech, but the move was short-lived. Price retraced all gains during the Asian session and is now trading around 4,215 — once again sitting below the 4,219 resistance.
The overall outlook remains unchanged:
Buyers must reclaim the 4,219 resistance to target 4,251, with 4,285 becoming achievable if momentum strengthens.
If selling pressure builds, we could see the 4,185 Reaction Zone tested again. A break below 4,185 would expose the Support Zone, where buyers may look to react.
📌Key levels to watch:
Resistance:
4219
4251
4285
Support:
4185
4144
4102

XAUUSD Intraday Plan | Gold Holds Range Ahead of FOMCGold remains range-bound between 4219 and 4185, showing no clear commitment from buyers or sellers. A decisive breakout on either side will be needed to define the next intraday direction.
A break above 4219 would open the path toward 4251, and with strong momentum, potentially 4285.
However, if 4185 fails, price may drift back into the Support Zone. Should selling pressure increase, the HTF Support Zone may come into play as the next major area for buyers to respond.
📌Key levels to watch:
Resistance:
4219
4251
4285
Support:
4185
4144
4102
4049
4014
🔎Fundamental focus:
All eyes are on today’s FOMC decision — the key catalyst markets have been waiting for. Expect heightened volatility as traders react to the rate statement, projections, and Powell’s remarks.

XAUUSD Intraday Plan – Recovery Attempt or More Downside?Gold is attempting to recover after Friday’s drop, currently trading around 4213. Price is being supported by the MA200, while the MA50 is flattening, signaling reduced momentum for now.
The immediate resistance sits at 4219 — a confirmed break and hold above this level would open the path toward 4251.
If price fails to clear the 4219 resistance, a full retest of the First Reaction Zone becomes likely. If that zone fails to hold, we could see price slide deeper toward the Support Zone, where buyers may attempt to step back in.
📌Key levels watch:
Resistance:
4219
4251
4285
Support:
4185
4144
4102
🔎Fundamental focus:
This week the spotlight is firmly on the FOMC meeting, projections, and Powell’s statement. Until the FOMC is out, markets may remain choppy and directional follow-through could be limited. Manage risk carefully — spreads and volatility tend to expand significantly around these releases.

XAUUSD Intraday Plan | 4232 Still the Key LevelWe saw another bounce from the reaction zone yesterday. Gold has been ranging for most of the week, bouncing between the reaction zone and the 4232 key level.
My intraday plan has not changed: bulls need a confirmed break above 4232 to open the path towards 4274 and 4322.
If 4232 holds as resistance and we see another rejection, I expect price to rotate back into the reaction zone. A clean break below that zone would expose the lower support area and potentially HFT support.
📌Key levels to watch:
Resistance:
4232
4274
4322
Support:
4185
4141
4102
4049
4014
3966
🔎Fundamental Focus:
Today’s US session is packed with red-folder news: Core PCE (the Fed’s preferred inflation gauge), UoM consumer sentiment and inflation expectations, as well as personal income and spending. Expect increased volatility and spikes around the releases, and manage risk accordingly.

XAUUSD Intraday Plan|Will Buyers Defend the Reaction Zone?Gold once again failed to reclaim the 4232 resistance yesterday.
Price tested the level but reversed sharply as sellers stepped in. We now have another test of the Reaction Zone, and price is also trending below the MA50, with the MA200 likely to be tested next.
The 4232 resistance remains the key level buyers must reclaim to attempt another push higher.
On the downside, if the MA200 and the First Reaction Zone fail to hold, watch the Support Zone. If selling pressure continues, the HTF Support Zone becomes the next area where buyers may show a stronger reaction.
📌Key levels to watch:
Resistance:
4232
4274
4322
Support:
4185
4141
4102
4049
4014
3966
🔎Fundamental focus:
High-impact news on the calendar today — expect volatility. Manage risk accordingly.

XAU/USD Intraday Plan | Bulls Eye 4285 After 4153 BreakoutAfter a short consolidation phase, gold broke above the 4153 resistance and extended higher, now trading around 4236. A clean break and hold above 4234 could open the path for the next resistance at 4285.
If bullish momentum fades, watch the MA50 for potential dynamic support and the Pullback Zone (4153–4115) for a possible retracement area.
Failure to hold that zone could trigger a deeper move toward lower support levels.
📌Key Levels to watch:
Resistance:
4234
4285
4322
Support:
4197
4153
4115
4074
4027
🔎Fundamental Focus:
Today’s calendar is light on major economic data, but multiple FOMC members are scheduled to speak, which could provide hints on future monetary policy direction.

XAU/USD Intraday Plan | Gold Stalls Below 4153 ResistanceGold is currently trading around 4118 after a strong rally from the 4027 breakout. Buyers appear to be pausing after several failed attempts to clear the 4153 resistance, with price now consolidating just above the 50MA, which is acting as short-term dynamic support.
We need confirmed break above 4153 resistance for bulls to extend the move to 4197 and possible 4234.
However, if price loses the 50MA and 4115 support, we may see a move into the pullback zone. Failure to hold the key support at 4027 may bring the First Reaction Zone back into focus.
📌Key Levels to Watch
Resistance:
4,153
4,197
4,234
4,285
Support:
4,115
4,074
4,027
3,984
🔎 Fundamental Focus:
It’s a busy day for speeches, with multiple FOMC members scheduled to speak throughout the session — comments could spark volatility across USD pairs.
Meanwhile, markets are keeping a close watch on the scheduled House vote to approve temporary government funding and reopen the U.S. government.

XAU/USD Intraday Plan | Higher for Now — Keep an Eye on SupportWe have a volatile week ahead as the U.S. government shutdown situation continues to unfold. The first vote has passed, but there is still uncertainty around final approval and timing.
Gold has pushed higher during the Asian session, breaking above the 4027 resistance and is now trading around 4076, sitting just above the 4074 level. A confirmed break and hold above 4074 would likely open the door for further upside toward 4115, with 4153 as the next major resistance target.
However, if price fails to sustain above 4074, we could see a pullback toward 4027 for a retest. If selling pressure increases from there, price may rotate back into the First Reaction Zone, where buyers previously stepped in.
📌 Key Levels to Watch
Resistance:
4074
4115
4153
Support:
4027
3984
3955
3921
3884
🔎 Fundamental Focus
All eyes remain on the U.S. government shutdown situation, with votes and negotiations around reopening in focus. The longer the shutdown continues, the more it disrupts key economic data releases and increases uncertainty — which can keep gold reactive and sensitive to headlines.

XAU/USD Intraday Plan — 3989 Support Holding, Next Stop 4042?Price has broken above 3989 and pulled back to retest the 50MA, which is now holding as support. If bullish momentum continues, the 50MA looks ready to cross above the 200MA, which would strengthen the short-term bullish momentum.
The next resistance is at 4042. A clean break above 4042 could open the move toward 4090.
If buyers fail to hold above 3989, price may slide back into the First Reaction Zone (3957–3918).
Failure to hold that zone could bring the Support Zone and even the HTF Support Zone back into play.
📌Key Levels to Watch:
Resistance:
4042
4090
4142
Support:
3989
3957
3918
3884
3851
3820
3781
🔎 Fundamental Focus:
Not many high-impact releases today. We do have several FOMC members speaking, along with Prelim UoM Consumer Sentiment and Inflation Expectations later.
As always, keep in mind that geopolitical and broader macro sentiment continue to play a major role here — even with a quiet calendar, gold can still react to headlines.

XAU/USD Intraday Plan | Buyers Back in Control?After a period of consolidation, gold has managed to break back above the 3989 level (now turned support) and is currently trading around 4005. Price has also reclaimed the MA50 and is now pushing above the MA200, suggesting buyers are attempting to regain control.
The next resistance sits at 4042 — a confirmed break and hold above this level would open the way for further upside toward 4090.
On the downside, if price fails to hold above 3989, we could see another pullback into the First Reaction Zone (3957–3918). If selling pressure continues we may see the lower support levels tested.
📌 Key Levels to Watch:
Resistance:
4,042
4,090
4,142
Support:
3,989
3,957
3,918
3,884
3,851
🔎 Fundamental Focus
No major economic data releases today. However, a full slate of FOMC member speeches throughout the session could introduce intraday volatility.
Keep in mind that headline risk remains high, and geopolitical / macro sentiment can still move gold even without scheduled news.

XAU/USD Intraday Plan | Buyers Need 3989 BreakAfter breaking below the 3989 support level yesterday, gold tested the First Reaction Zone as anticipated, where buyers stepped in and defended the area.
Price is now trading around 3968, but still below both the MA50 and MA200, which keeps short-term momentum bearish.
For buyers to regain control, we need a clear break and hold above the 3989 level. A break above this area could open the move toward the 4042 resistance, with 4090 possible if momentum continues.
If price fails to reclaim the 3989 level, we may see another retest of the Reaction Zone. Failure to hold that area could expose the lower Support Zone and potentially the HTF Support Zone below.
📌 Key Levels to Watch:
Resistance:
3989
4042
4090
4120
Support:
3957
3918
3884
3851
3820
3781
🔎 Fundamental Focus:
Today has a few medium-to-high impact U.S. releases, including ADP Employment, and ISM Services PMI, which could influence intraday volatility. Later in the session, President Trump is scheduled to speak, which also has the potential to move markets depending on tone and messaging.

XAU/USD Intraday Plan | Support & Resistance to WatchGold tested the $3,753 support during the Asian session and is currently trading around $3,775, holding just below the $3,782 resistance. A clean break above $3,782 would open the way to $3,796 and the major resistance at $3,806. Failure to break and hold above $3,782 could send price back towards $3,768–$3,753 and potentially deeper into $3,728. The moving averages may provide dynamic support on the way down.
📌Key levels to watch:
Resistance:
$3,782
$3,796
$3,806
Support:
$3,768
$3,753
$3,728
$3,712
🔎 Fundamental Focus – Wed, Sep 24
Yesterday, Powell signalled caution, stressing that rate decisions remain data-dependent — keeping gold supported but vulnerable to swings.
Today’s drivers:
🔶Trump speaks
🔶New Home Sales
Expect sharp swings and volatility spikes. Manage risk carefully.

XAU/USD Intraday Plan | Support & Resistance to WatchGold tested the $3,674 resistance yesterday before pulling back to the $3,620 area, where the 50MA provided dynamic support. Price is now trending around $3,646, attempting to recover from the pullback.
For bulls to regain control, we need a clean break above $3,658, which would open the path toward $3,674, followed by $3,690, and an extension to $3,706.
However, a rejection at $3,658 resistance could trigger a deeper pullback into lower support levels.
📌Key Levels to Watch:
Resistance:
$3,658
$3,674
$3,690
$3,706
Support:
$3,644
$3,630
$3,617
$3,594
$3,564
📌 Fundamental Focus – Sept 10
The fireworks start today with U.S. inflation data. Core PPI and PPI figures will be released this afternoon, kicking off a packed midweek that continues with CPI tomorrow and ends with Consumer Sentiment & Inflation Expectations on Friday.
⚠️ Expect volatility to pick up from today onward, with sharp moves likely around each release.

XAU/USD Intraday Plan | Support & Resistance to WatchGold is trading around $3,651, consolidating just under the $3,658 resistance after a strong bullish leg higher. Trend remains bullish above $3,617, but gold is testing key resistance. A breakout could fuel continuation, while rejection raises the risk of a short-term corrective pullback.
A clean break above $3,658 would confirm continuation, targeting $3,674, then $3,690, with an extended move toward $3,706.
On the downside, rejection from current resistance could see a pullback into $3,644, followed by $3,630 and the $3,617 zone. A decisive break below $3,594 would weaken the bullish bias and expose the $3,564 pullback zone.
📌Key Levels to Watch
Resistance:
$3,658
$3,674
$3,690
$3,706
Support:
$3,644
$3,630
$3,617
$3,594
$3,564

XAU/USD Intraday Plan | Support & Resistance to Watch | 04/09/25Gold dropped sharply into the Pullback Zone during the Asian session after the strong rally into the $3,584 resistance. Price is now trending near the $3,550 level, with the 50MA providing dynamic support.
If buyers can reclaim momentum above $3,550, the path opens toward $3,584, and a clean break there would target $3,608. On the downside, failure to hold above $3,525 risks a deeper retracement into $3,506, with extended weakness pointing toward $3,483 and the lower support zones.
📌 Key Levels to Watch
Resistance:
$3,550
$3,584
$3,608
Support:
$3,525
$3,506
$3,483
$3,462
🔎 Fundamental Focus – Rest of the Week
Markets now turn to the U.S. labor data cluster:
Thursday: ADP Employment, Jobless Claims, ISM Services PMI
Friday: NFP, Unemployment Rate, Wage Growth
These figures are likely to be the main catalysts for gold as the week wraps up.
⚠️ Risk Note: Expect elevated volatility, false breaks, and sharp intraday reversals around data drops. Stay disciplined on risk sizing and avoid chasing moves.

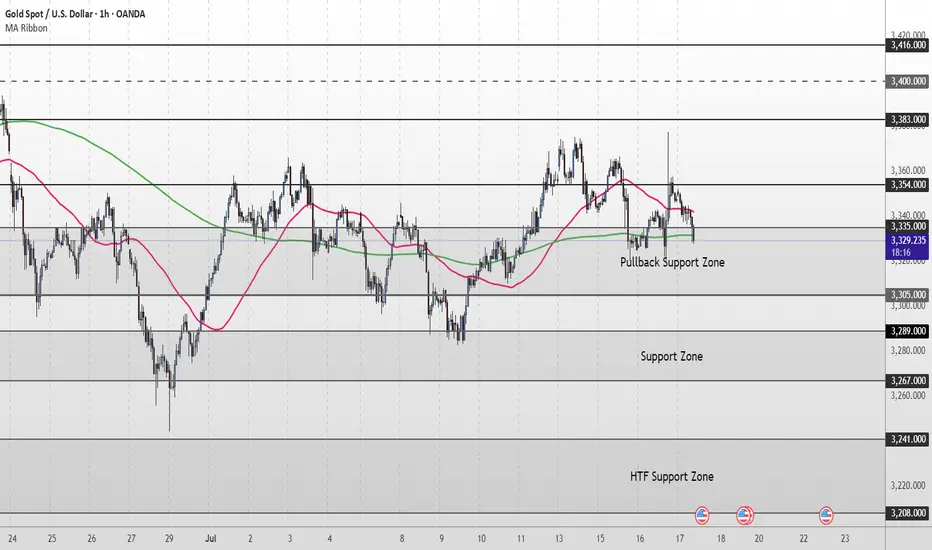
Gold Short Term OutlookYesterday, gold staged a strong rally, pushing up toward 3,377, which was followed by a strong rejection. Price has pulled back sharply and is now testing the Pullback Zone once again.
Currently trading around 3,329, price is caught between the 50MA overhead acting as dynamic resistance and the 200MA below offering dynamic support.
For the bullish structure to regain momentum, we need to see a clean break and hold back above 3,354. This would reopen the path toward 3,383 and 3,400, with 3,416 as a higher‑timeframe target.
If buyers fail to defend the Pullback Support Zone, and price breaks decisively below 3,305, attention shifts to the Support Zone (3,289–3,267). A deeper selloff could then expose the HTF Support Zone (3,241–3,208).
📌 Key Levels to Watch
Resistance:
‣ 3,354
‣ 3,383
‣ 3,400
‣ 3,416
Support:
‣ 3,335
‣ 3,305
‣ 3,289
‣ 3,267
‣ 3,241
🔎 Fundamental Focus – High‑Impact U.S. Data Today
A packed U.S. calendar could drive volatility:
📌Core Retail Sales m/m and Retail Sales m/m
📌Unemployment Claims
📌Philly Fed Manufacturing Index
These red‑folder releases can create sharp intraday swings.
Additionally, multiple FOMC member speeches later in the session could add headline‑driven moves.