IOSTUSDT — At a Major Crossroad: Accumulation or Breakdown?🔎 Overview
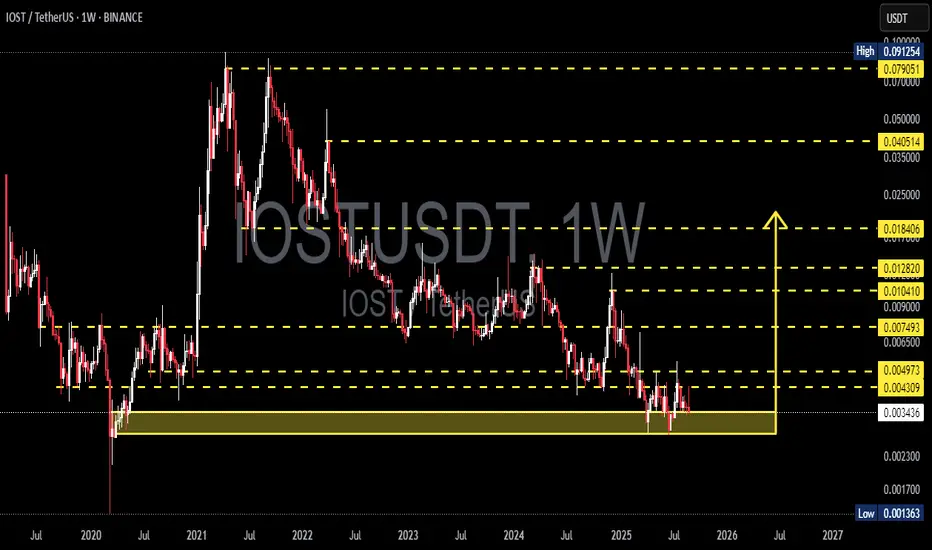
IOST is currently trading inside a multi-year demand zone (0.0024–0.0037) which has repeatedly acted as a strong support since 2019. Each touch of this area has been met with buying interest, leaving long rejection wicks and suggesting hidden accumulation.
However, the broader market structure remains bearish, with a clear series of lower highs since 2021. This puts the market at a critical juncture:
➡️ Will this demand zone once again serve as a base for accumulation and trigger a major reversal?
➡️ Or will selling pressure finally push price below the floor, opening the path to historical lows at 0.00136?
---
📌 Key Technical Levels
Critical Demand Zone: 0.0024 – 0.0037
Nearest Resistance: 0.004309 → 0.004973
Mid-Term Targets: 0.007493 → 0.00900 – 0.01041
Trend Pivot: 0.01282 (a breakout here could shift the macro trend bullish)
Swing Bullish Targets: 0.018406 → 0.040514 → 0.079051
Major Invalidation: Weekly close below 0.0024 = risk of continuation down to 0.00136
---
🟢 Bullish Scenario
1. Early Confirmation: Weekly close above 0.004309 signals the first sign of buyers stepping in.
2. Minor Range Break: Breaking 0.004973 opens the way to 0.007493.
3. Momentum Expansion: Close above 0.007493 would target the supply zone at 0.009 – 0.01041.
4. Full Reversal: Sustained weekly close above 0.01282 could mark the end of the multi-year downtrend, unlocking upside potential toward 0.018406 and possibly higher (0.040–0.079).
---
🔴 Bearish Scenario
1. Failure to break 0.004309 – 0.004973 and another rejection may pull price back into the demand zone (0.0024–0.0037).
2. A weekly close below 0.0024 would confirm a breakdown from demand.
3. Next downside target lies at 0.00136 (historical low), a possible capitulation area before any larger rebound.
---
📐 Pattern & Market Behavior
Range-Bound Accumulation: Current structure is trapped in a narrow 0.0030 – 0.0049 range. Breakout in either direction will define the next major move.
Potential Wyckoff Spring: The repeated wicks below demand suggest liquidation + buyer absorption, a common pattern before strong markups.
But caution: Without a breakout confirmation above resistance, this may still turn into a bull trap.
---
🎯 Trading Idea (Not Financial Advice)
Aggressive Play: Enter within demand 0.0024–0.0037, SL below 0.0024, take partial profits at 0.00431 & 0.00497.
Conservative Play: Wait for a confirmed breakout above 0.00497 and enter on a retest, targeting 0.00749 – 0.01041.
Risk Management: Keep positions small; volatility on small-cap alts can be extremely high.
---
📝 Conclusion
IOST stands at a major decision point. As long as it holds above the multi-year demand, the case for accumulation and reversal remains alive. But if demand fails, the market could revisit 0.00136. Staying disciplined at the key levels is crucial to avoid being caught in false moves.
#IOST #IOSTUSDT #Crypto #Altcoin #PriceAction #TechnicalAnalysis #SupportResistance #DemandZone #Breakout #SwingTrade #RiskManagement #DYOR
Iostanalysis
IOSTUSDT 1WIOST ~ 1W Analysis
#IOST So far it still maintains this block of support. Buy from here with a minimum target of 20%++.

IOSTBTC "INTERNET OF SERVICES" Double Bottom (1500%)#IOST has been in a decline against BTC since inception back in 2018.
It has been painting a Bullish Falling Wedge for 6 years!
Currently consolidating and forming a Double Bottom.
It is very likely this is the cheapest you will be able to pick up IOST (in Bitcoin).
This could very well be a historic buy, with targets up to 1500% away @ the Golde Pocket around 250 Satoshis!
This could take the rest of the year to play out and possibly into beginning of 2025

IOSTUSDT 5DIOST ~ 5D 📈
#IOST Make purchases gradually, After breaking through this resistance line, with a Target of at least 20%++ from here. 🔼

IOST has a very good investment opportunity Hi Everyone;
today we have a good risk to reward Investment opportunity
it is more than 420 times the risk and the chart is look very promising.
I expect breaking the previous bear market key point will clear the way to the final target

Iost Looking Extremely Bulish Seems Like iost has Already bottomed out and getting ready for massive Recovery
forming descending Channel In htfs While testing horizontal Resistance
Macs cross Over about to happen Another confirmation Of Iost Strength
Incase Of resistance And trendline breakout Expecting 300%+ Bullish Wave

IOST "breaks bearish Channel"$IOST "Bearish Channel"
IOST has been trading on downside for pas few months and for now it placed in the bearish channel.so If it succeeds in breaking out bearish channel it more likely it will hit 0.019 level and then is target as mentioned on the chart.before reaching the mentioned target,i expect a small rejection at upper channel line.
However we must be waiting to see more action.
Also we should mention that the Channel has been combined with bullish divergence in the daily RSI. The RSI has now moved above 50, in what is considered another bullish sign.

IOST/USDT - Potential Short ScenarioHello Traders!
The downward price formation of IOST continues. The price is testing the support level of $0.01350
Based on the analysis of senior timeframes, it is possible to assume the continuation of the downward price trend to the levels of January 2021. In this case, we can consider the set of medium-term positions, which we can gain at the support level of $0.00466 in the price range of $0.00466 - $0.00760.
The targets of such purchases will be the levels of $0.01350 and $0.02100
Good luck and watch out for the market
P.S. This is an educational analysis that shall not be considered financial advice

IOST/USDT 2HOUR UPDATEWelcome to this quick IOST/USDT analysis.
I have tried my best to bring the best possible outcome me in this chart.
Reason of trade :- IOST/USDT is triangle pattern create and BUY the green zone
Entry:- buy green zone
Traget:- 30% to 40%
Stop loss:- green box down side candle close
Remember:-This is not a piece of financial advice. All investment made by me is under my own risk and I am held responsible for my own profit and losses. So, do your own research before investing in this trade.
Happy trading.
Sorry for my English it is not my native languages.
Do hit the like button if you like it and share your charts in the comments section.
Thank you...

#IOSTUSDT#IOSTUSDT
Can pullback to the trend line and rise to targets : 0.5 , 0.6 , 0.7
It has good support line.

IOST/USDT 4HOUR UPDATEWelcome to this quick
IOST/usdt analysis.
I have tried my best to bring the best possible outcome me in this chart.
Reason of trade :-iost/usdt is triangle pattern conform and triangle retest and buy the dip and long term hold
Entry:- cmp And buy the dip in green zone
Traget:- 150% to 200%
Stoploss:- $0.04448
Remember:-This is not a piece of financial advice. All investment made by me is under my own risk and I am held responsible for my own profit and losses. So, do your own research before investing in this trade.
Happy trading.
Sorry for my English it is not my native languages.
Do hit the like button if you like it and share your charts in the comments section.
Thank you...

IOST/USDT 4HOUR UPDATEWelcome to this quick
IOST/USDT analysis.
I have tried my best to bring the best possible outcome me in this chart.
Reason of trade :- IOST/USDT analysis is Ascending triangle ready and green zone fast by the dip.
And IOST/USDT is fundamentals is strong .
Entry:- cmp And green zone
Traget:- $0.051,
$0.055,
$0.059
$0.063
Stoploss:- $0.44
Remember:-This is not a piece of financial advice. All investment made by me is under my own risk and I am held responsible for my own profit and losses. So, do your own research before investing in this trade.
Happy trading.
Sorry for my English it is not my native languages.
Do hit the like button if you like it and share your charts in the comments section.
Thank you...

Iost Chart Analysis #iOST USDT 1D Chart SIGNAL by Sajjat Hossen
Risky Call ⚠️
Entry ✅ If 1D Candle Close Above $0.0514
Stop-loss ❌ If 1D Candle Close Below The $0.0484
1D Chart...

IOST/USDT BINANCEIOST/USDT BINANCE
4H candlesticks
A clear bullish uptrend pattern appears to have formed.
From this pattern emerges a symmetrical triangle, which shows an entry point before the break-out.
Also, a stop limit emerges from the golden ration of Fibonacci retracement.
IOST Price (IOST) = $0.05508 -5.12%
BTC = 0.000001152 -5.04%
ETH = 0.00001619 -5.52%
Good Luck
CryptoHellas Team

#IOST resistance retest Swing Long#IOST resistance retest looks bullish.
Go Swing Trade long from given range.
Targets and Stop loss also mentioned.

IOSTIt has reached a significant resistance, which due to the conditions of the Ichimoku cloud, will soon pass this resistance and can increase by 20% to 50% in the short term.
Due to the temporary drop in the price of Bitcoin (pullback), the closer the price is to the yellow areas, the more it can be bought.
The EOY target can be in the range of 12 to 13 cents.
Good luck...

buy iost
This currency can grow well according to Fibo. Targets are specified. It is better to buy in spot mode.

IOST/USDT - we bought!Preconditions:
- bear trap (collected liquidity)
- false breakout on higher timeframe
- local downtrend
Write in the comments all your questions and instruments analysis of which you want to see.
Friends, push the like button, write a comment, and share with your mates - that would be the best THANK YOU.
P.S. I personally will open entry if the price will show it according to my strategy.
Always make your analysis before a trade

IOST 12h Another news and another growthThe previous idea for IOSTUSDT was published a little over 2 weeks ago. Just look at how she pretty worked + 150%
Let's allow ourselves to make another mid-term forecast, especially considering the news that today began to spread across the Internet.
According to Airdrop, IOST holders have the opportunity to receive a DON token, all details can be found on the Internet, and also you need to follow the news updates.
We assume that the growth will continue with the upper target of $0.053-0.055.
If you are already our regular reader, then from the ideas on RIPPLEUSDT and QTUMUSDT you should already know that usually the coin is drained 2-48 hours before the start of the Airdrop.
Reread our previous ideas and see how they worked.
_______________________________
Since 2016, we have been analyzing and trading the cryptocurrency market.
We transform our knowledge, trading moods and experience into ideas. Each "like under the idea" boosts the level of our happiness by 0.05%. If we help you to be calmer and richer - help us to be happier :)

IOST 12h Will there be news and growth or it doomed to fall?Two weeks have passed since the publication of the previous IOSTUSDT idea.
During this time, the IOST price lowered by 40%, as we expected, check the link above!)
The previous insane growth was fueled by an intriguing tweet from IOST co-founder Jimmy Zhong that we should expect some super news on 16 January.
But we either missed it, or the super news never came out.
Please write about it in the comments.
We only saw the news that the coin can now be staked on the Binance exchange.
As we already wrote, there is a cool phrase: "Buy on the rumor, sell on the news".
We hope that our previous warning idea helped to fix profit on Longs in time and keep the deposit from drawdown.
If you look at the IOSTUSD chart today, it looks like the price falls are slowly slowing down, at least small red candles without volumes indicate that there are no aggressive sales yet.
Perhaps another intriguing tweet is expected in the near future?
Then the IOSTUSDT price can easily fly up to $0.024, or even up to $0.035.
The negative scenario of the fall continuation is activated below $0.0125.
_______________________________
Since 2016, we have been analyzing and trading the cryptocurrency market.
We transform our knowledge, trading moods and experience into ideas. Each "like under the idea" boosts the level of our happiness by 0.05%. If we help you to be calmer and richer - help us to be happier :)

IOST 1D How long will it grow?The long unremarkable coin IOST remind of itself very loudly :)
On 8 January, 2021, IOST co-founder Jimmy Zhong tweeted: "On 16.01.2021, expect a 'big' announcement." This was done just in the consolidation, when it was necessary to break the white uptrend. And the process went on, and how it went), such an intriguing tweet brought investors x4 in a week.
But there is a very good phrase:
"Buy on the rumor, sell on the news"
Now the price of IOSTUSDT has come to the first level of $0.024 , where a correction can begin.
But there is still a day before the publication of this "mysterious announcement", and accordingly, there is still time to fly to a much stronger level of $0.35.
We do not see above yet.
If you are a lucky one who has a long IOSTUSD, pull the stop up following the price movement so as not to give your profit to the market!
_______________________________
Since 2016 , we have been analyzing and trading the cryptocurrency market.
We transform our knowledge, trading moods and experience into ideas. Each "like under the idea" boosts the level of our happiness by 0.05% . If we help you to be calmer and richer - help us to be happier :)


IOSTUSDT forming shark pattern | A good long opportunity aheadPriceline of Internet of Services / Tether US is forming a bullish shark pattern and soon the price action will be entered in potential reversal zone.
RSI is oversold.
I have use Fibonacci sequence to set the targets.
Buy between: 0.008236 to 0.008022
Sell between: 0.008426 to 0.008844
Regards,
Atif Akbar (moon333)
